Escola Superior de Ciências Empresariais
Colectânea de Comunicações
do Departamento de
Contabilidade e Finanças
De Janeiro de 2008 a Março de 2011
Presidente
Vice-Presidente
Secretário
Ana Bela Teixeira
Carlos Mata
Conceição Aleixo
INDICE
NOTA INTRODUTÓRIA
CONTABILIDADE E FINANÇAS
5
THE CONTRIBUTION OF FINANCIAL INFORMATION FOR STOCK PRICE VALUE
7
Nuno Texeira; Francisco Carreira; Pedro Pardal e Carlos Mata.
OS FLUXOS DE CAIXA POR ACTIVIDADES E AS FASES DO CICLO DE VIDA DA
EMPRESA: UMA PERSPECTIVA RELEVANTE
29
Maria Teresa Alves; Sandra Nunes e Carlos Mata.
INTERRELATIONSHIP BETWEEN ICT COSTS AND CSR
51
Paula Heliodoro; Rute Abreu; Fátima Abreu e Francisco Carreira.
DETERMINANTS OF FINANCING DECISION ON THE 500 MAJOR AND BEST
PORTUGUESE COMPANIES
71
Nuno Teixeira; Francisco Leote; Pedro Pardal e Rui Brites.
PRÁTICAS CONTABILÍSTICAS NAS COOPERATIVAS DE CONSUMO
87
Carlos Mata e Nuno Teixeira.
A CONTABILIDADE E AS NOVAS TECNOLOGIAS
106
DA ARTICULAÇÃO TEÓRICA À PRÁTICA DA CONTABILIDADE COM RECURSO
ÀS NOVAS TECNOLOGIAS: ESTUDO DE CASO
107
Ana Bela Teixeira; Maria da Conceição Aleixo e Susana Silva.
AS NOVAS TECNOLOGIAS E O ENSINO DA CONTABILIDADE: ESTUDO DE
CASO
131
Susana Silva; Maria da Conceição Aleixo e Ana Bela Teixeira.
A CONTABILIDADE E O SECTOR PÚBLICO
153
FACTORES DE TOMADA DE DECISÃO NA ADMINISTRAÇÃO PÚBLICA
A CONTABILIDADE ANALÍTICA NO POCAL E O GRAU DE IMPLEMENTAÇÃO NO
DISTRITO DE SETÚBAL
181
Ana Bela Teixeira; Pedro Pardal; Carlos Mata e Nuno Texeira.
OS INDICADORES DE DESEMPENHO UTILIZADOS NOS MUNICÍPIOS DO
DISTRITO DE SETÚBAL
201
Ana Bela Teixeira; Carlos Mata; Pedro Pardal e Nuno Texeira.
AUDITORIA
230
EXPECTATION GAP EM AUDITORIA
231
Paula Heliodoro.
EXPECTATION GAP IN AUDITING
251
Paula Heliodoro e Francisco Carreira.
NOTA INTRODUTÓRIA
De acordo com os Estatutos da Escola Superior de Ciências Empresariais
(ESCE) do Instituto Politécnico de Setúbal (IPS), os Departamentos são
estruturas de coordenação e orientação científica, técnica e pedagógica (Art.
37º dos Estatutos da ESCE/IPS), que têm como objectivo, a realização de
actividades de ensino, de investigação e desenvolvimento, em consonância
com os restantes órgãos de Gestão da Escola.
Nesse sentido, o Departamento de Contabilidade e Finanças da ESCE do
IPS dando cumprimento ao plano de actividades do ano 2011 e no âmbito
das suas competências, nomeadamente, assegurar a continuidade e
qualidade da intervenção do corpo docente na investigação e na criação e
divulgação do saber em cada um dos domínios de actividade da ESCE/IPS,
apresenta a colectânea de Comunicações dos Docentes do Departamento.
Esta publicação reúne uma série de artigos científicos elaborados pelos
docentes do Departamento de Contabilidade e Finanças da Escola Superior
de Ciências Empresariais do Instituto Politécnico de Setúbal, de Janeiro de
2008 a Março de 2011.
Os trabalhos apresentados foram publicados em eventos, como jornadas,
congressos e conferências internacionais de relevância sobre Contabilidade e
Finanças.
CONTABILIDADE E
FINANÇAS
THE CONTRIBUTION OF FINANCIAL INFORMATION FOR STOCK PRICE VALUE
Autores
Nuno Teixeira (ESCE) Francisco Carreira (ESCE)
Pedro Pardal (ESCE) Carlos Mata (ESCE)
EVENTO:BAA Annual Conference 2010, Cardiff, UK
DATA DO EVENTO: 31 de Março a 01 de Abril de 2010
ÁREA TEMÁTICA: FINANÇAS
ABSTRACT
Economic globalization and the increasing competitiveness that organizations are subject, produced in general, profound changes in the design of information systems and in particular in the accounting systems. Seeking to reduce uncertainties about economies changes, there was an increase investigation on the critical factors for decision making, where accounting information is a key element.
The constant changes of the environment generate higher levels of uncertainty and increase the complexity of managing organizations. Therefore, managers and investors need to measure the performance of organizations based on the adopted strategy and by using different perspectives of analysis.
This paper aims to highlight the importance of accounting and financial information on stock prices value, through a literature review based on the identification of: (i) the main studies on the impact of accounting and financial information in the formation of stock prices; (ii) the developed evaluation methodologies and variables used, based on accounting and financial reporting; and (iii) the problem of "earnings management" and financial analyst opinion, and their impact on stock prices.
The performed literature review allowed a contribution to a better understanding of the theoretical knowledge and commonly adopted practices that could work as a basis to future researches.
1. FINANCIAL INFORMATION AND STOCK PRICES
Over the years, several studies have been developed on the subject of “market based accounting research”. The objectives of those works can be grouped according to their nature in (Pirie and Smith, 2008):
• Explanatory studies: focus on the relevance of accounting information to explain the variation in share prices over time and in different markets;
• Predictive studies: focus on the ability of accounting information to predict prices and future profitability of shares.
1.1. Explanatory Studies
These studies, investigate the relevance of financial information to explain the change in share prices. To this end, this stream of investigation identifies the financial variables with greater explanatory power and accounting policies with an effect on the variation of stock prices (Pirie and Smith, 2008). Next, we present the main results obtained on those studies:
related to the cash flows generated in order to guarantee the desired level of dividends. Another result, was the evidence that continued payment of dividends over time influences market behaviour;
• Donnelly and Walker (1995) showed that share prices were related to the expected business income in the following year, and also that U.S. market anticipate much earlier that effect than the United Kingdom market;
• Green et al (1996) found that current residual income (treasury method) strongly explain the market-to-book premium (shares prices less equity book value);
• Ariff et al (1997) showed that changes in unexpected earnings have a strong effect on share prices. For each increase unit in earnings, there is in the same direction, a change of about 75% in the share price;
• Collins et al (1997) made a longitudinal study with a period of 40 years, where they investigate the importance of earnings and equity book value in the formation of share prices. The authors created a regression model that aimed to explain stock prices with companies’ level of earnings and equity. The evidence showed that the explanatory power of equity book value has increased over the years when compared to earnings;
• Rees (1997), with a sample of industrial and commercial firms in the UK, linked the price to book value and residual income (treasury method) with stock rates and found that, those variables explained more than 50% of the variations. Looking beyond, they also explore the effect of indicators, such as dividends, debt and investment expenditure. The evidence showed that earnings distributed as dividends had a greater impact on share values than the level of retained earnings and, finally, that the level of investment was positively related to securities market value;
• Barth et al (1998) verified the importance of equity book value to explain stock prices in contrast to earnings, particularly in firms that filed bankruptcy. Using a sample with more firms, regardless of their financial situation, they also verified that, as firms’ financial health is getting worse, book value explanatory power increases, and earnings decreases. Finally, they found that in industries where intangible assets are important, earnings have a better explanatory power, while in other industries was equity book value that better explained share prices;
• Hand and Landsman (1998) related stock prices not only with book value and earnings, but also with dividends and net capital contributions. They concluded that these variables explained more than 80% of prices variation and that the distribution of high dividends related to good prospects of future residual income, especially in companies with a weaker financial position in the present;
• Langli and King (1998) related equity book value and earnings with share prices in United Kingdom, Germany and Norway markets. In their model, the two accounting
variables explained more than 70% of prices variation in the United Kingdom, 60% in Norway and 40% in Germany, what reflects the differences in their accounting systems. At the same time, they observed that equity book value was more significant in explaining share prices in Germany and Norway than in the United Kingdom; • Frankel and Lee (1999) made their investigation on the explanatory power of the two
main accounting variables using data from 20 countries, including three regions, North America, Europe and Asia – Pacific, and through a regression model based on general residual income model, reported book values and earnings forecasts, in order to estimate share prices. This estimative was included as an explanatory variable in another model, relating share prices with book value and earnings. They concluded that the model explained 88% of the variations in the U.S. and 72% in other countries; • Bao and Chow (1999) analysed China listed companies, which had an obligation to
prepare financial statements based on International Financial Reporting Standards (IFRS). They concluded that earnings and equity book value based on IFRS, explained better the behaviour of the stock market, and that the explanatory power of share prices by these accounting variables, increases over time;
• Graham and King (2000) related share prices with current book value and current residual income using data from various Southeast Asian countries: Indonesia, Korea, Malaysia, Philippines, Taiwan and Thailand. The coefficients of both variables were relevant in all countries. The explanatory power of the model varied significantly from 24% in Taiwan, to 55% in Thailand and 90% in the Philippines. They also demonstrated that more conservative accounting system were less value relevant; • Pirie and Smith (2008) studied Malaysia companies using a set of empirical models
based on Ohlson model. They found that equity book value and earnings explained more than 70% of prices variation. Also that, by introducing the dividends and next year expected earnings, the explanatory power of the model would increase. In other way, the introduction of capital contributions as a variable had no influence.
In summary, on these investigations there was a great concern on the identification of which variables have greater significance to explain the behaviour of capital market and the formation of share prices. In addition, another common concern on these studies was to evidence the importance of variables analysis over time and based on firms’ financial health evolution. The effect of different accounting systems cultures was also explored.
1.2. Predictive Studies
In this stream of investigation, the main objective is to assess whether accounting information helps to forecast future value of a share or the probably return on investment. To this end, the
greatest predictive power and, in parallel, if the analyst information have a predominant role, or not, in the formation of future share prices (Pirie and Smith, 2008).
We can summarize the main results obtained in this stream of investigation, as followed: • Frankel and Lee (1998) found that there was a strong correlation between analyst
earnings forecasts, estimated through the residual income, and the verified share prices. These predictions explain more than 70% of the variation verified in market value of U.S. nonfinancial firms. They also showed that in a long-term the creation of portfolios based on value-to-price could generate more than twice of the return of portfolios based on the book-to-value. In addition, the creation of portfolios that combine the value-to-price with analyst expectations would increase further stocks return;
• Dechow et al (1999) investigated a set of empirical models based on Ohlson model to estimate the future stock prices value, and found that the developed models could explain 40% to 60% of price variations. Also found that the explanatory power of these models was slightly higher than the model based on next year expected earnings. By the constitution of portfolios, they found that the models where analyst expectations were not included, had a better predictive power;
• McCrae and Nilsson (2001) analysed the Swedish capital market and the ability of residual income forecasting models and Ohlson forecast model, with and without analysts' forecasts effect. They found that the Ohlson model had a higher predictive power and that analyst opinion increases the prediction ability of stock prices in both models;
• Ferreira et al (2008) analysed the predictive power of three models, residual income, abnormal earnings growth and free cash flow, in firms listed on the Sao Paulo Stock Exchange (BOVESPA) during the period 1995 to 2002. They concluded that between 1995 and 1999 the residual income model had a greater ability to forecast stock prices, but from 2000 the abnormal earnings growth model gained supremacy over the residual income model. It should also be noted that in all the years the free cash flow model showed a lower ability to predict prices compared to other two models. Thus, these studies showed the variables and models with higher relevance on predicting future stock prices. The studies used mainly the Ohlson and residual income models. However, contradictory findings were observed regarding the impact of analyst opinions on securities markets prices.
The explanatory studies primary objective is to segregate the accounting/financial variables that better explain the value of stock prices, including earnings, equity book value, dividends, annual cash flow, assets value and debt value.
The predictive studies intended to assess the predictive power for future stock prices, and normally, they use business valuation methods to estimate the future price of shares. According to several authors in particular, Damodaran (2005), Brealey and Meyers (1998), Ross et al (2002) and Neves (2002) these methods, considering the used variables and calculation formulas of the different models, can be organized into the following approaches:
• Dividends (Gordon, 1956; Malkiel, 1963, Fuller and Hsia, 1984): Models of Gordon, Half, Malkiel and Dividend Discount Model;
• Present Value of Growth Opportunities (Modigliani and Miller, 1961);
• Abnormal Earnings (Stewart III, 1991): Residual Income Model - Market Value Added and Treasury Method;
• Discounted Cash Flows (Meyers, 1974; Rappaport, 1986 and 1998, Jensen, 1986; Damodaran, 1996): Free Cash Flow to Firm, Free Cash Flow to Equity, Adjusted Net Value.
More recently, Ohlson (2005) developed the so-called Abnormal Earnings Growth model, which brought a new approach to forecast future stock prices through the intersection between financial information, based on quantitative and qualitative variables.
2.1. Dividends approach:
Over the years, several models have been developed for evaluating securities based on the principle that dividends are the main income for investors. However, the general model of evaluation, takes also into account that small investors can benefit from two types of income: capital gains and dividends.
where: P0 = securities present value considering getting dividends and a capital gain at the end of the period, in order to guarantee a certain return, D1 = dividends at the end of the period; P1 = stock price at the end of the period, and Ke = expected return.
However, since is expected that companies operate under the assumption of continuity, the more distant is the period of securities disposal, the more capital gain will tend to zero and lower will be the influence of its current value (Gordon and Shapiro, 1961):
General model:
P0 = D1 + P1 (1+Ke) (1+Ke)
where: P0 = securities present value considering getting perpetuity dividends and a constant growth rate, in order to guarantee a certain return, D0 = dividends for the period 0; Ke expected return and g = constant growth rate.
However, there are several cases where companies, as a result of implemented business strategies, present in the early years a return with an abnormal growth rate, and when reaching their normal activity level, a growth rate basis.
For these cases Malkiel (1963) created a model with two activity periods: a first abnormal growth and a second with a constant growth rate:
where: P0 = present value of the title considering getting dividends over a period of abnormal growth and a constant growth rate from one point to guarantee a certain return, D0 = get dividends at time 0; Ke = Expected return; g1 = abnormal growth rate; gn = growth rate constant and T = Number of years of abnormal growth.
Finally, Fuller and Hsia (1984), created another model that predicts the possibility of stock prices valuation considering three stages of growth and in order to take into account the progressive evolution of activity over the years until it reaches cruising speed. This method was called Half Model:
where: P0 = present value of securities considering getting dividends in 3 growing seasons, in order to guarantee a certain return, D0 = dividends get at time 0, Ke = expected return; g1 = abnormal growth rate; g2 = growth rate through; gn = Growth rate constant T1 = number of years of abnormal growth and T2 early years of steady growth.
Also, from dividends point of view it could be used the dividend discount model, which consists in the actualization of cash flow from the annual dividends, and establishing a constant growth rate from a certain period, for earnings distribution (which origins the so-called residual value). This method is normally used when different dividends values are estimated in each financial year during the first estimated years.
T - 1
Malkiel Model: P0 = D0 x (1+g1) x 1 – (g1 - gn) x 1 + g1 (Ke – g1) (Ke - g1) 1 + ke H (Half) Model: P0 = D0 x [ (1 + gn) + T1 x (g1 - gn) + (T2 – T1) x (g2 – gn)] (Ke – gn)Where: ge = Growth rate of equity forever after year n.
We can conclude that in this approach, it is the income distribution to investors that will determine the future value of securities.
2.2. Present Value of Growth Opportunities approach:
This approach is based on the valuation model developed by Modigliani and Miller (1961), in which investors may prefer to receive dividends, if they can improve the capital return by that way, rather than investing them consecutively in the company. To help this decision making, was developed a model for the companies’ evaluation based on their growth opportunities (PVGO):
In this model, the value of the security depends on:
• Generate income for share, without the effect of growth in activity (EPS);
• Abnormal profitability of the company (ROE) as a result of return demanded by investors (Ke);
• Where ROE> Ke, investors should not require dividends because the company will b able to invest in projects with higher returns, what will result in a higher future income through gains;
• Where ROE < Ke, investors should require dividends because the company can not invest in projects with higher returns, what results in a more attractive income through dividends.
We can conclude that in this approach, the future price of securities is clearly dependent on companies’ ability to generate a higher return than normal value, and also of the income
PVGO:
P0 = EPS + ROE – Ke x EPS x (1 – d)
Ke Ke Ke – g
PVGO
Dividend Discount Model:
Equity Value = Σ
DPS + RV
(1 + Ke)
(1 + Ke)
With Residual Value = DPSn+1
Ke – ge
i = 1 n
n i
Present Value of Cash-Flows
Dividend Discount Model:
Equity Value = Σ
DPS + RV
(1 + Ke)
(1 + Ke)
With Residual Value = DPSn+1
Ke – ge
i = 1 n
n i
2.3. Abnormal Earnings approach:
Estimated securities value will depend on the ability of business to generate results that can bear the cost of invested capital. Therefore, these models take into account not only the level of profitability for shareholders, but as well, the amount of investment needed for normal activity. There are two models that differ by created value analysis:
• Business ability to create value for investors, both owners and financial institutions (Market Value Added model);
• Business ability to create value for owners (Treasury Method).
These models take into account companies’ ability to generate results higher than the cost of capital used to finance the assets necessary for supporting normal activity. To assess this ability Stewart III (1991) introduced the concept of Economic Value Added, which although very similar to the indicator Residual Income, previously introduced by Anthony (Anthony and Govindarajan, 2001), quickly became an international benchmark in measuring the creation of value:
where: t = income tax rate and WACC = weight average cost of capital.
WACC shows the cost of capital used by a company for financing its activities, considering the cost and the relative weight of each financing form. WACC can be obtained from the following formula:
where: CP = Equity, A = Net Assets (Total Investment), Ke = Cost of Equity (the listed company is usually calculated using the Capital Asset Pricing Model (CAPM), P = Paid Debts; Kd = Cost of Financing (rates negotiated with creditors) and t = rate of taxes.
Economic Value Added:
EVA = Operational Income x (1 – t) – Net Assets* WACC
Thus, the estimated value of securities will result, in large extent, on the ability of companies to generate over time, income higher than the cost of activities’ funding, which creates value for the owners. The methods on this approach include the Value Added Market and the Treasury Method, which are based on the premise that in determining the future prices should be taking into account assets current value and abnormal earnings, for facing the expected costs of funding sources.
In MVA it will be measured the ability of net operating income to generate the sufficient results to support the return demanded by investors, owners and financial institutions, and taking total investment into account.
In the Treasury Method it will be measured the ability of net income from all activities of the company (including operational activities, financial and extraordinary) to overcome the return expected by the owners, and considering only their investment part.
Comparing to the perspective in present value of growth opportunities, which compares the profitability to generate with profitability demanded by shareholders, the perspective of abnormal earnings determine the value of securities based on companies' ability to create value that exceed the cost of capital of the investment required by companies’ activity.
2.4. Free Cash Flow approach:
This approach is based on the study of future cash flows, to determine companies and securities current value, through the following methods: Free Cash Flow to Firm, Free Cash Flow to Equity and Adjusted Net Present Value.
The difference between the methods is basically on the constitution of the cash flow, on the discount rate used during the period of analysis and in more specific situations.
The method of Free Cash Flow to Firm (FCFF) is the estimation of companies’ ability to generate future cash flows. These cash flows should pay all stakeholders of the company
Market Value Added (MVA):
MVA = A (year 0) +
Σ OI x (1 – t) - A * WACC - Debts (year 0)
Σ
(1 + WACC)
Treasury Method:
Value of Equity = E (year 0) +
Σ NI - Ke * E
Σ
predictions are supported by debt ratio stability and, consequently, on the average cost of capital.
The total company value is estimated by discounting the cash flows generated by operating activities that should be able to pay the equity and external capital demanded returns. To this value, it should be added the value of assets not allocated to operating activity, such as property for lease, treasury and investment, which allow investors to benefit from an extra income. The calculation process of the cash flows is as follows:
+ / - Operational Income * (1 - t) + Non-Cash Expenses
- Variation of Investment in Working Capital - Variation of Investment in Fixed Capital
= Operating Cash Flow
+ / - Variation on Non-Operating Assets = Activity Free Cash Flow
In practice, projections are made for n periods where is expected that the company will have a strong growth, and assuming from the last estimated year a constant growth rate. This is, because it is considered that activity reaches its cruising speed, from that period. Finally, equity value is obtained by the difference between the company value and the debt value:
Equity Value = Company Value – Debt Value
It should be mentioned that because cash flows are being calculated by considering the total capital invested, in order to verify existing funds to reward shareholders and creditors, the discount rate used is the weighted average cost of capital (W) and the used residual value growth rate (gu) is the one from a company with no debt (Neves, 2002).
The method of Free Cash Flow to Equity (FCFE) consist in the residual cash flow after all financial obligations are fulfilled, including variation of investment in working capital, variation of investment in fixed assets and interest debt. This method is recommended for estimating the value of companies with higher growth rates in a short term, as it takes changes on paid liability into account.
Free Cash Flow to Firm:
Equity Value = Σ OFC + Σ NO FC + RV - Debt (year 0)
(1 + W)
(1 + W) (1 + W)
With Residual Value = FCn+1
W – gu
i = 1n n
i = 1 n
i I
Present Value of Cash-Flows
Free Cash Flow to Firm:
Equity Value = Σ OFC + Σ NO FC + RV - Debt (year 0)
(1 + W)
(1 + W) (1 + W)
With Residual Value = FCn+1
W – gu
i = 1n n
i = 1 n
i I
The FCFE represent the net financial surplus generated by operating, investment and external financing activities, which come available to the capital holders according to the following formula:
+ / - Net Income
+ Non-Cash Expenses
- Variation of Investment in Working Capital - Variation of Investment in Fixed Capital
– Principal Repayments
+ Net Debt Issues
= Free Cash Flow to Equity holders
The projections are made with the same principles of the previous method, calculating the free cash flows during periods of higher growth. When activity is stable, it is accepted from the last estimated year a constant growth rate.
In this model, free cash flows represent the available funds to capital holders, so equity cost (Ke) is used as the discount rate and the residual value growth rate (g) is the sustainable growth rate based on equity profitability.
The last method is the Adjusted Net Present Value (ANPV) and represents cash flow generated, by one side from business economic viability without the effect of financial structure, and on the other hand by tax savings according to the selected funding sources. It is the ideal method to evaluate companies with high business diversification, since it will permit to evaluate independently each business without considering the associated debt. Financing is analyzed in a global way in the company and it is advisable to evaluate companies with higher liabilities. So companies’ total value comes from the following cash flows:
+ / - Operational income x (1 - t)
+ Non-Cash Expenses
- Variation of Investment in Working Capital - Variation of Investment in Fixed Capital
= Operating Cash Flow
+ / - Variation on Non-Operating Assets
Free Cash Flow to Equity:
Equity Value = Σ NCF + RV
(1 + Ke)
(1 + Ke)
With Residual Value = NCFn+1
Ke – ge
i = 1 n
n i
Present Value of Cash-Flows
Free Cash Flow to Equity:
Equity Value = Σ NCF + RV
(1 + Ke)
(1 + Ke)
With Residual Value = NCFn+1
Ke – ge
i = 1 n
n i
+ Value of tax savings = Total value of the company
The discounted cash flows result from the combination of the following three effects:
• The value of operating assets without considering debt, is determined by net operating cash flows generated by those assets (OCF), and assuming a residual value (RV) when it reaches business cruising speed;
• The value of non-operating assets without considering debt, is determined by net non-operating cash flows generated by it (NOCF);
• Debt created value is determined by the present value of tax savings obtained plus the residual value that should represent the debt evolution on a constant rate that is equivalent to the growth on operating cash flow.
In this model, the discount rates used are: (i) to determine assets value, should be use the economic cost (K u - profitability that the business should be able to generate), as it is intended to verify its capacity to generate surpluses without considering the financial structure; (ii) to determine the value of tax savings should be used the cost of external capital (K d) that represents the market value of debt.
2.5. Ohlson Abnormal Earnings Growth Model:
The model is based on the assumption that abnormal earnings of a period are linked to the growth of abnormal earnings in the previous period, and also to the information on companies expectations observed at the end of the previous period.
Adjust Net Present Value
Firm Value = Σ OCF + Σ NOCF + RV
(1 + Ku)
(1 + Ku) (1 + Ku)
With Residual Value = CFn+1
Ku – gu
Debt Value
= Σ
t x FC + RV
(1 + Kd) (1 + Kd)
With Residual Value = t x FCn+1
Kd– gu
i = 1n n
i = 1 n
i i
Present Value of Cash-Flows
i = 1 n
i n
Equity Value = Firm Value + Taxes
Savings Value – Debt (year 0)
Thus, the researcher created a relationship between the evolution of abnormal earnings for different periods (Linear Information Dynamics), for what is not necessary to consider a constant growth rate over time - a major problem of most valuation models. Additionally, introduced the variable “other information” (typically the analyst expectations) that helps to optimize the predictive power of the model. Therefore, the evaluation function is as follows:
The Ohlson model is yet based in the following additional assumptions:
• The calculation of abnormal earnings is performed using the Residual Income method (based on the Treasury Method): Residual Income = Net Income (NI) - Ke x (Equity n-1);
• It is assumed that the equity of a period is a result of equity from previous period plus the net income adjusted for dividends paid: Equity (n +1) = Equity (n) + NI (n +1) - DIV (n +1).
Ohlson intended with his model, to explain estimated share prices, based on companies’ ability to generate abnormal earnings and analyst opinions regarding the evolution of securities.
Additionally, he tried to establish relationships between the results of each exercise in order to avoid establishing perpetual growth rates, which represent one of the major problems on the other methods. Therefore, the abnormal earnings growth model is one of the most used models in recent studies on the formation of stock prices.
Stock Price
Discount Rate Abnormal Earnings in
Period 1 Abnormal Earnings in Period 0
Other Information on Earnings Stochastic Errors
Parameters persistence
Evaluation Function
3. ANALYST OPINIONS AND THE FORMATION OF STOCK PRICES
In continental Europe, reports on listed companies are rarely made by "independent" analysts. In almost cases, those who produce the report (not always an analyst) works for an intermediary. Thus, the question that arises is whether the views of analysts should be considered as a reliable indicator of expectations about quoted companies.
Fabrizio (2002) refers to the existence of conflicts of interest, because often, the analyst works in intermediaries with a direct interest in market dynamics: investment banking activities; traditionally commercial banking services; brokerage and in entities issuers of financial instruments.
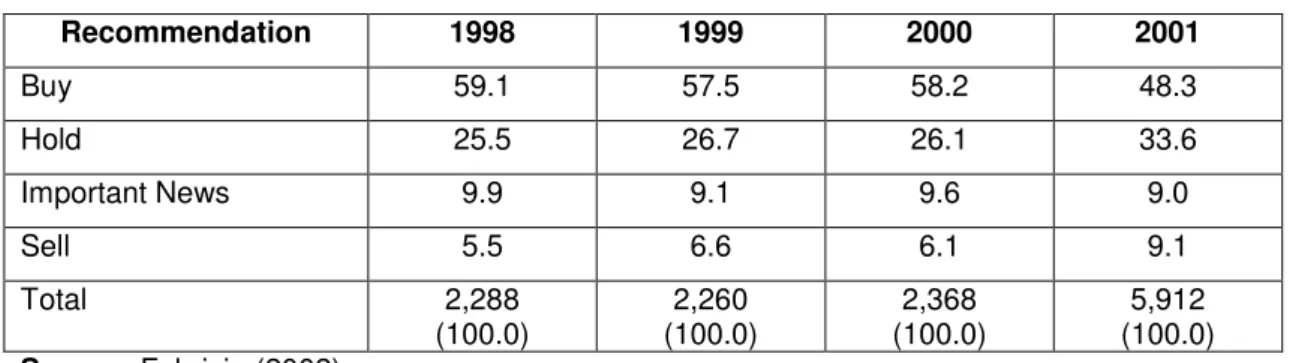
To prove the above, we show the example of Italian analysts' reports, between 1998 and 2001, where the vast majority recommended the purchase as a way to improve market dynamic.
Table 1 – Analysts’ reports from 1998 to 2001 in Italy
Recommendation 1998 1999 2000 2001 Buy 59.1 57.5 58.2 48.3 Hold 25.5 26.7 26.1 33.6 Important News 9.9 9.1 9.6 9.0 Sell 5.5 6.6 6.1 9.1 Total 2,288 (100.0) 2,260 (100.0) 2,368 (100.0) 5,912 (100.0) Source: Fabrizio (2002).
For example, the definition of price targets in Portugal is performed as follows:
• The Portuguese Securities Markets Commission (CMVM) in its Book No.14 on Securities Markets, issued in August 2002, specifically in the article "Methods of calculating price targets and recommendations for investments", suggests the use of free cash flows and abnormal earnings methods;
• The research reports of brokerage firm Fincor contain estimations of price targets, considering the free cash flow to firm method. Predictions are performed with different rates for the weighted average cost of capital and with different growth rates;
• The price targets set by some banks, such as the Portuguese Commercial Bank and Portuguese Investment Bank do not mention the methodology used and the assumptions upon which the forecasts were made.
If we add the fact, that price targets periodically determined by several entities are reviewed without major changes to contextual assumptions, is undeniable that many questions arise about the seriousness of the information provided to the market.
Thus, it is urgent to understand to what extent the views of specialized financial institutions in the national capital markets, may be an indicator of reference on issuers entities and evolution of their securities.
4. THE EFFECT OF "EARNINGS MANAGEMENT"
In recent years, the financial scandals with large firms in the U.S. that were considered models of business success, such as Enron, Tyco and Worldcom have reinforced the need for the existence of accounting and financial information accurate for the investor.
In addition, several studies investigate the preparation of financial information and the origins of less reliable data. Viana (2005) and Mendes and Rodrigues (2007) refers to a set of causes for the existence of earnings management, which derivate from the capital market, contracts, regulation, commercial aspects, accounting standards and from the relationship between capital property and management control.
The causes resulting from the capital market are:
• Providing a positive outlook about the short-term returns of the securities and achieve a lower cost of capital;
• Meet analyst forecasts in order to not negatively influence future expectations of stock prices;
• Avoid large increases of earnings, making it difficult to maintain the same level of success in future years;
• Provide overvalued earnings expectations when issuing new shares and as a result getting greater cash inflows to the company;
• Provide less positive results in situations of management by out, generating purchase prices of the securities for managers below the real value.
For the contracts we find the following facts:
• Often, the managers' remuneration is linked to supplements based on earnings and future share prices, leading to the provision of overvalued information;
• The negotiation of financing contracts may also lead to overvalue of financial information in order to reduce the company's financial risk and increase their bargaining power with the banks.
Concerning the level of regulation:
• In sectors with higher level of regulation, such as financial institutions, there may be a more tendency to issue financial information with greater degrees of solvency and liquidity;
• In larger companies there may be a negative disposition to earnings manipulation, trying to hide profitability and avoid the intervention of political authorities (for
The commercial aspects that should be noted are:
• If the existence of financial information to demonstrate that economic and financial success will facilitate the achievement of larger businesses, as customers have increased guarantees, on the other hand, it can also help to a better negotiation power with suppliers and financers, since it demonstrates the company ability to fulfil the obligations on time.
In relation to accounting standards we verified that:
• The flexibility of rules may allow managers to select alternative methods or criteria for accounting recognition and measurement that will reflect the desirable company's image and not the true picture of business reality. It is the case of materiality and prudence principles or the estimated useful lives of tangible assets;
• The lack of regulations that follow the introduction of new contracts and financial instruments.
Finally, as for the relationship between capital ownership and management, we found that in companies where managers are different from shareholders (owners), likely it may exist a dissemination of higher earnings, because managers with variable remuneration think first on increasing their wealth and only next to create value for shareholders.
Some studies show, that companies with managers differing from owners are more likely to smooth results in order to keep their jobs and stable growth expectations for the business. Thus, it is not surprising that over the years have been carried out several studies related to the importance of financial information on stock prices and based on “Earnings Management”. Some of those studies and their results are:
• Chow and Rice (1982) found that the negative opinion of auditors had a negative impact on stock prices;
• Ransom (1985) found that inventory and depreciation policies, constantly influenced firms’ earnings increasing the expectation with the content of information. They also found, that the lack of consistence on the used policies led to an increased volatility in stock prices and it had a higher effect on firms with more issued stock options; • Opong (1995) proved that information on interim reports had a positive correlation
with the formation of stock prices;
• Schleicher and Walker (1999) found that there was a positive correlation between the information and expectations highlighted in annual reports regarding firms’ operations and finances, and the formation of stock prices;
• Schadewitz et al (2002) found that, when disclosed information was in accordance with the expectations, investors reacted on the day of publication of the report. When the information released was lower than expected, the market took another day to
respond. Finally, when disclosed information was higher than expected, the market would take another three days to respond;
• Tonge et al (2003) studied the Enron case and concluded that the performance evaluation system was considering income as an indicator and not the value created. In addition, there was a great lobby capacity with the government and auditors which led to successive disclosure of false information;
• Kirschenheiter and Jorgensen (2003) found that managers of firms with less variance in cash flows published more information. Thus, firms with greater disclosure of information had also lower “betas”;
• Chang et al (2006) found that, when firms managers certified their financial statements under oath, investors looked with greater certainty for businesses and it was reflected in better stock prices;
• Johnson and Schwartz (2005) evidence that firms, which advertised information through press releases prior to the issuance of management and financial reports, were getting higher stock prices;
• Davis-Friday et al (2005) observed that, in the Mexican firms which have decided to enter the U.S. market, their stock prices were explained essentially by the equity book value and earnings. Such evidence was related to the fact that Mexican investors are less concerned about the financial information due to less regulation in the Mexican law;
• Soonawalla (2006) found that in the case of joint ventures the aggregation of information had a negative impact on forecasting and on the value relevance of information available to investors. This evidence was more pronounced in the U.S. in a comparative analysis to the Canadian and UK reality;
• Malacrida and Yamamoto (2006) found that firms with higher levels of financial disclosures had less volatility on share prices. In the other hand, firms with lower level of disclosure were more volatility on stock values;
• Dedman et al (2008) carried out an analysis to the biotechnology/pharmaceutical sector where intangible assets have a key role and found that, the market reacted more to the disclosures about the amounts spent on research and development than to the disclosures on earnings.
CONCLUSION
This study proved the role of financial reporting in the formation of stock prices through a deep literature review on several investigations of international nature, and where were identified the most relevant financial variables, the models to estimate the future value of shares, the problem of price targets (calculation and analysts' opinions) and the impact of
so-We conclude that financial information is of great importance to explain the volatility of prices and in the preparation of future share prices. At the same time, it became clear that the analyst opinions and earnings management can contribute to the development of less reliable financial information, which could substantially harm the investors who use the capital market to implement their savings.
We also find that there is a lack of empirical studies on the Portuguese stock market, where financial variables, models, price targets and analysts’ opinions are taking into account, in an equivalent way as developed in this work. Therefore, our commitment to the future is to develop that investigation and contribute to a better knowledge on the formation of stock prices on Portuguese market.
REFERENCES
Ariff, Lohn and Chew (1997), “The impact of accounting earnings disclosures on stock prices in Singapore”, Asian Pacific Journal of Management, Vol. 14, nº 1, April, pp. 17-29.
Bao, B. H. and Chow, L. (1999), “The usefulness of earnings and book value for equity in emerging capital markets: case China”, Journal of International Financial Management and Accounting, Vol. 10, pp. 85–104.
Barth, Mary; Beaver, William, and Landsman, Wayne (1998), “Relative valuation roles of equity book value and net income as a function of financial health”, The Journal of Accounting and Economics, Vol. 25, February, pp. 1-34.
Brealey, Richard and Myers, Stewart (1998), “Princípios de Finanças Empresariais”, 5ª Edição, McGraw-Hill, Portugal.
Chang, H., Chen, J., Liao, W. and Mishra, B. (2006), "CEOs'/CFOs' swearing by the numbers: does it impact share price of the firm?", The Accounting Review, Vol. 81, pp.1-27.
Chow, C. W. and Rice, S. J. (1982), “Qualified audit opinions and share prices – an investigation”, Auditing: A Journal of Practice & Theory, Fall, pp.35-53.
Collins, Maydew and Weiss (1997), “Changes in the value relevance of earnings and book values over the past forty years”, Journal of Accounting and Economics, Vol. 24, pp 39-67. Comissão de Mercados de Valores Mobiliários (CMVM) (2002), “Caderno nº14 dos Mercados de Valores Mobiliários”, Agosto.
Damadoran, Aswath (2005), “Damodaran on Valuation – Security analysis for investment and
corporate finance”, 2ª edição, John Wiley and Sons.
Dechow, P.; Hutton, A. P., and Sloan, R. (1999), “An empirical assessment of the residual income valuation model”, Journal of Accounting and Economics, Vol. 26, pp 1-34.
Dedman, Elisabeth; Lin, Steven W-J; Prakash, Arun and Chang, Chun-Hao (2008), “Voluntary disclosure and its impact on share prices: evidence from the UK biotechnology sector”, Journal of Accounting and Public Policy, Vol 27, nº 3.
Donnelly, R. and Walker, M. (1995), “Share price anticipation of earnings and the effect of earnings persistence and firm size”, Journal of Business Finance and Accounting, Vol. 22, nº 1, pp. 5-18.
Clubb, Collin (1995), “An empirical study of the information content of accounting earnings, funds flows and cash flows in the UK”, Journal of Business Finance and Accounting, Vol. 22, pp. 35-52.
Fabrizio, Stefano (2002), “Os relatórios de research realizados por analistas financeiros e os fenómenos de abuso de mercado”, Cadernos do Mercado de Valores Mobiliários.
Ferreira, Eric; Nossa, Valcemiro; Teixeira, Arilda and Lopes, Alexsandro (2008), “Comparação entre os modelos residual income valuation, abnormal arnings growth e fluxo de caixa livre: um estudo empírico no mercado de capitais brasileiro”, Brazilian Business Review, Vol. 5, nº 2, pp. 152-172.
Frankel, R. and Lee, C. M. (1998), “Accounting valuation, market expectation and cross-sectional stock returns”, Journal of Accounting and Economics, Vol. 25, pp 283-319.
Frankel, R. and Lee, C. M. (1999), “Accounting diversity and international valuation”, Johnson Graduate School of Management, Cornell University, Working Paper.
Davis-Friday, Paquita; Frecka, Thomas and Rivera, Juan (2005), “The financial performance, capital constraints and information environment of cross listes firms: evidence from México”, The International Journal of Accounting, Vol. 40, pp. 1-30.
Fuller, Russell and Hsia, Chi-Cheng (1984), “A simplified common stock valuation model”, Financial Analysts Journal, Vol. 40, nº 5, September-October, pp. 49-56.
Gordon, M. J. and Shapiro (1956), “Capital equipment analysis: the required rate of profit”, Management Science, 3, October, pp. 102-110.
Graham, Roger and King, Raymond (2000), “Accounting practices and the market valuation of accounting numbers: evidence from Indonesia, Korea, Malaysia, Philipines, Taiwan and Thailand”, The International Journal of Accounting, Vol. 35, pp. 445-470.
Green, J. Peter; Stark, Andrew and Thomas, Hardy (1996), “UK evidence on the market valuation of research and development expenditures”, Journal of Business Finance and Accounting, Vol. 23, nº. 2, pp. 191-216.
Hand, J. and Landsman, W. (1998), “Testing the Ohlson model: v or not v, that is the question”, Working Paper, University of North Carolina at Chapel Hill.
Jensen, M. (1986), “Agency Costs of Free Cash Flow, Corporate Finance and Takeovers”, American Economic Review, pp. 323-329.
Johnson, Bruce and Schwartz, William (2005), “Are investors misled by “pro forma” earnings?”, Contemporary Accounting Research, Vol. 22, nº 4, pp. 915-976.
Jorgensen, Bjorn and Kirschenheiter, Michael (2003), “Discretionary risk disclosures” The Accounting Review, Vol. 78, April, pp. 449-469.
King, Raymond and Langli, John (1998), “Accounting diversity and firm valuation”, The International Journal of Accounting, Vol. 33, May, pp. 529-567.
Malacrida, Mara and Yamamoto, Marina (2006), “Governança corporativa: nível de evidenciação das informações e sua relação com a volatilidade das acções do IBOVESPA”, Revista Contabilidade e Finanças, Edição Comemorativa, September, pp. 65-79.
Malkiel, B. G. (1963), “Equity Yields, Growth and Structure of Share Prices”, American Economic Review, December, pp. 467-494.
McCrae, Michael and Nilsson, Henrik (2001), “The explanatory and predictive power of different specifications of the Ohlson (1995) valuation models”, European Accounting Review, Vol. 10, nº 2, pp. 315-341.
Mendes, Cláudia and Rodrigues, Lúcia (2007), “Determinantes da Manipulação Contabilística”, Revista de Estudos Politécnicos, Vol. IV, Nº 7, pp. 189-210.
Meyers, S. (1974), “Interactions of Corporate Financing and Investment Decisions: Implications for Capital Budgeting”, Journal of Finance, 29, March, pp. 1-25.
Neves, João (2002), “Avaliação de Empresas e Negócios”, McGraw-Hill.
Ohlson, James (2005), “On Accounting-Based Valuation Formulae”, Review of Accounting, Vol. 10, pp 323-347.
Opong, Kwaku (1995), “The information content of interim financial reports: UK evidence”, Journal of Business Finance and Accounting, Vol. 22, nº 2, pp. 269-279.
Pirie, Scott and Smith, Malcolm (2003), “Accounting earnings, book values and share prices in Malaysia”, Asian Review of Accounting, Vol. 11, nº 2, pp 31-52.
Ransom, Charles (1985), “The ex ante information content of accounting information systems”, Journal of Accounting Research, Vol. 23, pp. 124-139.
Rappaport, A. (1998), Creating Shareholder Value: A Guide for Managers and Investors, 2ª Ed. New York: The Free Press.
Rappaport, Alfred (1986). Creating shareholder value: The new standard for business performance. New York: Free Press.
Rees, W. P. (1997), “The impact of dividends, debt and investment on valuation models”, Journal of Business Finance and Accounting, Vol. 24, nº 2, pp. 1111-1140.
Ross, S.; Wsterfield, R. and Jaffe, J. (2002), “Administração Financeira Corporate Finance”, São Paulo Atlas, 1ª Edição.
Schadewitz, H. J.; Kanto, A. J.; Kahra, H. and Blevins, D.R. (2002), “An analysis of the impact of varying levels of interim disclosure on finnish share prices within five days of the announcement”, American Business Review, Vol. 20, nº 2, pp. 33-45
Schleicher, Thomas and Walker, Marlin (1999), “Share price anticipation of earnings and management’s discussion of operations and financing”, Accounting & Business Research, Vol. 29, nº 4, pp. 321-335.
Soonawalla, Kazbi (2006), “Accounting for joint ventures and associates in Canada, UK and US: Do US rules hide information”, Journal of Business Finance & Accounting, Vol. 33, nº 3-4, pp. 395-417.
Stewart III, G. (1991), “The Quest for Value”, New York: Harper Business.
Tonge, Alyson; Greer, Lesley and Lawton, Alan (2003), “The Enron story: you can fool some of the people some of the time...”, Business Ethics: A European Review, Vol. 12, nº 1, pp. 4-22.
Viana, L. (2005), “Estrutura do Órgão de Administração e Reparos de Auditoria: O caso das empresas cotadas portuguesas”, Dissertação de Mestrado em Ciências Empresariais – área de especialização em contabilidade. Faculdade de Economia, Universidade do Porto.
OS FLUXOS DE CAIXA POR ACTIVIDADES E AS FASES DO CICLO DE VIDA DA
EMPRESA: UMA PERSPECTIVA RELEVANTE
Autores
Maria Teresa Venâncio Dores Alves, [email protected] Sandra Cristina Dias Nunes, [email protected] Carlos Manuel Severino da Mata, [email protected]
Instituto Politécnico de Setúbal / Escola Superior de Ciências Empresariais
EVENTO: XX Jornadas Luso-Espanholas de Gestão Cientifica DATA DO EVENTO: 4 a 5 de Fevereiro de 2010
ÁREA TEMÁTICA: CONTABILIDADE E FINANÇAS
PALAVRAS-CHAVE: fluxos de caixa, ciclo de vida, IAS7, PSI20 KEY-WORDS: cash flow, life cycle, IAS7, PSI20
RESUMO
Reconhecendo o papel relevante que a informação contida na demonstração dos fluxos de caixa pode ter para a tomada de decisão por parte dos utilizadores da informação financeira e o reflexo que a fase do ciclo de vida em que a empresa se encontra pode ter sobre essa informação, desenvolvemos um estudo baseado no trabalho apresentado por Sánchez Alegria et al. (2008).
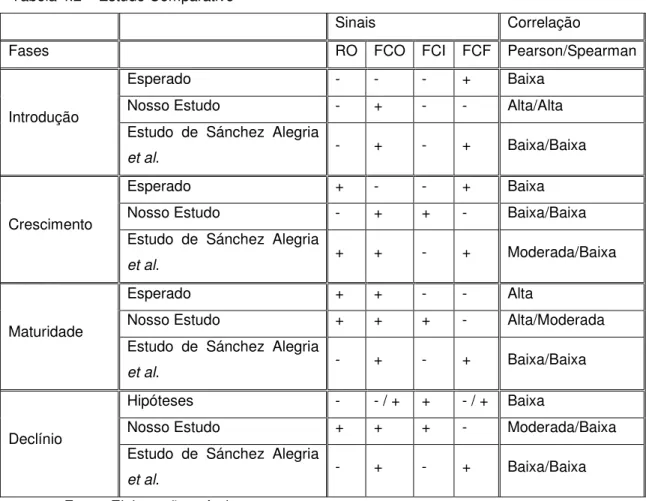
Procurámos padrões de comportamento dos fluxos de caixa das diferentes actividades face às etapas tradicionais do referido ciclo de vida e uma eventual relação entre os indicadores operacionais, através dos coeficientes de correlação de Pearson e Spearman.
Os resultados obtidos foram, no que concerne ao comportamento dos sinais e relativamente às fases de maturidade e de declínio, consistentes com a maior parte das hipóteses. Quanto aos coeficientes de correlação, apenas, quando se trata da fase de introdução, não se verifica a hipótese.
ABSTRACT
We acknowledge the important role that the information included in the cash flow statement plays regarding decision-making by the users of the financial information and the effect that the life cycle stage in which the company can be found may have on this information; we developed a study based on the work of Sánchez Alegria et al. (2008).
We looked for descriptive patterns in the cash flow statement of the different activities towards the traditional life cycle stages and for a possible link between the operating income and cash flows from operating activities through the correlation coefficients of Pearson and Spearman. For the stages of maturity and decline most of the assumptions were verified concerning the signals behaviour and, for the correlation coefficients, only the assumption regarding the operating stage is not verified.
1. INTRODUÇÃO
De acordo com a IAS 1 “Apresentação de Demonstrações financeiras” do IASB, a demonstração dos fluxos de caixa integra o “conjunto completo das demonstrações financeiras”, sendo portanto de divulgação obrigatória para as empresas que aplicam as IAS/IFRS. Trata-se de uma demonstração financeira que tem vindo a ganhar importância pelo relevo da informação que divulga e que é condicionada, entre outros factores, pelo ciclo de vida da empresa.
factores macro-económicos). Os ciclos de vida da empresa são fases/etapas distintas que resultam de alterações desses factores, os quais derivam das actividades estratégicas definidas pela empresa. Daí que a informação sobre a etapa do ciclo de vida de uma empresa melhore a análise e avaliação das demonstrações financeiras e os fluxos de caixa proporcionem um indicador robusto da etapa do ciclo de vida da empresa (Dickinson, 2008). Neste sentido, diversos estudos (entre outros, Sánchez Alegria et al., 2008; Dickinson, 2008) têm procurado padrões no comportamento descritivo dos diferentes componentes da demonstração dos fluxos de caixa segundo a fase do referido ciclo em que a empresa se encontra. Esses padrões, a existirem, deverão ser considerados na interpretação da informação que a referida demonstração proporciona. Este estudo replica a investigação desenvolvida por Sánchez Alegria et al. (2008), no sentido em que coloca hipóteses sobre o comportamento descritivo e a inter-relação entre o resultado e os três componentes da demonstração dos fluxos de caixa (fluxos de caixa das actividades operacionais, fluxos de caixa das actividades de investimento e fluxos de caixa das actividades de financiamento) em cada uma das etapas clássicas do ciclo de vida de uma empresa: introdução, crescimento, maturidade e declínio. No entanto, enquanto a amostra usada por Sánchez Alegria et al. (2008) incluía 201 empresas de diferentes dimensões e sectores de actividade ao longo dos anos de 1990 a 1998, a amostra usada no presente estudo inclui as empresas que integravam o PSI20 em Dezembro de 2009, excepto as financeiras. Além de que, diferentemente destes autores, não fizemos quaisquer ajustamentos para chegar aos montantes dos fluxos de caixa (foram retirados, directamente, das demonstrações dos fluxos de caixa). Tal como Sánchez Alegria et al. (2008:212), reconhecemos que, apesar de a realidade multi-produto de muitas das empresas introduzir um certo enviezamento, a análise é levada a cabo num enfoque conjunto (ao nível da empresa) e que o conjunto de produtos de uma mesma empresa poderá situar-se, num ponto de vista individual, em fases distintas do ciclo de vida.
Os resultados obtidos são mistos, pois em determinados casos as hipóteses são verificadas e noutros não o são. No primeiro caso estão, por exemplo, as hipóteses quanto ao comportamento dos sinais na fase de maturidade (excepto para os fluxos de caixa de investimento) e na de declínio (excepto para o resultado operacional) e, ainda, as correlações entre os indicadores operacionais quando se trata das fases de maturidade e de declínio. Sánchez Alegria et al. (2008) defendem, face aos resultados que obtiveram, que o cumprimento dos padrões estabelecidos nas hipóteses só se verificam com clareza quando é colocada a delimitação de sub-níveis dentro de cada fase e à medida que estes se tornam mais exigentes.
O trabalho está estruturado da seguinte forma: após a introdução, no ponto 2, apresentamos o enquadramento teórico do tema, destacando aspectos caracterizadores da demonstração dos fluxos de caixa e da informação por ela divulgada e relacionando as etapas do ciclo de vida da empresa e os fluxos de caixa das diferentes actividades; no ponto 3, o destaque recai sobre o estudo empírico realizado, sendo salientadas as hipóteses, a metodologia adoptada e os resultados alcançados; por fim, são retiradas algumas conclusões.
2. ENQUADRAMENTO
2.1. A DEMONSTRAÇÃO DOS FLUXOS DE CAIXA
O pressuposto do acréscimo, reconhecido pelo normativo contabilístico como pressuposto fundamental, adoptado na elaboração da generalidade das demonstrações financeiras, é derrogado quando se adopta o pressuposto de caixa. Mas, como defende Oriol Amat et al. (1996), a contabilidade de caixa é mais objectiva, pois evita muitos dos problemas gerados pela possibilidade de selecção entre várias alternativas que persistem na contabilidade baseada no pressuposto do acréscimo.
De acordo com Higson (2002:20), desde os anos 70 que tem sido dada maior consideração à incorporação dos fluxos de caixa nas demonstrações financeiras (eg. AAA, 1971; FASB, 1990, 2000). Como estipula a IAS 1 do IASB, esta demonstração financeira integra o “conjunto completo” das demonstrações financeiras que as entidades têm de apresentar nos seus relatórios e contas.
A IAS 7, “Demonstração dos fluxos de Caixa” veio, desde 1994, “exigir o fornecimento de informação acerca das alterações históricas de caixa e seus equivalentes de uma entidade por meio de uma demonstração dos fluxos de caixa que classifique os fluxos de caixa durante o período proveniente das actividades operacionais, de investimento e de financiamento”. A IAS 7 reconhece, no parágrafo 4, que esta demonstração financeira, em conjunto com as outras, “proporciona informação que facilita aos utentes avaliar as alterações no activo líquido de uma entidade, na sua estrutura financeira (incluindo a sua liquidez e solvência) e na sua capacidade de afectar as quantias e tempestividade dos fluxos de caixa a fim de se adaptar às circunstâncias e oportunidades em mudança” . Reconhece, também, que a demonstração dos fluxos de caixa é útil (parágrafos 4 e 5):
- Para determinar a “capacidade da entidade de gerar dinheiro e seus equivalentes”;
- Porque “facilita aos utentes desenvolver modelos para determinar e comparar o valor presente dos fluxos de caixa futuros de diferentes entidades”;
- Pois “aumenta a comparabilidade do relato do desempenho operacional por diferentes entidades” (devido ao uso do pressuposto de caixa);
- Porque a informação do fluxo de caixa histórico pode ser “usada como um indicador da quantia, da tempestividade e da certeza de fluxos de caixa futuros. É também usada na verificação do rigor de avaliações passadas de fluxos de caixa futuros e no exame do relacionamento entre lucratividade e fluxo de caixa líquido e no impacto de variações de preços”.
A Demonstração dos Fluxos de Caixa apresenta, assim, os fluxos de caixa separados por actividades, evidenciando aqueles que resultam das actividades operacionais, das actividades de investimento e das actividades de financiamento1. Esta classificação por tipos de actividades proporciona informação que, segundo Mackevieius e Senkus (2006) oferece aos utilizadores a possibilidade de avaliar a influência de cada actividade sobre a posição financeira da empresa e o montante de dinheiro e equivalentes bem como para avaliar as relações entre os referidos tipos de actividades.
2.2. RELATO DA INFORMAÇÃO SOBRE OS FLUXOS DE CAIXA
O relato da informação sobre os fluxos de caixa é relevante para a generalidade dos utilizadores da informação financeira, com destaque para os accionistas, os investidores, os credores e os gestores. Mackevieius e Senkus (2006) consideram que os accionistas necessitam desta informação para a avaliação das possibilidades de desenvolvimento da empresa; da sua condição de solvência; e da capacidade da empresa cobrir os seus passivos. Os investidores e credores necessitam de saber se os influxos de caixa irão superar os exfluxos, se a empresa procederá ao pagamento dos dividendos, à devolução do capital e ao pagamento dos juros e, em geral, se os seus gestores serão capazes de gerir os fluxos de caixa eficientemente. Igualmente, para a gestão de topo da empresa, a informação sobre os fluxos de caixa é especialmente valiosa, para a tomada de decisões de gestão e para a previsão da evolução da actividade. A gestão adequada dos fluxos de caixa ajuda a revelar atempadamente os problemas de várias esferas da actividade da empresa para permitir a melhoria da sua eficácia.
Os fluxos de caixa das actividades operacionais (FCO) podem ser apresentados de acordo com o método directo ou de acordo com o método indirecto. Sendo que, como referido no parágrafo 18 da IAS 7, o método directo será aquele em que “são divulgadas as principais classes dos recebimentos de caixa brutos e dos pagamentos de caixa brutos” e o método indirecto, aquele em que “os lucros ou prejuízos são ajustados pelos efeitos de transacções
de natureza não pecuniária, de quaisquer diferimentos ou acréscimos de recebimentos a pagamentos de caixa operacionais passados ou futuros, e itens de rédito ou gasto associados com fluxos de caixa de investimento ou de financiamento.”
Krishnan e Largay III (2000:218-219) apresentam a seguinte síntese das vantagens de cada um destes métodos:
- Vantagens do método directo:
1) Capacidade de comparar tipos de recebimentos e pagamentos em dinheiro entre empresas, pelo menos, anualmente (Richarddson, 1991);
2) Melhor representação do ciclo de dinheiro de uma entidade para os fornecedores de crédito e formato mais amigo do utilizador para os gestores que não possuam conhecimento contabilístico substancial (O’Leary, 1988);
3) Utilidade na análise da variância dos fluxos de caixa pois o orçamento pode ser ligado ao relatório dos fluxos de caixa chamando, assim, a atenção para a fonte real de quaisquer problemas (Trout et al., 1993); e
4) Maior facilidade na análise da sensibilidade dos fluxos de caixa às alterações de volume pois os recebimentos e pagamentos brutos em dinheiro podem responder diferentemente a variações na actividade (Cornell e Apostolou, 1992).
- Vantagens do método indirecto:
1) Realce das diferenças entre resultado líquido e fluxos de caixa líquidos resultantes das actividades operacionais;
2) Realce das variações operacionais nas contas não monetárias do fundo de maneio; 3) Percepcionado como menos dispendioso de implementar.
Oriol Amat et al. (1996), defende que este último método permite relacionar a demonstração dos fluxos de caixa com a demonstração dos resultados e o balanço; é mais conhecido pelos analistas e é mais fácil de elaborar porque os números provêem de uma análise simples do balanço. Defende, ainda que, no caso de se considerar que a exigência dos dois métodos é de difícil implementação, a opção deverá recair sobre o método directo pelo seu maior potencial para análise da empresa e pela sua simplicidade de interpretação. Também, Lauver e Swieringa (citados por Krishnan e Largay III, 2000:215) defendem o uso do método directo pois consideram que este é mais consistente com o objectivo de uma demonstração dos fluxos de caixa, pois ao contrário do método indirecto, proporciona informação sobre recebimentos e pagamentos em dinheiro relativos à actividade operacional.
Krishnan e Largay III (2000) estudaram a utilidade do método directo na informação sobre fluxos de caixa, especialmente, a maior utilidade deste método, face ao método indirecto, na