Morphometry of ovarian structures by
transrectal ultrasonography
in Serrana goats
J. Simões
a,∗, J. Potes
b, J. Azevedo
a, J.C. Almeida
a, P. Fontes
a,
G. Baril
c, R. Mascarenhas
daUniversity of Trás-os-Montes e Alto Douro, Apartado 1013, 5000-911 Vila Real, Portugal bUniversity of Évora, 7000-803 Évora, Portugal
cINRA, Physiologie de la Reproduction et des Comportements, 37380 Nouzilly, France dINIAP, Estação Zootécnica Nacional, 2000-763 Vale de Santarém, Portugal Received 22 July 2003; received in revised form 29 March 2004; accepted 15 April 2004
Abstract
The accuracy of transrectal real-time ultrasonography (RTU) scanning technique to detect ovarian structures (follicles and corpus luteum) of Serrana goats was compared to the data obtained by observation of ovarian sequential slices. This slicing technique (SLI) was considered as reference method. The laparoscopy and laparotomy techniques were also used for corpora lutea identification. For this purpose the ovaries of 14 females were observed, 7–8 days after ovulation, by transrectal ultrasonography followed by laparoscopic examination. Then ovaries were removed and studied by slicing. In the sliced sections of each ovary (n= 28), follicles and corpus luteum (CL) were identified and counted. CL and follicular diameters were measured using a millimetre scale.
The total number of follicles, counted by RTU, was significantly lower than that observed by SLI (P< 0.01). This difference was mainly due to the under estimation of <2 mm follicles category. The correlation coefficient between category data obtained by RTU and SLI methods for the number of follicles≥3 mm was high (r2= 0.95, P < 0.001), which highlights the use of UTR as a potential methodology to study the follicular dynamic of goats.
There were no significant differences (P > 0.05) between the average number (mean± S.D.) of corpus luteum identified per ovary by RTU (0.71± 0.75), laparoscopy (0.58 ± 0.71), laparotomy (0.67± 0.76) or SLI (0.83 ± 0.76) methods. The accuracy for the identification of ovulation, validated by CL detection on D7–D8 by SLI (100%), was 91.7%, 87.5% and 83.3% by RTU, laparotomy and laparoscopy, respectively. The negative predictive value of RTU, laparotomy and
∗Corresponding author.
E-mail address: [email protected] (J. Simões).
0378-4320/$ – see front matter © 2004 Elsevier B.V. All rights reserved. doi:10.1016/j.anireprosci.2004.04.045
laparoscopy to verify the absence of a CL in the ovary was 81.8%, 75.0% and 69.2%, respectively. The specificity of all three methods for the CL identification was 100%. No significant differences (P > 0.05) were found in the probability to detect the exact number of CL (0, 1 or 2) counted in each ovary between the RTU (87.5%), laparotomy (83.3%) and laparoscopy (75.0%) methods when compared with the reference method.
The diameter of spherical CL could be estimated with reliability (r2= 0.86; P < 0.001). The real-time ultrasonographic scanning proved to be a highly accurate method for detection and mea-surement of several categories of follicles and CL size in Serrana goats. The results of the present study show that laparoscopy and RTU are similarly reliable techniques for CL detection. How-ever, the RTU represents a non-traumatic technique with advantages to animal welfare both in experimental and reproductive evaluation of the size of ovarian structures.
© 2004 Elsevier B.V. All rights reserved.
Keywords: Follicles; Corpus luteum; Ovulation; Real-time ultrasonography; Goats
1. Introduction
Real-time ultrasonographic scanning permits the study of ovarian structures in small ru-minants and, as a result, the monitoring of their evolution by successive observations. As a non-invasive method, it presents great advantages when compared with laparoscopy or la-parotomy. This technique is less stressful, administration of anaesthetics and sedative agents are not necessary and successive observations can be performed without causing adverse effects (e.g.: internal adherences and infections) and the complete scanning of ovarian struc-tures is possible. However, high levels of training are necessary for the ultrasonographic technique to be compatible with good livestock practice and animal welfare. On the other hand, a routine identification of ovaries and their structures could be difficult or not possible in some stages of sheep and goat oestrous cycle (Buckrell, 1988).
Several studies have been done in superovulated goats to determine the accuracy of ul-trasonography for detection of ovulation rate (Riesenberg et al., 1998), the presence of follicles (Dorn et al., 1989) or preovulatory follicles (Menchaca et al., 2001) and time of ovulation (Suyadi and Holtz, 1998). Recently, the validation of RTU technique to eval-uate the number of large follicles (Baril et al., 1999), the ovulation time (Baril et al., 2000) and the number of corpora lutea related to the phase of the oestrous cycle (Bouttier et al., 2000) in goats was reported. In the greater part of these studies, the accuracy of transrectal RTU was evaluated by comparison with only a referential method, such as laparoscopy (Baril et al., 2000andBouttier et al., 2000), laparotomy (Menchaca et al., 2001) or ovarian dissection (Dorn et al., 1989 and Baril et al., 1999). To our knowl-edge, the evaluation of the number of corpus luteum counted by RTU, laparoscopy or laparotomy methods and their relationship with slicing method has not yet been performed.
The purpose of this experiment was to evaluate the accuracy of transrectal ultrasound scanning to estimate the number and size of follicles and corpus luteum (CL) and to compare this method with laparoscopy and laparotomy on day 7 or 8 after ovulation. The slicing technique was used as a reference method.
2. Materials and methods
2.1. Animals
The Serrana goat is a local Portuguese breed found in the mountain regions of the North and Centre. These animals are of medium size and are predominantly kept for milk produc-tion. Indication of a seasonal anoestrus stage between January and May has been identified in this breed (Mascarenhas et al., 1995).
Fourteen Serrana goats in the breeding season, aged between 2 and 9 years and weighing between 27 and 48 kg, were used for this experiment. The breeding activity and oestrous cycle phase of these animals had previously been identified by biweekly determination of plasmatic progesterone levels by radioimmunoassay. Twelve of those animals were in-tramuscularly injected, during their luteal phase, with a single dose of 50 micrograms of cloprostenol (Estrumate®, Schering-Plough II), for oestrus synchronization. Two animals remained in anoestrus during the experimental period that was validated with continuous low profiles of progesterone.
Oestrus detection was performed twice a day using two vasectomized bucks with marker harnesses, which were alternatively introduced into the group of females. The mount signals
and marks were performed every 12 h between 36 and 90 h after the prostaglandin F2␣
administration.
2.2. Counting and measurement of the ovarian structures
The number and size of follicles greater than 1.0 mm diameter, estimated by RTU, were compared to results obtained with SLI method, in all the fourteen goats. The follicles were measured and grouped into one of six categories, according to diameter:<2 mm; 2–2.9 mm;
3–4.9 mm; 5–7.9 mm;≥8 mm and ≥2 mm (all the follicles greater or equal than 2 mm).
The number of corpus luteum per ovary was counted by RTU, laparoscopy, laparotomy and SLI methods in the twelve cyclic goats. The conformation and size of corpus luteum were both evaluated by RTU and SLI. For all comparisons, the SLI method was considered as the reference method.
2.3. Ultrasonographic scanning and storage of sonograms
The ovulation day (D0) was identified by daily UTR scanning of the ovaries, starting at the beginning of identified heat and for three subsequent days. Ovulation was considered to occur when at least one follicle, greater than 5 mm diameter and observed in the previous scanning, had disappeared. This threshold was determined by our previous experiment and in accordance with other studies (Riesenberg et al., 1998). All the ovulations were confirmed on day 7 or 8 of the oestrous cycle (D7–D8), by the detection of, at least, one corpora lutea in the removed ovaries of each goat.
In the twelve cyclic goats we achieved an ultrasonographic scanning of the ovaries im-mediately before the ovariectomy (D7–D8) in order to quantify the number and size of follicles and corpus luteum. For the other two anoestrus goats only the number and size of follicles were quantified.
The ultrasonographic images were obtained with a real-time ultrasound scanner (Aloka, 500 SSD, Japan), connected with a transrectal 7.5 MHz linear probe (UST-660-7.5 model with a 38 mm transducer) for human prostatic examination.
During RTU examinations, the goats were placed in standing position and the probe, protected by a plastic glove and lubricated with liquid vaseline, was introduced into the rectum with the transducer turned over. Then it was rotated 180◦in complete contact with the rectal mucosal.
To find the genitourinary structures we put the probe with the transducer turned down so that the bladder and the uterine horns could be observed in longitudinal section. Then, the transducer was rotated 45–90◦clockwise and counter clockwise to locate, respectively,
the left and right ovary as explained byGinther and Kot (1994). The technique used by
us allows a quicker ultrasonographic examination because, usually, it is not necessary to remove the faecal material and only a small amount of acoustic gel is used. Thus, a larger number of ultrasonographic exams per hour can be performed.
After visualization of both ovaries, a complete scanning of each one was performed. The images of the left and right ovaries were recorded in B/B mode of the UTR equipment at the left and right sonograms, respectively. This technique reduces the errors in the identification of the ovaries when it is used on a large scale.
The ultrasonographic images were recorded in digital video (Sony camcorder,
DCR-TRV25E) with a velocity of 25 frames per second (1 frame= 720 × 576 pixels) for later
analysis.
2.4. Analysis of ultrasonographic images
The video-recorded ultrasonographic images were transferred to a computer hard disk
(using the IEEE 1394 norm) in order to select the sonograms, using Adobe®Premiere®
6.0 software, which helped later identification and analysis of the ovarian structures greater than 1 mm.
Follicles less than 2 mm diameter were counted by comparison with the side scale of
the sonogram. Follicles greater than≥2 mm diameter, as well as the corpus luteum size,
were measured on the frames selected from the total recorded scanning images, using the
UTHSCSA Image Tool 3.00 software. In the horizontal axis, and up to 45◦for each side,
10.0 mm= 71 pixels equivalence was calculated. In the vertical axis, the equivalence was
10.0 mm = 66 pixels. This calibration was made by counting the number of pixels
be-tween two bars that represent 10 mm of horizontal and vertical sonogram axis scale, respec-tively.
2.5. Laparoscopy and ovariectomy
Laparoscopy was performed under general anaesthesia. After premedication with ace-promazine, anaesthesia was induced with thiopental sodium and maintained with halothane through endotraqueal intubation. Laparoscopy was performed using a laparoscope Fujinon, model UGI-FP7, with a Sony camera adaptor (CMA-D7CE). An expert operator, with no knowledge of previous RTU examination results, identified and counted the corpus luteum of each ovary.
Afterwards, each ovary was exposed through the enlarged incision made to introduce one of the trocarts. A new count of corpus luteum was achieved and, finally, ovariectomy was performed, after ligature of the oviduct and blood vessels. Incisions were closed using absorbable sutures (polyglicolic acid, USP-0) in muscle layers and silk sutures (USP-1) in the skin.
2.6. Ovarian slicing and follicles and corpus luteum identification and measurement Each removed ovary was placed in an individual container and fixed with 10% neutral buffered formalin solution, for a minimum of 48 h, in order to increase tissue consistency and to avoid follicle collapse during the slicing process. Then, the ovaries were cut into slices 1.6–1.9 mm thick. Ovarian structures over 1 mm diameter were identified though observation in a retro illuminated microscope with 2× amplification.
Follicles and round corpus luteum were macroscopically identified and the largest di-ameter measured with a millimetre scale. In oval structures, the average of the largest and smallest diameter was calculated as described byPierson and Ginther (1987). For calcu-lations, only the largest diameter of each structure was kept. Follicles were grouped in categories of size as previously described. Corpus luteum were classified according to their oval or round conformation. Corpus luteum with spherical cavities were measured in the same way as the follicles.
2.7. Statistical analyses
Means values were compared by ANOVA and Bonferroni/Dunn test. The correlations analysis between the number of follicles obtained by RTU, laparoscopy, laparotomy and SLI methods were performed by categories of size and per ovary. Both statistical methods
were performed using Statview®4.53 software (Abacus Concepts Inc.,SAS, 1999). The
accuracy of corpus luteum identification, presence or absence of ovulation per ovary and number of ovulations per ovary was done using the Chi-square test.
3. Results
All the twelve cyclic goats came into oestrus and were marked by the buck during the expected period. Both the ovaries were visualized by RTU in all the fourteen goats. With one of the cyclic goats, it was not possible to detect the time of ovulation by the disappearance of the largest follicle. However, all the ovulations were confirmed by CL detection on D7–D8 by the reference method.
3.1. Follicles
Preovulatory follicles size (mean± S.D.) detected by RTU was 6.3 ± 1.0 mm (n = 11).
In these goats, the ovulation was confirmed later by the presence of at least one corpora lutea in the removed ovaries.
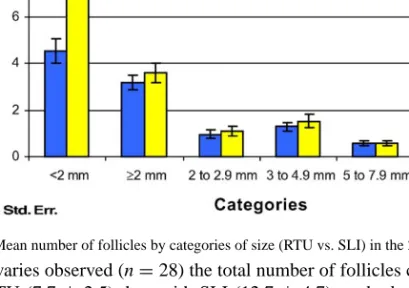
Fig. 1. Mean number of follicles by categories of size (RTU vs. SLI) in the 28 studied ovaries.
In all the ovaries observed (n= 28) the total number of follicles counted per ovary was
lower with RTU (7.7± 2.5) than with SLI (12.7 ± 4.7) methods (P < 0.01). However,
when we classified follicles size by category (Fig. 1), only a significant difference in<2 mm category persisted between those methods (4.5± 2.6 for RTU versus 9.1 ± 5.2 for SLI; P< 0.001). No significant differences were found between all the other size categories (P > 0.05).
For all categories of follicles size, the correlation coefficients between the number of identified follicles detected by the two methods were positive (Table 1) and statistically significant (P< 0.001).
An accurate estimate of follicles number (Y= 0.48 + 0.70X; r2= 0.95; R.S.D. = 0.33; P< 0.001) in the classes greater or equal than 3 mm (size categories of 3–4.9 mm; 5–7.9
mm and≥8 mm) was obtained by RTU.
3.2. Corpus luteum
A total of 20 corpus luteum were observed in 15 ovaries by SLI. When observed by RTU, all CL showed a well defined contour, with round or oval conformation. The inner luteal
Table 1
Correlation coefficients of follicles number between RTU and SLI by category size of follicles in the 28 ovaries
Category of size Correlation
<2 mm 0.83 ≥2 mm 0.93 2–2.9 mm 0.69 3–4.9 mm 0.95 5–7.9 mm 1.00 ≥8 mm 0.97 Total 0.90
Fig. 2. Images of the same corpora lutea with central cavity viewed by ultrasonography (A), slicing (B), laparoscopy (C) and laparotomy (D). (A) Sonogram of a corpora lutea with fluid-filled cavity. Note the granular luteinic tissue (arrow) and the 6 and 12 o’clock artefact in the vertical axis of the central cavity. The length between the two top bars corresponds to 10 mm. (B) Slice of the same CL with the luteinic tissue and cavity (arrow). The scale is a millimetre paper. (C) Laparoscopic image of the ovary and CL (arrow) in the pelvic cavity. Small follicles were visible at the bottom of the CL. (D) Aspect of the ovary and CL (arrow) during the ovariectomy procedure.
tissue has a homogeneous granulate echotexture. In some of those corpus luteum, a round or oval anechoic central cavity was observed (Fig. 2A and B). Sixty-five percent of those CL cavities (13/20) were fluid-filled, as confirmed by SLI. Using RTU, it was possible to detect 92.3% (12/13) of those cavities.
No significant differences (P > 0.05) were observed between the average number of corpus luteum per ovary, counted by SLI or by other described methods. The mean number
of CL per ovary was 0.71± 0.75, 0.58 ± 0.71, 0.67 ± 0.76 and 0.83 ± 0.76 for RTU,
laparoscopy, laparotomy and SLI, respectively.
On D7–D8 of oestrous cycle, and comparing to the reference technique, we could identify in 91.7% (22/24), 87.5% (21/24) and 83.3% (20/24) of the ovaries, the presence or absence of corpus luteum by RTU, laparotomy and laparoscopy, respectively, with no statistical differences between these three methods (P > 0.05).
The three studied methods showed a specificity of 100% (Table 2) in the CL visualization in the goats ovaries. However, some false negative results were found that explains their small sensitivity.
Table 2
Sensitivity, specificity and predictive values of laparoscopy, laparotomy and RTU for detecting the presence or absence of corpus luteum identified by SLI method
Laparoscopy Laparotomy RTU Observations
CL counted (a) 11 12 13 15 CL found (slicing method)
CL not identified (b) 4 3 2
Ovaries with CL (c) 0 0 0 9 ovaries without CL
(slicing method)
Ovaries without CL (d) 9 9 9
Sensitivity (%) 73.3 80.0 86.7 a/(a+ b) × 100
Specificity (%) 100 100 100 d/(d+ c) × 100
Positive preditive value (%) 100 100 100 a/(a+ c) × 100 Negative preditive value (%) 69.2 75.0 81.8 d/(d+ b) × 100
The probability to detect the exact number of CL (zero, one or two) counted in each ovary by the different methods gave results in agreement (P > 0.05) with the data of the reference method (SLI). The results obtained by RTU, laparotomy and laparoscopy corresponding to 87.5% (21/24), 83.3% (20/24) and 75.0% (18/24), respectively, to the results obtained by SLI. This agreement with SLI also does not differ (P > 0.05) when there are two CL per
ovary (80%, 80% and 60%, respectively, n= 5) or one CL per ovary (90%, 80% and 80%,
respectively, n= 10) or no CL per ovary (100% in all the three methods, n = 9).
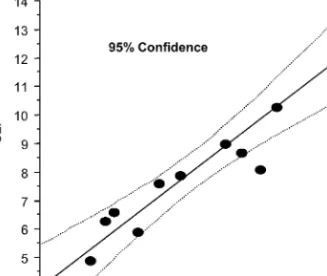
The mean diameter of spherical corpus luteum (n= 11) calculated by RTU (8.2 mm) or
SLI (8.0 mm) were very similar (P > 0.05) and they have a significant regression coefficient (r2= 0.86; P < 0.001) that allows a reliable diameter estimation of the spherical corpus luteum by RTU (Fig. 3).
4. Discussion
Our results show that the RTU method provides an efficient observation of ovarian struc-tures in goats. An under-evaluation of the total number of follicles greater than 1 mm per ovary was observed when RTU was compared to SLI method. These results were mainly due to the under-estimation by RTU of the number of follicles<2 mm all of which were not detected by this method, possibly because the acoustic resolution of the 7.5 MHz transducer limits our ability to discover those small follicles on the sonograms.
Differences in the number of observed follicles for the category≥2 mm were not
sig-nificant between RTU and SLI methods. In cows, an under-evaluation of the number of follicles, by RTU, between 3 and 5 mm has been observed (McDougall et al., 1995). How-ever, a tendency for an over-evaluation of the number of follicles≥2 mm in heifers has also been described byPierson and Ginther (1987)using that technique.
A high correlation coefficient between the number of follicles of 3–4.9 mm, 5–7.9 mm and≥8 mm categories visualized per ovary by RTU or SLI was found. The accurate count in the category 5–7.9 mm could be attributed to the larger size of the follicles associated with their low number per ovary. In spite of their low number per ovary, the less efficient
detection of follicles≥8 mm could have been due to the juxtaposition of some of those
follicles. These high correlations, as well as the good estimation of the number of follicles with≥3 mm diameter by RTU are necessary, because recent follicular dynamic studies in goats (Ginther and Kot, 1994,de Castro et al., 1999andMedan et al., 2003) and in ewes (Ginther et al., 1995,Bartlewski et al., 1999,Evans et al., 2000) are performed, basically, by the identification and growth of follicles with more than 3 mm diameter.
The ultrasonographic architecture of the observed corpus luteum was well-defined. Ul-trasonographic characteristics of CL are very similar in cows (Omran et al., 1988; Boyd, 1995), ewes (Bartlewski et al., 1999) and goats (de Castro et al., 1999andMedan et al., 2003) and are related to the development stage (Omran et al., 1988; Boyd, 1995; Veronesi et al., 2002). In dairy cows, the ultrasonographic appearance of luteinic tissue is a highly re-liable method for the assessment of mid-cycle corpus luteum (Veronesi et al., 2002). Similar studies in goats should be carried out.
The ovulation day can be validated by RTU through the visualization of, at least, one corpora lutea, just after the 3rd day both in ewes (Bartlewski et al., 1999) and goats (Medan et al., 2003). However, the incidence of a short life-span corpus luteum in these species (Camp et al., 1983,Bartlewski et al., 1999), leadDuggavathi et al. (2003)to test the possi-bility that validation should be done through the visualization of the corpus haemorrhagicum from 12–24 to 60–72 h after the ewe ovulation.
The 65% of corpus luteum with central fluid filled cavities found in this study with Serrana goats was higher than the 33% found in ewes (Gonzalez de Bulnes et al., 2000; Duggavathi et al., 2003). In cows,Kito et al. (1986)observed 37.2% andKastelic et al. (1990)79% of CL with fluid filled cavities in the 10th and 60th day of gestation, respectively.
The agreement of the number of corpus luteum identified by RTU, laparoscopy or laparo-tomy with a SLI as a reference technique was high with no statistical differences between the three methods.
The average number of corpus luteum per ovary identified by RTU, laparotomy and laparoscopy were no different than those observed by SLI. However, further research is
needed to confirm the values obtained by RTU technique. Some corpus luteum were not viewed by laparotomy or laparoscopy methods. This could be attributed to their more internal location in the ovaries, hindering visualization on the ovary surface.
The efficiency to detect the ovulation occurrence in D7 or D8 by RTU, laparotomy or laparoscopy was equally high, with no differences between techniques. These results are in
agreement with those observed byBouttier et al. (2000)between D9 and D16 (D0= day of
oestrus) of the oestrous cycle. These authors also report a better correspondence between RTU and laparoscopy when the observations were done later on the oestrous cycle.
When one or two ovulations per ovary occur, the accuracy of corpus luteum identification between the three methods was about 80% with no differences. The RTU specificity of 100% observed in the detection of, at least, one CL in the Serrana goats is similar to that reported byRibadu et al. (1994)in cows. These authors also describe some false negatives.
The number of corpus luteum identified per ovary by RTU, laparotomy or laparoscopy methods, when compared with SLI, was not significantly different.Baril et al. (2000)also found an accordance of 85.2% between RTU and laparoscopy on 10th day after oestrus. However, in this experiment, the number of corpus luteum identified by slicing method was better estimated with RTU than laparoscopy methods. In fact, the laparoscopy had the greatest divergence with the SLI method. We consider that operator experience has an important role in the accuracy of the RTU technique.
With the RTU technique, the 6 and 12 o’clock artefact visualization, originating from proximal and distal specular reflections (Fig. 2A), is useful in identifying the fluid filled cavities. The far-field enhancement also helps in the detection of some ovarian structures.
In conclusion, in Serrana goats, the scanning of ovaries by transrectal ultrasonography is a reliable technique that permits the identification and growth evolution of follicles categories greater than 3 mm. The identification and morphology of corpus luteum on D7 or D8 following the ovulation day was done with high accuracy and a specificity of 100%. Using RTU, it is possible to study the follicular and luteal dynamics in this breed and in the species. The data also suggest that the RTU is a good choice for detection of corpus luteum when compared to the laparoscopy and is an important and non invasive instrument to help in the understanding of reproductive physiology and infertility reasons, in the determination of optimal time to insemination and in the establishment and evaluation of oestrous control treatments.
Acknowledgements
This work was supported by the University of Trás-os-Montes e Alto Douro and by PRODEP III.
References
Baril, G., Touze, J.L., Pignon, R., Fontaine, J., Saumande, J., 1999. Utilisation de l’échographie pour suivre l’activité ovarienne chez la chèvre. Rev. Med. Vet.-Toulouse 150, 261–264.
Baril, G., Touze, J.L., Pignon, R., Saumande, J., 2000. Evaluation of the efficiency of transrectal ultrasound to study ovarian function in goats. Theriogenology 53, 370 (abstract).
Bartlewski, P.M., Beard, A.P., Rawlings, N.C., 1999. An ultrasonographic study of luteal function in breeds of sheep with different ovulation rates. Theriogenology 52, 115–130.
Bouttier, A., Pignon, R., Touze, J.L., Furstoss, V., Baril, G., 2000. Détermination du moment optimum au cours du cycle sexuel pour dénombrer les corps jaunes par écographie transrectale chez la chèvre. 7èmes Rencontres Recherches Ruminants, Paris.
Boyd, J.S., 1995. Real-time diagnostic ultrasound in bovine reproduction. In: Veterinary Ultrasonography. CAB International, Wallingford, UK, pp. 233–256.
Buckrell, B.C., 1988. Applications of ultrasonography in reproduction in sheep and goats. Theriogenology 29, 71–84.
Camp, J.C., Wildt, D.E., Howard, P.K., Stuart, L.D., Chakraborty, P.K., 1983. Ovarian activity during normal and abnormal length estrous cycles in the goat. Biol. Reprod. 28, 673–681.
de Castro, T., Rubianes, E., Menchaca, A., Rivero, A., 1999. Ovarian dynamics, serum estradiol and progesterone concentrations during the interovulatory interval in goats. Theriogenology 52, 399–411.
Dorn, C.G., Wolfe, B.A., Bessoudo, E., Kraemer, D.C., 1989. Follicular detection in goats by ultrasonography. Theriogenology 31, 185 (abstract).
Duggavathi, R., Bartlewski, P.M., Pierson, A.P., Rawlings, N.C., 2003. Luteogenesis in cyclic ewes: echotestural, histological and functional correlates. Biol. Reprod. 69, 634–639.
Evans, A.C., Duffy, P., Hynes, N., Boland, M.P., 2000. Waves of follicle development during the estrous cycle in sheep. Theriogenology 53, 699–715.
Ginther, O.J., Kot, K., 1994. Follicular dynamics during the ovulatory season in goats. Theriogenology 42, 987– 1001.
Ginther, O.J., Kot, K., Wiltbank, M.C., 1995. Associations between emergence of follicular waves and fluctuations in FSH concentrations during the estrous cycle in ewes. Theriogenology 43, 689–703.
Gonzalez de Bulnes, A., Santiago Moreno, J., Gomez-Brunet, A., Lopez-Sebastian, A., 2000. Relationship between ultrasonographic assessment of the corpus luteum and plasma progesterone concentration during the oestrous cycle in monovular ewes. Reprod. Domest. Anim. 35, 65–68.
Kastelic, J.P., Pierson, R.A., Ginther, O.J., 1990. Ultrasonic morphology of corporea luteal cavities during the estrus cycle and early pregnancy in heifers. Theriogenology 34, 487–498.
Kito, S., Okuda, K., Miyazawa, K., Sato, K., 1986. Study on the appearance of the cavity in the corpus luteum of cows by using ultrasonic scanning. Theriogenology 25, 325–333.
McDougall, S., Burke, C.R., MacMillan, K.L., 1995. Patterns of follicular development during periods of anovulation in pasture-fed dairy cows after calving. Res. Vet. Sci. 58, 212–216.
Mascarenhas, R., Simões Nunes, A., Robalo Silva, J., 1995. Cyclic reproductive activity and efficiency of reproduction in Serrana goats. Anim. Reprod. Sci. 38, 223–229.
Menchaca, A., Pinczack, A., Rubianes, E., 2001. Ultrasonography estimation of the ovulation rate and the length of the ovulation period in superovulated goats. Theriogenology 55, 531 (abstract).
Medan, M.S., Watanabe, G., Sasaki, K., Sharawy, S., P, N., Taya, K., 2003. Ovarian dynamics and their associations with peripheral concentrations of gonadotropins, ovarian steroids, and inhibin during the estrous cycle in goats. Biol. Reprod. 69, 57–63.
Omran, S.N., Ayliffe, T.R., Boyd, J.S., 1988. Preliminary observations of bovine ovarian structures using B-mode real time ultrasound. Vet. Rec. 122, 465–466.
Pierson, R.A., Ginther, O.J., 1987. Reliability of diagnostic ultrasonography for identification and measurement of follicles and detecting the corpus luteum in heifers. Theriogenology 28, 929–936.
Ribadu, A.Y., Ward, W.R., Dobson, H., 1994. Comparative evaluation of ovarian structures in cattle by palpation per rectum, ultrasonography and plasma progesterone concentration. Vet. Rec. 135, 452–457.
Riesenberg, S., Lewalski, H., Meinecke-Tillmann, S., Meinecke, B., 1998. Ultrasonic documentation of follicular dynamics following different superovulatory regimens in small ruminants-preliminary results. 11e Réunion A.E.T.E., Hannover 234 (abstract).
SAS, 1999. STATVIEW Reference. SAS Institute, Cary, NC.
Suyadi, J.F., Holtz, W., 1998. Effect of superovulation treatment on follicle development, time of ovulation and number of corpora lutea in goats. Reprod. Domest. Anim. 5 (Suppl.), 148 (abstract).
Veronesi, M.C., Gabai, G., Battocchio, M., Mollo, A., Soldano, F., Bono, G., Cairoli, F., 2002. Ultrasonographic appearance of tissue is a better indicator of CL function than CL diameter measurement in dairy cows. Theriogenology 58, 61–68.