Econometric Study of the Spanish Electricity Spot Market and
Primary Energy Markets using VAR/VECM methodology
(cointegration and nonstationary time series)
Ricardo Francisco Firmino Mendes Pacheco
Dissertation submitted in partial fulfilment of the requirements for the degree of Master in Finance
Supervisor:
Prof. Doutor Rui Manuel Pereira de Menezes
Co-Supervisor:
Prof. Doutor José Joaquim Dias Curto
ISCTE Business School, Department of Quantitative Methods
RESUMO
Pretende-se com este trabalho estudar a relação dinâmica entre os preços de electricidade do mercado grossista em Espanha e os preços das principais referências de combustível para a geração de electricidade (carvão, petróleo, gasóleo e o gás natural). A relação dinâmica entre os diferentes sistemas eléctricos interligados (Espanha e Portugal, Espanha e França), utilizando como referência os preços de electricidade dos mercados grossistas formados em cada sistema eléctrico, também é relevante para efeitos de análise, pois impacta na evolução dos preços de electricidade do mercado grossista em Espanha.
Os resultados sugerem: cointegração entre os preços de electricidade do mercado grossista em Espanha e das variáveis em análise (combustíveis e preços de electricidade grossistas); relação de longo prazo entre os preços de electricidade do mercado grossista em Espanha, os preços do carvão, os preços do petróleo, os preços do gasóleo, os preços do gás natural do mercado holandês TTF e os preços de electricidade do mercado grossista em Portugal; relação de curto prazo entre os preços de electricidade do mercado grossista em Espanha e os preços do gás natural do mercado inglês NBP e do mercado belga Zeebrugge; foi encontrada exogeneidade forte na relação entre os preços de electricidade do mercado grossista em Espanha e os preços de electricidade do mercado grossista em França; proporcionalidade entre os preços do petróleo, os preços do gás natural do mercado holandês TTF e os preços de electricidade do mercado grossista em Espanha; e a evidência de assimetria dos preços de electricidade do mercado grossista em Portugal com movimentos “abruptos” na sua relação com os preços de electricidade do mercado grossista em Espanha. Uma série de implicações serão abordadas.
Palavras-chave: energia; integração de mercados; preço da energia eléctrica e cointegração.
Classificação JEL:
C32 – Multiple or Simultaneous Equation Time-Series Models G12 – Asset Pricing
ABSTRACT
The aim of this work is to study the dynamic relationship between prices of wholesale electricity market in Spain and prices of the main fuel references to generate electricity (coal, crude oil, gasoil and natural gas). The dynamic relationship between the various interconnected electrical systems (Spain and Portugal, Spain and France), using as reference prices for wholesale electricity markets formed in each electrical system, is also relevant for analysis purposes due to impacts on prices of wholesale electricity market in Spain.
The results suggest: cointegration between prices of wholesale electricity market in Spain and the variables under analysis (fuel and wholesale electricity market prices); a long-term relationship between prices of wholesale electricity market in Spain, coal prices, crude oil prices, gasoil prices, natural gas prices of the Dutch TTF market and the prices of wholesale electricity market in Portugal; a short-run relationship between prices of wholesale electricity market in Spain and natural gas prices of the English NBP market and Belgian Zeebrugge market; the presence of strong exogeneity in the relationship between prices of wholesale electricity market in Spain and prices of wholesale electricity market in France; proportionality between crude oil prices, natural gas prices of the Dutch TTF market and prices of wholesale electricity market in Spain; and the evidence of asymmetry in the electricity prices from the wholesale market in Portugal with “steep” movements in relation to prices of wholesale electricity market in Spain. A number of implications will be addressed.
Keywords: energy; market integration; electricity pricing and cointegration.
JEL Classification:
C32 – Multiple or Simultaneous Equation Time-Series Models G12 – Asset Pricing
ACKNOWLEDGEMENTS
First of all, I am most grateful to my supervisor, Prof. Rui Menezes, for his guidance which proved to be of immense value and extremely helpful in the elaboration of this thesis work. I would also like to express my gratitude to Prof. José Dias Curto, Professor of empirical methods in finance, for being a major influence in choosing the subject of this thesis. Another special thank you note is addressed to my colleague and coordinator Eduardo Teixeira for giving me all the assistance and helpful comments and for his availability and generous discussions on technical issues. And last, but certainly not least, I would like to thank my beloved wife, Carolina for her support in everything that I do and particularly throughout the conclusion of my degree in Finance.
INDEX
1 INTRODUCTION ... 3
2 ENERGY COMMODITIES: A BRIEF DESCRIPTION ... 7
2.1 Crude Oil ... 8
2.2 Refined Oil Products ... 9
2.3 Coal ... 10
2.4 Natural Gas ... 14
3 THE SPANISH ELECTRICITY MARKET: A BRIEF OVERVIEW ... 19
3.1 Electricity Markets ... 19
3.2 The Spanish Case and MIBEL ... 21
3.3 OMEL: The MIBEL Wholesale Market Operator ... 28
4 THEORICAL OVERVIEW ... 35
4.1 Nonstationarity ... 35
4.2 Cointegration and EC Model ... 38
4.3 Cointegrated Relationship Properties ... 41
5 DESCRIPTIVE STATISTICS AND GRAPHICAL OVERVIEW ... 47
6 EMPIRICAL FINDINGS ... 57
6.1 Unit Root Tests and Nonstationarity ... 58
6.2 Cointegration and Estimated VEC Model ... 59
6.3 Exogeneity ... 62
6.4 Proportionality ... 65
6.5 Asymmetry ... 69
7 SUMMARY AND CONCLUSIONS ... 73
REFERENCES ... 75
1
INTRODUCTION
Electricity is a form of energy used for a very wide range of applications. It is easy to control, non-polluting at the location of its usage and convenient; it is used in the application of heat, light and power. As a secondary energy source, electricity is generated from the conversion of other energy sources, such as coal, natural gas, oil, nuclear power, hydro power and other renewable sources. This implies that electricity markets and electricity prices are fundamentally linked to markets for primary fuels and environmental conditions such as wind and rain.
Moreover, from a financial and commodity markets perspective, wholesale electricity1 prices can generally be viewed as the result of investors having created real options upon various underlying primary fuel commodities such as natural gas, oil or coal. Thus, as electricity is often traded on exchanges close to an hour before it is needed, in this short term, the variable cost of power generation is essentially just the cost of the fuel.
Economic theory suggests a relationship should exist between input and output prices. Consider the simplest case of a single factor of production (input) used to produce a single product, a static supply and demand model suggests that increasing the marginal cost2 of the input leads to an increase in the product price. Likewise, an increase in demand leads to an increase in quantity demanded for the product, therefore, a higher price. Associated with these changes are increasing marginal costs caused by the increased use of the input. Economic theory, however, does not state how such relationships will respond in a dynamic framework. Further complicating the issue are numerous locations using multiple inputs for power generation with different substitutability and complementary relationships. The degree of price transmission from input to output, therefore, may depend on the cost share of the input factor in question.
1 Energy supplied by one producer or marketer to another for eventual resale to consumers.
2 The MIT Dictionary of Modern Economics (Pearce, 1992) defines marginal cost as “the extra cost of
producing an extra unit of output”. Paul Samuelson defines marginal cost more cautiously as the “cost of producing one extra unit more (or less)”. The “or less” is important. The assumption behind this definition is that producing one more unit of output would cost exactly as much as producing one less unit would save.
ECONOMETRIC STUDY OF THE SPANISH ELECTRICITY SPOT MARKET AND PRIMARY ENERGY MARKETS
4
However, the current volatile commodities market makes it very difficult to predict the price behaviour even more in the case of the power market. That makes it crucial to know what the possible external causes might be.
This study examines the long-run relations and short-run dynamics between electricity prices and other factors that may impact the Spanish wholesale electricity spot prices. The factors under analysis are mainly three fossil fuels (coal, natural gas and crude oil), one refined oil product (gasoil) and also the wholesale electricity spot prices formed in Portugal and France. Providing information on the dynamics of electricity and fuel source prices allows for a better understanding of price information flow among the markets.
First, coal and natural gas serve as important sources of fuel supply in electricity generation process, being basically the marginal technologies that define the wholesale electricity spot price formation. According to 2008 data published by the Spanish transmission system operator3 REE4, about 49% of the electricity in Spain was generated using coal, natural gas and fuel oil, with natural gas accounting for more than one third of the electricity generation and coal for around 16%. Thus, changes in coal and natural gas prices can directly affect the cost of generating electricity and contribute to its price at the retail level. Second, crude oil prices may also contribute to form electricity prices directly by raising electricity generation costs and indirectly through changes in market sentiments. The major long-term natural gas contracts that use crude oil as a price reference can be another relevant issue to discuss. In the context of MIBEL5, Portugal and Spain use OMEL6 power exchange7 platform as electricity wholesale market operator. Wholesale electricity spot price formation in OMEL uses “market splitting” procedure to solve cross-border congestion management (one single Iberian price area if there is no congestion in the interconnection between Spain and
3 Transmission System Operator is a body responsible for operating and maintaining the physical electricity
network.
4 Red Eléctrica de España.
5 An acronym for Mercado Ibérico de Electricidade, the joint Spanish-Portuguese electricity market that came
into effect in July 2007 and allows participants to buy and sell power on either side of the Spain / Portugal border to create a pan-Iberian market with more than 28 million business customers.
6 Compañia Operadora del Mercado de Electricidad.
7 Power exchange is an entity set up to provide an efficient, competitive trading arena, open on a
non-discriminatory basis to all electricity suppliers, which meets the load of all exchange customers at efficient prices.
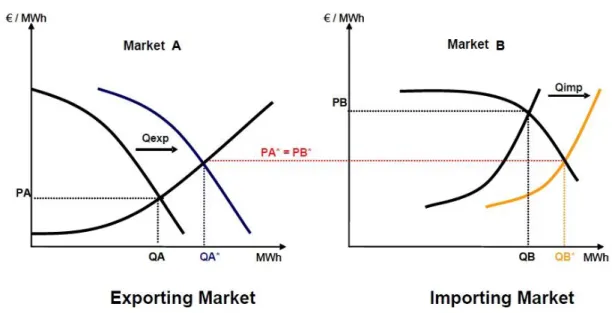
Portugal and with distinct price areas if there is congestion in the interconnection between both countries). France is also another country connected with Spain that uses the interconnection between them for exporting and importing electric energy. In France the wholesale electricity spot price is determined by the Powernext power exchange which nowadays belongs to the European Power Exchange Spot (EPEX Spot, a former cooperation between EEX8 and Powernext). Interconnection capacity makes it possible to trade electricity between countries. So, the wholesale electricity market price evolution in each country as an impact on the cross-border electricity flows between the two systems and dictates the transit of the energy flow from one system to another (if the electricity price in Spain is greater than the electricity price in France, a transit of energy flow between France and Spain should occur; if the electricity price in Spain is lower than the electricity price in France, a transit of energy between Spain and France should occur). Studying the relations and dynamics between interconnected systems using as an input the electricity spot price formed in each electrical system is also relevant because it might also have an impact on the evolution of the Spanish wholesale electricity spot prices.
This thesis aims to present a synthesis of econometric models that allow an explanation for the relationship between electricity prices and fuel prices. The study is organized as follows: Chapter 2 begins with energy commodities and their impact on world economy. This chapter also makes an introduction to each relevant primary energy commodity with impacts on power generation fuel cost. A brief overview of the Spanish Electricity Market can be found in Chapter 3. This chapter begins with a description about Electricity Markets and ends with a reference to the Spanish Electricity Market in the context of MIBEL. Since the vast majority of economic and financial series show clear evidence of nonstationarity, this concept is introduced in Chapter 4 and tests for nonstationarity are presented. It continues with the notion of cointegration from which it is possible to infer market integration. Additionally, to validate certain issues about some cointegration properties, a study about exogeneity, proportionality and asymmetry will also be shown. Following the data presentation in Chapter 5, Chapter 6 shows the empirical findings to verify the concepts derived in the theoretical framework described in Chapter 4. Finally, conclusions are presented in Chapter 7.
2
ENERGY COMMODITIES: A BRIEF DESCRIPTION
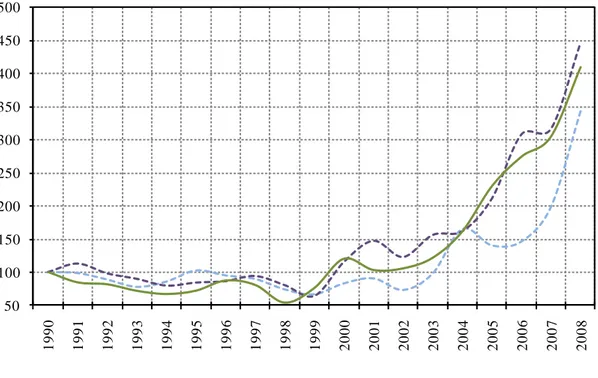
Over the past years, the entire world economy has been affected by a massive increase in energy prices. Yet only a few years ago, there was complete confidence that cheap energy would last indefinitely.
Energy use is crucial for modern society and world energy demand is growing constantly. In recent years, public interest in the energy sector has risen sharply with rapidly increasing oil prices, the liberalization of energy markets, and the first noticeable effects of climate change caused by the burning of fossil fuels. Securing a reliable and sustainable energy supply in light of declining resources and climate change mitigation will be a key challenge for the 21st century.
Figure 1 - Historical evolution of fuel prices
Source: BP Statistical Review of World Energy, June 2009 (1990 = 100, prices in USD)
Until the mid-20th century, energy demand was almost exclusively met by domestic energy sources. Since then, fossil fuels have become traded internationally and for electricity regional interconnected markets have evolved. Liberalization of energy markets in many regions of the world has led to new electricity and gas markets and to a significant increase in trading volumes. 50 100 150 200 250 300 350 400 450 500 1990 1991 1992 1993 1994 1995 1996 1997 1998 1999 2000 2001 2002 2003 2004 2005 2006 2007 2008
ECONOMETRIC STUDY OF THE SPANISH ELECTRICITY SPOT MARKET AND PRIMARY ENERGY MARKETS
8
Besides the energy companies and besides large consumers and emitters, banks and other speculative traders participate in these growing markets. In recent years, commodities have been increasingly recognized as an important asset class in fund management which can improve a portfolio’s risk profile. Energy and emissions markets are often described as unstable and erratic. They are characterized by a multitude of complex products, by high price volatility, and by fundamental interactions between each other. For example, gas prices will not develop independently of oil prices in the long run, as these fuels can be used as substitutes for each other in many applications. Electricity prices depend on electricity generation costs, which are directly impacted by prices for fuels and in the case of environmental restrictions derived from climate change policies the use of fossil fuels directly impact on CO2 emissions pricing trough its more extensive use.
2.1 CRUDE OIL
The Oil Market is certainly the most prominent among the energy markets. Crude Oil (or petroleum) is found in reserves spread across particular regions of the earth’s crust, where it can be accessed from the surface. Even though petroleum has been known and used for thousands of years, it became increasingly important during the second half of the 19th century as a primary energy source and as a raw material for chemical products.
Today, crude oil is still the predominant source of energy in the transportation sector and is often taken as a benchmark for the price of energy in general. In Europe, for example, prices of natural gas are typically derived from oil prices. Therefore oil prices also have an impact on electricity prices, even though oil plays a minor role as a primary energy source for electricity generation.
The physical crude oil market has to deal with a large variety of different oil qualities (viscosity, sulphur contents) and with different means of transportation (pipeline, shipping). All of these characteristics influence the oil price. Nevertheless, a liquid oil market has been developed, using few reference oil qualities as benchmarks for pricing an individual oil quality. The most popular benchmark oils are:
West Texas Intermediate Crude Oil (WTI): Reference for the US market, Sulphur content: 0.3%;
Brent Crude Oil: Reference for the North Sea oil market with a similar quality as WTI. Sulphur content: 0.3%;
Dubai Crude Oil: Reference for the Middle East and Far East markets. Sulphur content: 2%.
2.2 REFINED OIL PRODUCTS
Crude oil is never consumed “as it is” in final uses but undergoes refining processes, producing many oil products which are used by both intermediate industries and end users. The refining process in its basic form is a distillation process, where crude oil is heated in a distillation column. The lightest components can now be extracted at the top of the column whereas the heaviest components are taken out of the bottom of the column. To increase the yield of the more valuable lighter products, a cracking process is used, breaking up the longer hydrocarbon molecules. Other processes are needed to remove the sulphur content. Ordered by increasing density, the most important oil products are:
Liquefied petroleum gases (LPG): Propane or butane; Naphtha: Mainly used in chemical industry;
Gasoline: Mainly used for transportation;
Middle distillates: Kerosene, heating oil and diesel (gasoil);
Fuel oil: Used in thermal power plants and large combustion engines.
Owing to the combined production process, prices of different oil products are usually tightly related to each other and can be expressed in terms of price spreads9 against crude oil. The lighter and more valuable products have higher spreads against crude oil than the heavier products. In special circumstances, such as a military crisis, prices for certain products (e.g. jet fuel) can spike upwards in relation to crude oil because of the limited refining capacities and the limited flexibility of refineries to change the production ratios among the different products.
The European market in refined products is highly competitive, and the industry is quite large and developed, as Europe accounts for more than 17%10 of total world refining capacity. European refiners transform and move a significant amount of risk in the market since they not only buy crude oil but also sell refined products. Both crude and refined
9
Spread is the difference between the prices of a distinct security or asset.
ECONOMETRIC STUDY OF THE SPANISH ELECTRICITY SPOT MARKET AND PRIMARY ENERGY MARKETS
10
products are volatile even in the short term, and correlation among these prices, especially in the medium and long term, is able to transfer downward in the energy markets a part of the risk they incur from crude oil inputs; the rest of the risk is borne by them. Anyway, the amount of risk borne directly by refiners is not trivial. In fact, the refining margin, which is the difference between refined product prices and crude oil prices, has always been quite volatile.
The most important refined product in Europe is gasoil, which is used for domestic heating and for transportation (diesel engines). Improvements in diesel engine technology and tax incentives have led to a strong growth of diesel consumption in Europe. Fuel oil plays a limited role, but is still frequently used as a price reference for natural gas contracts.
The market for refined oil products in Europe is divided into NWE ARA (North-western Amsterdam-Rotterdam-Antwerp) and MED (Mediterranean, Genoa).
One typical financial instrument for European gasoil is Gasoil swaps11 traded OTC12 and typically refer to the monthly average gasoil price (ARA or MED) as published by Platts13 for setting the floating payments.
2.3 COAL
Coal is a fossil fuel, usually with the physical appearance of a black or brown rock, consisting of carbonized vegetal matter. It is formed plant remains that have been compacted, hardened, chemically altered, and metamorphosed by heat and pressure over geological time. It is used as a main source of fuel for the generation of electricity worldwide and for steel production. Coal is heterogeneous source of energy, with a significantly varying quality. Coal types are distinguished by their physical and chemical characteristics. Characteristics defining coal quality are, for example, carbon, energy,
11
A Gasoil Swap is derivative used as a hedge or as a speculative tool against the price of a physical commodity. Its price is dependent on the price of the underlying commodity. In this case, Gasoil swap is a derivative used to hedge on the price of physical Gasoil. This commodity is traded daily on a fixed price basis to be settled against a floating price.
12
Over-the-Counter trading is to trade financial instruments such as stocks, bonds, commodities or derivatives directly between two parties. It is contrasted with exchange trading, which occurs via facilities constructed for the purpose of trading (i.e., exchanges).
13 Platts is a provider of energy and metals information and a source of benchmark price assessments in the
sulphur, and ash content. The higher the carbon content of a coal the higher its rank or quality. These characteristics determine the coal’s price and suitability for various uses.
There are three main categories of coal. These are hard coal, sub-bituminous coal and lignite.
Figure 2 - Types of Coal
Source: World Coal Institute
Hard coal has a high gross calorific value greater than 5700 kcal/kg and can be categorized as follows:
Coking coal is a premium-grade bituminous coal at the top end of the quality spectrum used to manufacture coke for the steelmaking process;
Steam coal is coal used for steam raising and space heating purposes. It includes all anthracite coals and bituminous coals not classified as coking coal. As primary fuel for hard coal fired power plants, steam coal with a calorific value greater than 6000 kcal/kg and with low moisture, ash and sulphur (less than 1%) is used.
There are two main trading regions, the Atlantic and the Pacific region. South Africa, Columbia and Russia are the main coal suppliers for the Atlantic region and Indonesia, Australia and China for the Pacific region. There is also a small interexchange with Australia and Indonesia supplying both the Pacific and the Atlantic region.
ECONOMETRIC STUDY OF THE SPANISH ELECTRICITY SPOT MARKET AND PRIMARY ENERGY MARKETS
12
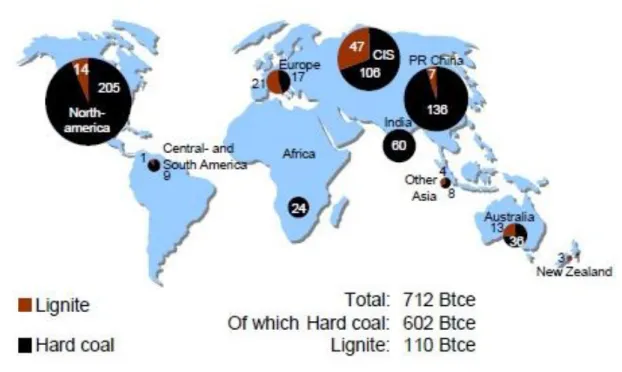
Figure 3 - Worldwide distribution of coal reserves
Source: CIAB (2009)
Because coal transportation can be expensive, in some instances “it accounts for up to 70% of the delivered cost of coal” (Burguer et al., 2007), coal prices depend on the point of delivery. Standard delivery points in international coal trading are, for example, Richards Bay in South Africa, Newcastle in Australia, ARA for Central Europe or the Central Appalachian in the United States.
The characteristics defining the quality of coal also determine its price. Energy content is the most price relevant characteristic, and quoted prices per tonne always refer to a specified quality and in particular to a specified energy content.
Price information for hard coal can be obtained either from exchanges, from brokers or from independent information service providers. Price information published by the information service is typically generated by telephone or e-mail survey covering sellers of physical coal, utility buyers, trading companies and broking companies. Market analysts then assess the price of the standard specified coal that conforms to the required specification. In contrast to an exchange, an information service has no secured information about the concluded trades.
Traditional Financial Services (TFS), a broker of OTC physical and derivative products, averages prices originally published by Argus Media and McCloskey’s14 and generates the well-accepted All Publications Index (API). The TFS API indices are published in the Argus/McCloskey Price Index Report. There are the following API indices:
API#2: is the index for the NWE ARA region quoted as CIF15
ARA and is an important benchmark for Central Europe. Delivery must be within the next 90 days, the energy content is specified at 6000 kcal/kg and the sulphur content must be less than 1%;
API#3: is the index for FOB16
Newcastle, Australia. It is also a benchmark for CIF Japan prices by adding a Panamax17 freight assessment. Delivery must be within the next 90 days, the energy content is specified at 6700 kcal/kg and the sulphur content must be less than 1%;
API#4: is the index for the FOB Richards Bay, South Africa. Delivery must be within the next 90 days, the energy content is specified at 6000 kcal/kg and the sulphur content must be less than 1%.
The delivery price of coal is determined in part by ocean freight rates. They are an important factor for the price of coal in different regions and for the competitiveness of coal against other fuels. The main factor that will affect the future movement of freight rates is the overall development of dry bulk18 trade. Mainly Cape19 and Panama sized vessels are employed in international coal trading. Cape sized vessels, used, for example, for the route Richards Bay to ARA, are also employed in the iron ore trade. As the shipping capacity is limited, the activity of the world’s steel industry has an impact on coal freight rates.
14 McCloskey is a premier source of news, analysis and data on the international coal industry.
15 Cost, Insurance and Freight: The selling price includes the cost of the goods, the freight or transport costs
and also the cost of marine insurance. However, the transfer of risk takes place at the ship’s rail.
16
Free On Board: The seller pays for transportation of the goods to the port of shipment and for loading costs. The buyer pays for freight, insurance, unloading costs and further transportation to the destination. The transfer of risk is at the ship’s rail.
17
Panamax ships are the largest ships that can pass through Panama Canal. The size is limited by the dimensions of the lock chambers and the depth of the water in the canal. An increasing number of ships are built to the Panamax limit to carry the maximum amount of cargo through the canal.
18 A bulk carrier, bulk freighter, or bulker is a merchant ship specially designed to transport unpackaged bulk
cargo, such as grains, coal, ore, and cement in its cargo holds.
19 Capesize ships are cargo ships originally too large to transit the Suez Canal (i.e., larger than both panamax
ECONOMETRIC STUDY OF THE SPANISH ELECTRICITY SPOT MARKET AND PRIMARY ENERGY MARKETS
14 2.4 NATURAL GAS
Next to oil and coal, natural gas is one of the most important primary energy sources covering about 24% of worldwide energy consumption in 2008 (BP Statistical Review of World Energy, 2009). It is primarily used as a fuel for electricity generation, for transportation and for domestic heating.
Natural gas is found in the earth’s crust mostly in gas or oil fields. Unlike oil, because of its low density, gas is difficult to store and transport. In the past, gas found in oil fields was simply burned without any economic use. With growing demand for primary energy sources, gas prices have risen and large investments have been made to build an infrastructure for gas transportation, either in the form of pipelines or in the form of liquefied natural gas (LNG) terminals.
Figure 4 - Worldwide production share of Natural Gas in 2008
Source: BP Statistical Review of World Energy, June 2009
The countries with the highest gas production are Russia, the United States and Canada selling most of their gas via pipeline. LNG exports, however, are becoming more and more important in rising gas prices and new investments in LNG terminals are being made.
Compared to oil, the natural gas market is more regional due to the high costs of gas transportation. The following regional markets can be distinguished:
19,6%
19,0%
5,7% 55,7%
The North American market; The European market; The Asian market.
Historically, these regional markets have had little interaction, since LNG played a significant role only in the Asian market. With declining gas reserves and growing demand in North America and Western Europe, the importance of LNG for these markets, and therefore the market interaction, will increase over the next decades.
Another important issue to discuss is the contractual relationship between the different players of the natural gas business. Producers mostly sell the gas to intermediaries and traders, very often through long-term contracts. Gas prices are mainly set, at least in Europe, using algebraic formulae whose inputs are prices of other primary and secondary energy sources. The real formulae usually contain additive and multiplicative terms. There are always time lags for the calculation of average energy input prices, consequently reducing short-term gas price volatility. Moreover, energy input prices are generally expressed in US dollars, so exchange rates are also included in the formulae. Finally, these formulae are never used to calculate prices on a daily basis but over longer intervals, say, every one to three months, and during this time, prices remain fixed at the most recently calculated level. Each first partial derivative in the formula will express the sensitivity of the gas price to energy input prices; they are normally positive and constitute a distinct feature as they change from formula to formula. Very often, the energy input prices in the formulae are crude and refined product prices. The price that the European importers pay for natural gas is determined by a formula set in a long-term contract, and they are usually able to sell gas to customers (power generators, firms and households) according to a very similar formula, to which they add a fixed mark-up. The result, which is often referred to as a cost “pass-through”, brings a nearly perfect contractual risk transfer and residual risk being close to zero. This long-established practice is welcomed by producers, as gas is often extracted in association with crude oil, and also by gas traders because this link will always assure that gas prices are competitive against the two main available substitutes, which are fuel oil in the electricity industry and heating gasoil in the households market.
ECONOMETRIC STUDY OF THE SPANISH ELECTRICITY SPOT MARKET AND PRIMARY ENERGY MARKETS
16
Traditionally, the European gas market has been supplied by three large exporters: Russia, Norway and Algeria. The most important gas trading hubs20 in Europe are listed below:
The National Balancing Point (NBP) in the United Kingdom (UK): a notional point within the UK gas pipeline network (basis for most UK gas trades);
Title Transfer Facility (TTF) in Netherlands: physical natural gas delivery at the notional trading point, the Dutch Title Transfer Facility;
Zeebrugge in Belgium: physical natural gas delivery at the Zeebrugge hub operated by Huberator.
The continental European market and the UK market are linked by the Interconnector pipeline that began operation in 1998 and by the BBL21 pipeline that began operation in 2006. The Interconnector connects the NBP gas trading hub to the Zeebrugge gas trading hub while the BBL pipeline connects the NBP gas trading hub to the TTF gas trading hub.
Figure 5 - Natural Gas pipeline connections between UK and Continental Europe
Source: The European Network of Transmission System Operators for Gas (ENTSO-G)
Since the Interconnector and BBL make arbitrage trading possible between the UK and continental Europe (within the technical capacity restrictions of the Interconnector and BBL
20 A successful gas trading hub has two basic characteristics: first and foremost it must be possible to easily
move gas into and out of the market, whether the market is defined as a single point or as a whole area (virtual hub); second, there must be a use for the gas, either through the existence of a significant customer base, or through the demand from other markets that can be reached from the traded hub.
21 The Balgzand-Bacton Line is a 235 kilometre pipeline between Balgzand in the Netherlands and Bacton in
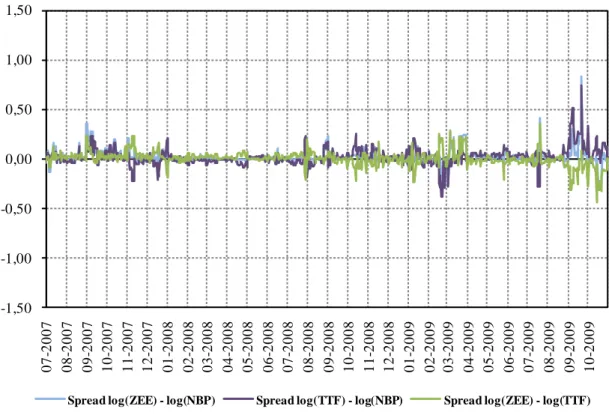
pipeline), the gas spot prices at NBP, TTF and Zeebrugge are closely connected. Therefore the spreads between NBP, Zeebrugge and TTF are most of time near zero. Besides this, there are short periods of time where the spreads are significantly different from zero (historically, this was regularly the case when the Interconnector or BBL was shut down for maintenance work). However, there is one circumstance that possibly turns the Zeebrugge and NBP natural gas markets into a more integrated market than TTF and Zeebrugge. This circumstance is characterized by technical restrictions of BBL pipeline usage since it is not capable of physical reverse flow (actually the only physical capable flow is delivering natural gas from TTF to NBP) while natural gas in the Interconnector pipeline physically flows in both directions.
Figure 6 - Spreads evolution between the major European natural gas trading hubs
Source: THOMSON REUTERS (European natural gas prices in natural logarithms) -1,50 -1,00 -0,50 0,00 0,50 1,00 1,50 07 -2007 08 -2007 09 -2007 10 -2007 11 -2007 12 -2007 01 -2008 02 -2008 03 -2008 04 -2008 05 -2008 06 -2008 07 -2008 08 -2008 09 -2008 10 -2008 11 -2008 12 -2008 01 -2009 02 -2009 03 -2009 04 -2009 05 -2009 06 -2009 07 -2009 08 -2009 09 -2009 10 -2009
3
THE SPANISH ELECTRICITY MARKET: A BRIEF OVERVIEW
3.1 ELECTRICITY MARKETS
The electricity market is characterized by a number of specific features which affect both its market design and the nature of competition. The most notable feature is that, unlike gas, electricity cannot be stored on a significant scale and needs to be consumed instantaneously. The lack of storability, coupled with the fact that final electricity demand varies considerably during the day and according to seasons, means that electricity production levels need to be able to adjust rapidly on an hourly basis and have to constantly match demand requirements. This implies that some generation capacity needs to be available primarily to meet demand peaks (but will not be needed at lower demand levels), and that prices can rise significantly during peak periods (to allow peaking capacity to recover both its fixed and variable costs). The fact that final demand does not respond significantly to price changes (typically because it does not face real-time prices due to the absence of hourly metering of consumption) accentuates the need for spare capacity during peak demand periods.
The features of the electricity market described above imply that a combination of power plants is used to optimally meet demand at any given point in time. Plants with high fixed costs and low marginal costs are used to meet baseload demand (i.e., the constant minimum level of demand across a time period, e.g., a year). Baseload plants typically include nuclear, run-of-river hydro plants and also renewable capacity which cannot be modulated (e.g., wind power). Plants with low fixed costs and high marginal costs (e.g., gas and/or oil turbines) are used instead to meet demand peaks. Reservoir hydroelectric power and pumped storage capacity are also used to meet demand peaks. Finally, plants with intermediate marginal and fixed costs (e.g., coal and CCGT22 plants) often operate as “mid-merit” generation (i.e., they do not produce in the periods of lowest demand, but generate in all other periods).
22 Combined-Cycle Gas Turbine (CCGT): an energy efficient gas turbine system, where the first turbine
generates electricity from the gas produced during fuel combustion. The hot gases pass through a boiler and then into the atmosphere. The steam from the boiler drives the second electricity-generating turbine.
ECONOMETRIC STUDY OF THE SPANISH ELECTRICITY SPOT MARKET AND PRIMARY ENERGY MARKETS
20
A “merit order” of plants of different technologies can therefore be constructed in generation markets, ranking capacity from the cheapest to the most expensive (in terms of variable costs). Fluctuations in relative fuel prices (including CO2 emission costs) affect the position of different technologies in the merit order (and in particular can cause the relative position in the merit order of coal and CCGT to “flip”).
Figure 7 - Hypothetical merit order in the wholesale electricity market
Source: Competition and Regulation in the Spanish Gas and Electricity Markets (Federico and Vives, 2008)
In the paradigm, competitive generation market (i.e., one with low concentration levels), plants face incentives to offer their energy at variable cost during most hours of the year. Hourly prices are therefore set at the marginal cost of the most expensive plant in the merit order that is needed to meet demand in that hour (i.e., the marginal plant). Plants with lower marginal costs than the marginal plant can also produce during that hour and earn “infra-marginal rents” that allow them to recover their fixed costs (e.g., capital costs and fixed operation and maintenance costs). At the very peak, prices need to rise above the variable cost of the marginal plant in that hour to allow it to recover its fixed costs, and can therefore reach (in the theoretical model) the maximum willingness to pay for electricity.
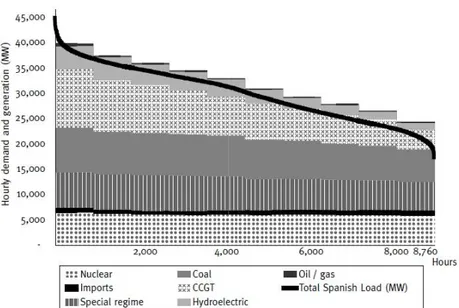
For a given generation merit order, the distribution of demand levels across a given time period (e.g., a year) will therefore affect the distribution of electricity spot prices. Both demand and prices can be described as annual “duration curves”, i.e., plots of all the demand/price levels observed in a year (i.e., 8760 hours), which rank hourly levels from the highest (0% duration or hour 1) to the lowest (100% duration or hour 8760).
Figure 8 - Hypothetical Load Duration Curve
Source: Competition and Regulation in the Spanish Gas and Electricity Markets (Federico and Vives, 2008)
Congestion on the transmission network can change the theoretically optimal merit order. In situations of network congestion, the operator of the transmission system (which is tasked with ensuring the perfect balance of demand and supply) will have to call on more expensive units located in the congested area to produce, instead of plants that are willing to produce electricity at a lower price in areas with surplus generation.
3.2 THE SPANISH CASE AND MIBEL
The Spanish energy sector was liberalized in the late 1990s. The key pieces of legislation introduced to liberalize the industry were the Electricity Law (Ley del Sector Eléctrico) in 1997 for the electricity market, and the Hydrocarbons Law (Ley de Hidrocarburos) in 1998 for the gas market.
One of the most contentious elements of the liberalization of the Spanish energy industry was the creation of a market for electricity generation. The Spanish electricity generation market was established in 1998 and since then, five firms have been operating in the Spanish market as competitors: Endesa, Iberdrola, Unión Fenosa23, Hidroelectrica del
ECONOMETRIC STUDY OF THE SPANISH ELECTRICITY SPOT MARKET AND PRIMARY ENERGY MARKETS
22
Cantábrico24 and Electra del Viesgo25. The wholesale electricity market reaches a maximum peak load close to 36 GW and a yearly energy demand of about 232 TWh26.
Figure 9 - Power Exchanges in Europe
The basic design for the Spanish market was partially based on other liberalized electricity markets (most notably those in the United Kingdom, Scandinavia, California and some other US markets at the time).
Like the UK model, the Spanish market effectively concentrated most liquidity in a single marketplace (creating a potentially visible and reliable price signal) and introduced a mechanism for remunerating capacity. Unlike the British market, however, in Spain
24 In 2005, Hidroeléctrica del Cantábrico was acquired by Energias de Portugal SA. 25
In 2008, EON bought Electra del Viesgo to his major stakeholder ENEL.
generators could vary their bids hour by hour and were also subject to a stranded cost recovery mechanism which reduced incentive to increase wholesale prices.
Another important market design reform implemented in the Spanish (and Iberian) wholesale electricity market in 2007 was the launch of MIBEL on 1st July 2007. Since then, the daily market is managed by OMEL while the derivatives market is managed by OMIP27.
Generation units located in each country and consumption both take part in the daily market. The method which forms the marginal clearing price is totally valid, resulting, in general, in a single price for the entire Iberian system and in a flow of electric energy between the two countries.
The method currently used to manage congestion in the interconnection is called “Market Splitting” which allows solving congestion in a non-discriminatory environment for operators in addition to the reduction of problems associated to the possible existence of a dominant position. This method is similar to that used in NordPool28 for congestion management when it occurs in the interconnections between Norway, Sweden, Finland and Denmark. If there is congestion on the interconnection Spain-Portugal in any direction, OMEL runs the “market splitting” procedure (Figure 10) which basically consists of making two separate procedures of price formation, one for the Portuguese market players and another for the Spanish market players taking into account the maximum amount of energy that can be exchanged between both systems and resulting in a different price for each country.
27
OMIP is the managing entity responsible for the organisation of the Portuguese division of MIBEL, ensuring the management of the MIBEL derivatives market, jointly with OMIClear (Energy Markets Clearing Company), a company constituted and totally owned by OMIP, which has the role of Clearing House and Central Counterparty for operations carried out in the market.
28 Nordic electric power exchange that provides market places for trading in physical and financial contracts in
the Nordic countries (Finland, Sweden, Norway, Denmark and recently Germany), which listed the world’s first exchange-traded electricity futures contract in October 1995. It now operates the world’s largest power derivatives exchange and also provides a carbon market for trading contracts on emission allowances and carbon credits. In 2002, Nordpool’s physical market was organized into a separate company, Nordpool Spot.
ECONOMETRIC STUDY OF THE SPANISH ELECTRICITY SPOT MARKET AND PRIMARY ENERGY MARKETS
24
Figure 10 - Market Splitting Mechanism
Source: EPEX Spot
Therefore, whilst MIBEL has established the mechanism for integration between the Spanish and Portuguese markets to take place, effective integration of the two markets has not been fully achieved yet. Greater interconnection capacity between the two systems is required for full market integration to take place. The expectation is also that, over time, the convergence of market design across the two systems (e.g., the harmonization of trading rules and of the mechanism for capacity payments) should also lead to greater convergence in market structures and technology mixes, and allow for the creation of an effective single Iberian market.
In practice, given the different cost structures of the wholesale markets in Spain and Portugal (this can be seen in Figure 11) and the amount of interconnection capacity (an average of roughly 1243 MW of export capacity into Portugal during the period 1st July 2007 to 31th October 2009), MIBEL has experienced market splitting for a significant amount of the time since July 2007.
Figure 11 - Generation share by technology in the daily market OMEL (from 01/07/2007 to 31/10/2009)
Spain has more diversified generation assets by technology type in the wholesale market. Renewables29 offer their energy in the wholesale market in Spain while in Portugal their energy is bilaterally contracted by the last resource supplier30. Excluding the matched energy from the Renewables in the wholesale market, Spain has only 57% of generation share that comes from fossil fuels thermal power plants (CCGT, thermal coal and fuel/gas power plants) while Portugal has 78%.
So, it seems that Spain is less dependent of fossil fuels power plants than Portugal due to a more diversified generation portfolio. In Portugal, electricity generation and electricity pricing is more dependent of fuel prices such as coal, natural gas and fuel oil. Looking at 2008 generation statistics published by the Portuguese transmission system operator REN31 and also by the Spanish transmission system operator REE (Figure 12), it is also possible to see the structural differences between the generation share of each technology in each country, particularly in Fossil Fuel technologies.
29
Renewable energy is energy which comes from natural resources such as sunlight, wind, rain, tides, and geothermal heat, which are renewable.
30 In Portugal, the last resource supplier company is Energias de Portugal Serviço Universal which has
established tariffs for electricity consumers defined by the Portuguese energy regulator, ERSE.
31 Rede Eléctrica Nacional, a company of Redes Energéticas Nacionais Group.
COAL 43% CCGT 33% FUEL/GAS 2% HYDRO 18% OTHER 4% PORTUGAL COAL 10% CCGT 27% FUEL/GAS 1% HYDRO 8% NUCLEAR 10% OTHER 12% RENEWABLES 32% SPAIN
ECONOMETRIC STUDY OF THE SPANISH ELECTRICITY SPOT MARKET AND PRIMARY ENERGY MARKETS
26
Figure 12 - Portugal and Spain generation share by technologies (2008)
Nuclear is the baseload technology that makes the difference between the two electrical systems because their variable costs are extremely low when compared with other technologies but with the disadvantage of having a long payback investment period to recover the fixed costs. Theoretically, the Spanish wholesale market merit order is cheaper than the Portuguese wholesale market merit order.
Figure 13 shows that it is possible to see that in the period that covers 1st July 2007 to 31th October 2009, Spain exported 19355 GWh of electric energy to Portugal in the daily market and imported 688 GWh from Portugal. The interconnection balance is 18667 GWh, indicating that, on average, the Spanish spot price is cheaper than the Portuguese Spot price. Only 76% of the available interconnection capacity to export was used, while only 3% of the available interconnection capacity to import was used (an average of roughly 1150 MW). 20% 57% 49% 15% 8% 28% 23% 0% 10% 20% 30% 40% 50% 60% 70% 80% 90% 100% PORTUGAL SPAIN
Figure 13 - Interconnection capacity and average energy flows between Portugal and Spain
However, it is possible to observe that during the same period the market spread prices evolution between both countries has been decreasing since the start of MIBEL (Figure 14).
Figure 14 - Spreads evolution in MIBEL spot prices
-2 000 -1 500 -1 000 -500 0 500 1 000 1 500 2 000 7 8 9 10 11 12 1 2 3 4 5 6 7 8 9 10 11 12 1 2 3 4 5 6 7 8 9 10 2007 2008 2009 In te rc o n n e c ti o n C a p a c it y ( M W )
IMPORT. [PT→ES] IMPORT. CAPACITY [PT→ES] EXPORT. [ES→PT] EXPORT. CAPACITY [ES→PT]
-0,05 0,00 0,05 0,10 0,15 0,20 0,25 7 8 9 10 11 12 1 2 3 4 5 6 7 8 9 10 11 12 1 2 3 4 5 6 7 8 9 10 2007 2008 2009
ECONOMETRIC STUDY OF THE SPANISH ELECTRICITY SPOT MARKET AND PRIMARY ENERGY MARKETS
28
In 2008, the spread value fell by 60% when compared to the spread value in the second half of 2007. When compared to the 2008 spread value the 2009 spread value suffered a decrease of 77%. It is therefore possible to conclude that some structural changes in the distribution of the generation share by technologies were made over time.
3.3 OMEL:THE MIBELWHOLESALE MARKET OPERATOR
3.3.1 ELECTRICITY MARKET ORGANIZATION
Two independent bodies, namely the Market Operator and the System Operator are responsible for operating the electrical system.
Operador del Mercado Ibérico de Energía - Polo Español, S.A. (OMEL) is responsible for managing the daily and intra-day markets, it is also responsible for settlement and communication of payment obligations and collection rights deriving from the energy contracted in the aforementioned daily and intra-day electricity production markets.
Figure 15 - Economic and Technical Management of the Spanish System
REE, the system’s operator, is responsible for the technical management of the electrical system, for carrying out all those functions deriving from the operation of ancillary services, abnormalities in the electricity market, as well as for settlement and communication of payment obligations and collection rights deriving from ancillary services and the capacity. The Portuguese system operator REN is responsible for the technical management of the Portuguese system.
In relation to its organisation, the electric energy production market involves the conjuncture of economic transactions deriving from the participation of market agents in daily and intraday market sessions, bilateral contracts and forward contracting, as well as the application of ancillary services and deviations.
Market agents are those bodies which are entitled to act directly in the electricity market as sellers and/or buyers of electricity. Producers, external agents, distributors and resellers can act as market agents, together with consumers of electrical power and the representatives of any of the aforementioned entities.
In this way, the deregulation model in Spain is configured as a model which enables both trading inside an official and organised market (forward supply, daily market and intraday market) and trading outside of it (bilateral contracts between producers, retailers and its qualified consumers including financial contracts). A key aim of the aforementioned model is to provide different trading possibilities on equal terms for all, allowing for the right price determination.
The daily market includes, in addition to sale and purchase bids directed towards it, OMIP’s open positions of forward procurement, the purchases of the vendors of bilateral contracts with distribution companies, the positions of vendors and purchasers of the primary emission auctions executed with physical delivery and the sales or purchases of energy arising from the declarations of rights of use of the auctions of interconnections.
Once the daily market session has been held by the market operator, and considering the bilateral contracts executed, the system operator studies the operating schedule’s technical viability to ensure the safety and reliability of the supply. If the resulting programme of the daily market plus the bilateral contracts does not comply with safety requirements, the system operator resolves these technical restrictions by modifying the programme of production units or pumping consumption units, resulting from the daily market and from
ECONOMETRIC STUDY OF THE SPANISH ELECTRICITY SPOT MARKET AND PRIMARY ENERGY MARKETS
30
the bilateral contracts, proceeding to strike a balance between production and demand through a competitive tender procedure.
The intraday market consists of six sessions held over 24 hours period which can be attended by all agents who have participated in the daily market or executed a bilateral contract, in compliance with the limitations set by the System Operator in order to avoid constraints.
Figure 16 - Sequence of Processes in the Electricty Market
Source: OMEL
3.3.2 THE DAILY MARKET
The purpose of the daily market, as an integral part of electricity power production market, is to handle electricity transactions for the following day through the presentation of electricity sale and purchase bids by market agents.
Submitting bids to the daily market can be done as follows:
The open positions communicated by OMIP/OMIClear forward market will be integrated as sale or purchase instrumental price bids;
The results of the communications of the execution of the power auctions of energy purchased by the distributors are integrated through the presentation by the sellers at these auctions of purchase bids at instrumental price;
The results of the execution with physical delivery of the options acquired by purchasers in primary power emissions can be integrated through the presentation of sale or purchase bids at open prices;
Owners of production units that are subject to the ordinary regime submit sales bids, as long as such units are available and their energy is not linked to a bilateral contract;
The distributors of electricity will submit specific sales bids for the amount of energy they are required to purchase according to the special system32. Nevertheless, electric energy generated by this special system is paid by a regulated tariff. In return, special system will sell their energy through the system of bids managed by OMEL, either directly or through their agent, by means of zero-price energy sales bids on the daily market and, as appropriate, bids on the intraday market;
External agents, retailers, and owners of production units subject to special regime, can also submit sale bids;
Purchase bids are presented by producers for the acquisition of the ancillary services of power plants and purchasing agents owning acquisition units, whether they are resellers, distributors, consumers, external agents or holders of pumping plants.
ECONOMETRIC STUDY OF THE SPANISH ELECTRICITY SPOT MARKET AND PRIMARY ENERGY MARKETS
32
Figure 17 - Market Agents Transactions
Source: OMEL
Sale and purchase bids can be made using between 1 and 25 energy blocks in each hour, with power and prices offered in each block. In the case of sales, the bid price increases with the block number, and it decreases in case of purchases.
The sale bids may be simple, or may include additional conditions:
Simple bids are presented for each hourly period and production unit, indicating a price and an amount of energy;
Complex bids are those which, fulfilling the simple bid requirements, also include some or all the technical or economic conditions.
OMEL matches purchase and sale bids received prior to 10 a.m. each day, whereby the price in each hour will be equal to the price of the last block of the sale bid of the last production unit whose acceptance has been required in order to meet demand that has been matched.
Figure 18 - Daily Market Supply and Demand Curves
Source: OMEL
The price or prices on the daily market are determined according to the following process. The matching algorithm first calculates a solution by considering that all international interconnections have unlimited import and export capacity. Once this solution has been calculated, a check is made to see whether there is a surplus of net energy balance in any one of the interconnections in the Iberian electrical system, considering bilateral contracts and declarations of use of rights. Depending on the interconnection involved, the process continues as follows:
In case of congestion in the French interconnection, the energy that creates congestion will be removed in the direction of the congestion until congestion disappears. In order to do so, the process consists of removing the energy of the units without previous capacity rights (those units which have not obtained rights in the explicit auctions previous to the daily market) following the price merit order until there is no congestion. Ifcongestion continues, energy will be taken out of the units with previous capacity rights (those units which have obtained transmission rights in the explicit auctions previous to the daily market) following the price merit order until there is no congestion;
ECONOMETRIC STUDY OF THE SPANISH ELECTRICITY SPOT MARKET AND PRIMARY ENERGY MARKETS
34
Once the interconnections in the Iberian system have been adjusted, the next step is to calculate the transactions between the Spanish and Portuguese systems. In the event that the previous transactions are incompatible with the commercial capacity published by the systems’ operators market splitting is performed at the Portuguese border. The aggregated curves of sale and purchase in both electrical systems are plotted. Each electrical system has a different price that will be the one applied to all purchase and sale bids in its electrical system at that time.
The matching result contains, for each hour, the marginal price and the schedule of production and demand for each electrical system established by OMEL, based on the matching of sale and purchase bids. The results of the matching process are then communicated by OMEL to the system operators who receive the schedules of the units of their competence.
The daily base operating schedule is drawn up by each one of the system operators and the result of the matching is accompanied by the notifications of the executions of the bilateral contracts.
4
THEORICAL OVERVIEW
Mjelde and Bessler (2009:4) refer that “there are strong prior beliefs that economic data are nonstationary”, meaning that any particular price measured over time will not be tied to its historical mean. Further, as discussed earlier, electricity and fuel prices are expected to be linked. That is, similar economic forces are expected to influence each market; although price or price movements are not expected to be identical across the different markets. As Engle and Granger (1987) have pointed out, individual economic variables may be nonstationary and wonder through time, but a linear combination of them may, over time, converge to a stationary process. Such a process, if present, may reflect the long-run equilibrium relationship, and is referred to as the cointegrating equation. To summarize, it is expected that the different prices will be tied together, so that prices from one market will not wander off independently of the behaviour of prices in the other markets.
The presence of a cointegrating relation among energy prices forms the basis for the specification of the vector-correction model (VECM). This study uses the error-correction model (ECM) for electricity prices in order to capture their dynamic relations with fuel prices and other wholesale electricity spot price data from which it would be possible to analyze the price dynamics between those prices and the Spanish wholesale electricity spot prices. The ECM represents the change in electricity prices as a linear function of its past changes, past changes in fuel prices and also the other electricity prices under analysis, and an error-correction term. For a cointegrated system, the error-correction term represents the deviation from the equilibrium relationship. Thus, an ECM provides two alternative channels of the interaction among electricity prices and fuel prices: short-run causality through past changes in energy prices, and long-run causality through adjustments in the equilibrium error.
Moreover, it is also imperative to validate issues concerning some properties of such equilibrium relationship by studying exogeneity, proportionality and asymmetry of each cointegrated relationship.
4.1 NONSTATIONARITY
Most economic and financial time series that are trend stochastically nonstationary are also integrated of first order, i.e., differencing once is enough to achieve stationarity. Suppose, for instance, that one is interested in the long-run properties that rule the relationship
ECONOMETRIC STUDY OF THE SPANISH ELECTRICITY SPOT MARKET AND PRIMARY ENERGY MARKETS
36
between two or more first-order integrated price series. In this case, one needs to focus on the variables measured in levels. However, a linear combination of first-order integrated variables usually generates a residual variable that is also first-order integrated. Under these circumstances, the usual t and F tests carried out on the Ordinary Least Squares (OLS) estimates do not follow, respectively, the t and F distributions and are, thus, meaningless (Phillips, 1986). What the model is most possibly capturing is a common stochastic trend between the variables in levels and not a causal relationship as required. Additionally, the residuals are strongly autocorrelated and the Durbin-Watson statistic converges to zero. Thus, the time series being analyzed are not related in the long-run although they may be related in the short-run, as is the case of the relationship between two random walks.
Stochastic nonstationarity can be examined on the basis of unit root tests, of which the most popular is the Augmented Dickey-Fuller or ADF test (Dickey and Fuller, 1981).
The ADF test is based on the following regression model:
(1)
Where is a constant term, is a linear deterministic trend in the data,
denotes the corresponding stochastic trend and the residuals . The symbol denotes a first difference, as usual, and the summation term captures any autocorrelation of the left-hand side variable. Taking , the ADF equation reduces to an AR(1) process. The null hypothesis in the ADF test is , using for the effect the MacKinnon critical values (MacKinnon, 1996).
The distribution of the ADF test under the null hypothesis is given by (Dufrénot and Mignon, 2002):
(2)
where represents a Brownian Motion over . Under the null hypothesis the variable is nonstationary, i.e., it contains a stochastic trend. The alternative hypothesis postulates that , under which the variable is stationary. In fact, under the alternative hypothesis the time series is a stationary process with or without deterministic terms.
Despite their popularity, the ADF tests suffer from low power problems when the process is stationary with roots close to one (Blough, 1992). Additionally, some unit root processes
behave more like a white noise than like a random walk in finite samples. By this reason, it is convenient to use alternative tests in order to conclude more accurately about the stationary nature of the series under analysis.
An alternative to the ADF test is the KPSS test (Kwaitkowski et al., 1992), which postulates in the null hypothesis that the time series is trend stationary, against the alternative that it contains a stochastic trend.
The data generation process of the KPSS test is given by:
(3)
Where is the sum of a deterministic trend ( ), a random walk ( ) and a stationary residual variable ( ) and where . The null hypothesis of stationarity is given by where the initial value is a constant. Given that is a stationary residual variable, then is a trend stationary process (TSP). Indeed, given the null hypothesis , the residuals must all be zero and, therefore, , which is a constant. Thus, under the null hypothesis, the first equation in (3) represents a trend stationary process. The test statistic of the KPSS is a Lagrange Multiplier test where the numerator is the sum of squared residuals obtained from regressing on a constant and a deterministic trend and the denominator is an estimator of the variance of the residuals .
Another alternative to the tests described before is the Phillips-Perron (PP) Unit Root Tests (Phillips and Perron, 1988). Phillips and Perron have developed a more comprehensive theory of unit root nonstationarity. This method uses nonparametric statistical methods to take care of the serial correlation in the error terms without adding lagged difference terms. Brooks (2008:330) refers that this “test often gives the same conclusion as the ADF test”.
Stationarity tests have stationarity under the null hypothesis, reversing the null and alternative under the Dickey-Fuller and Phillips-Perron approaches. Thus, under stationarity tests, the data will appear stationary by default if there is little information in the sample. One such stationarity test is the KPSS test. Brooks (2008:331) argues that the results of this test can be compared with the ADF/PP procedure to see whether the same conclusion is drawn. The null and alternative hypotheses under each testing approach are as follows in Table 1: