Repositório ISCTE-IUL
Deposited in Repositório ISCTE-IUL:
2018-08-09
Deposited version:
Post-print
Peer-review status of attached file:
Peer-reviewed
Citation for published item:
Sequeira, T. N., Santos, M. & Ferreira-Lopes, A. (2018). Human capital and genetic diversity. Eurasian Economic Review.
Further information on publisher's website:
10.1007/s40822-018-0112-6
Publisher's copyright statement:
This is the peer reviewed version of the following article: Sequeira, T. N., Santos, M. & Ferreira-Lopes, A. (2018). Human capital and genetic diversity. Eurasian Economic Review., which has been published in final form at https://dx.doi.org/10.1007/s40822-018-0112-6. This article may be used for non-commercial purposes in accordance with the Publisher's Terms and Conditions for self-archiving.
Use policy
Creative Commons CC BY 4.0
The full-text may be used and/or reproduced, and given to third parties in any format or medium, without prior permission or charge, for personal research or study, educational, or not-for-profit purposes provided that:
• a full bibliographic reference is made to the original source • a link is made to the metadata record in the Repository • the full-text is not changed in any way
The full-text must not be sold in any format or medium without the formal permission of the copyright holders. Serviços de Informação e Documentação, Instituto Universitário de Lisboa (ISCTE-IUL)
Av. das Forças Armadas, Edifício II, 1649-026 Lisboa Portugal Phone: +(351) 217 903 024 | e-mail: administrador.repositorio@iscte-iul.pt
1
Human Capital and Genetic Diversity
*Tiago Neves Sequeira
†Univ. Beira Interior and CEFAGE-UBI
Marcelo Santos
‡Univ. Beira Interior and CEFAGE-UBI
Alexandra Ferreira-Lopes
§ISCTE-IUL, BRU-IUL, and CEFAGE-UBI
Abstract
This paper investigates the relationship between human capital and the ancestral genetic diversity of populations. A simple model highlights a new channel through which genetic diversity can affect development: human capital. Additionally, empirical evidence of an unconditional hump-shaped relationship between genetic diversity and human capital is documented. This relationship decreases statistical significance when other deeply rooted determinants of human capital are taken into account. However, we found some significantly positive (linear) effects of genetic diversity. Thus, if there is a relationship between genetic diversity and human capital, this relationship tends to be positive: more genetic diversity is beneficial to human capital.
Keywords: human capital; genetic diversity; determinants of development; determinants of human capital.
JEL Codes: I25, N10, N30, O10, O50, Z1
* We thank the editor and two anonymous referees. We gratefully acknowledge financial support from FCT
- Fundação para a Ciência e a Tecnologia (Science and Technology Foundation), through project PTDC/EGE-ECO/112499/2009 and from FCT and FEDER/COMPETE, through grants UID/ECO/04007/2013 (POCI-01-0145-FEDER-007659) and UID/GES/00315/2013. We are grateful to comments from participants in the CEFAGE workshop. The remaining errors are ours alone. Some of the results are described in the text but that are not shown for space considerations. These results are available upon request to the corresponding author.
† Departamento de Gestão e Economia and CEFAGE-UBI. Universidade da Beira Interior. Av. Marques
de Avila e Bolama. 6200-001 Covilhã, Portugal. Corresponding author. e-mail: sequeira@ubi.pt.
‡ Departamento de Gestão e Economia and CEFAGE-UBI. Universidade da Beira Interior. Av. Marques
de Avila e Bolama. 6200-001 Covilhã, Portugal.
§ Instituto Universitário de Lisboa, ISCTE-IUL, ISCTE Business School Economics Department,
2
1
Introduction
The determinants of human capital have been reported very little in the literature. Although there is a huge literature on the determinants of schooling linked with quality of schooling, finding a weak causality between inputs to schooling and educational achievements, there are not many contributions that explore the deeply-rooted determinants of investment on the quantity and quality of human capital. In fact, Hanushek and Woessmann (2011) concluded that there is very little evidence in support of the influence of inputs in cross-country differences in schooling achievements while recognizing the essential effects of family and social background and of some country-specific school-related institutions. For example, Sequeira and Ferraz (2009) and Sequeira (2009) highlight the significant effect that country-risk has in education measures, and Galor and Klemp (2014) analyse the biocultural origins of human capital formation, using an extensive genealogical record for nearly half a million individuals in Quebec from the 16th to the 18th century, highlighting the importance of the choice toward
child quality in the process of evolution of human capital through history.
However, the literature on the deeply-rooted determinants of development has been greatly developed in the last decade. Hall and Jones (1999) demonstrated the importance of social infrastructure, a composite measure of law of rule and other institutional measures, which was then followed by Glaeser et al. (2004). It is interesting to note that Glaeser’s paper highlights the role of human capital as a more significant source of growth than institutions but does not show any causal relationship between institutions and human capital. Rodrick et al. (2004) showed evidence for the supremacy of institutions related to geography and integration as determinants of economic development. However, Olsson and Hibbs Jr. (2005) showed the strong influence of geographical and biogeographical factors in determining the current level of development. In related literature on institutions, Sokoloff and Engerman (2000) and Acemoglu et al. (2005) have stressed the role of colonialism, while the effects of ethnolinguistic fractionalization were examined by Easterly and Levine (1997) and Alesina et al. (2003).5 Moreover, the historical impact of sociocultural factors has been
highlighted by Barro and McCleary (2003), Tabellini (2008), and Guiso et al. (2009).
5 The influence of genetic diversity on ethnolinguistic fractionalization has been studied by Ahlerup and
3
Ashraf and Galor’s (2013a) work is probably one of the most influential recent papers in the field of economic development.6 Their paper reports a significant relationship
between genetic diversity determined ancestrally and economic development in the present. The paper illustrates the relationship between genetic diversity and development through the positive and decreasing effect of genetic diversity on technology and a negative effect of genetic diversity on output representing inefficiency in production. The hump-shaped empirical relationship exposed by the authors builds on two opposite effects of genetic diversity. First, an increase in diversity enhances production possibilities because a wider spectrum of traits is more likely to contain those that are complementary to the advancement of superior technologies. In fact, some competition for survival, as natural selection explains, also increases adaptability and improves the society’s ability to successfully introduce new and better technologies. However, after a certain level of genetic diversity, further rise would increase the scope for disarray and mistrust, increasing the probability of conflict. Recently, Kodila-Tedika and Asongu (2016) obtained a negative effect of Genetic Distance on an index of human capital. In robustness analysis these authors also show an overall conditional negative relationship with genetic diversity. This would imply that more genetic diversity would undoubtfully lead to less human capital outcomes. In our specifications, we do not confirm this result.
The aim of our paper is to propose an alternative channel through which genetic diversity can influence development: human capital. In fact, a wider variety of traits enhances the capacity to accumulate different types of skills; also after a certain level of genetic diversity the cost to accumulate knowledge increases due, e.g., to the adaptation of curricula and school routines to serve special needs and diverse cultural backgrounds and the possibility of conflicts between groups in the school context. The relationship between human capital and genetic diversity will emerge from the interplay of those opposing forces. Our paper exhaustively describes the empirical relationship between several measures of human capital and genetic diversity and tests its robustness in a cross-section of countries. To that end and to avoid bias associated with the choice of controls, which might be interpreted as pursuing significant effects, we strictly follow the specifications in Ashraf and Galor (2013a).
6 The paper was a lead article in the American Economic Review and was the Science Editor’s Choice in
4
In Section 2 we review the literature that relates genetic features and particularly genetic diversity with human capital. In Section 3 we devise a simple model in which the idea of the relationship between genetic diversity and human capital is presented. In Section 4 we present the main empirical results, subject to a number of extensions and robustness tests. Section 5 concludes.
2
Genetic Diversity and Human Capital: A Literature
Review
The influence of genetic traits on school achievement has been discussed in the psychology and medicine sciences. The behavioural sciences have emerged from an era of strict environmental explanations for differences in behaviour to a more balanced view that recognizes the importance of nature (genetics) as well as nurture (environment). On the evaluation of the relative strength of nature and nurture in school achievements, Petril et al. (2004) presented evidence on intraclass correlations, which reflected considerable genetic influence at each age and modest shared environmental influence within and across ages. Plomin and Craig (2001) support that general cognitive ability, a key factor in learning and memory, is among the most inheritable of behavioural traits. General cognitive ability is partially determined by a network of genes. Thus, the authors argue that multivariate genetic research contradicts the idea that genes work on specific cognitive processes, but are instead complementary in forming the general cognitive ability. Hill et al. (2014) showed that differences in general cognitive ability (intelligence) account for approximately half of the variation in any large battery of cognitive tests and are predictive of important life events including health. According to the same authors, genome-wide analyses of common single-nucleotide polymorphisms (SNP) indicate that they jointly tag between a quarter and a half of the variance in intelligence. However, no single polymorphism has been reliably associated with variation in intelligence. It remains possible that these many small effects might be aggregated in networks of functionally linked genes. Rietveld et al. (2013) showed three (highly-) statistically significant SNPs in explaining differences in schooling A linear polygenic score from all measured SNPs accounts for near 2% of the variance, meaning a modest effect of near 1 month per allele. De Neve et al. (2013) discovered that the leadership tendency may be associated with an SNP residing on a neuronal acetylcholine receptor gene (CHRNB3).
5
Shin et al. (2014) showed significant differences on scores obtained on the Korean version of modified Mini-Mental State Examination between heterozygotes and homozygotes participants (regarding the presence of the apolipoprotein polymorphism), effects that vary across ages and levels of education. As human capital is a complex concept consisting of different skills that shape human abilities, this reinforces the argument toward complementarity of genetic traits in an overall (and maybe non-linear) influence on human capital.
Although the discussion of the relative quantitative effect of genetics on intelligence and school achievements will certainly continue in the genetic-related fields, there is now some evidence of the (positive) influence of a network of genetic traits on defining the human ability to learn. Additionally, genetic influence on achievements may not be independent of social background as Tucker-Drob and Harden (2012) had shown. However, the exploration of non-linear effects of heterozygosity (genetic diversity) on school achievements at the micro-level is clearly overlooked, as the only thinly related study is that of Shin et al. (2014), already mentioned.
Despite the inexistence of much evidence of a negative effect of genetic diversity in the schooling outcomes, Kodila-Tedika and Asongu (2016) obtained such a negative effect of Genetic Distance on an index of human capital.7 Below we outline evidence of
the (negative) effects of genetic diversity in school outcomes. For example, Adodo and Agbayewa (2011) show that homogeneous ability level grouping is superior for promoting students’ learning outcomes. Carter (2003) describes the effects of “black” cultural capital in minority students’ outcomes. Thus, greater group diversity has a negative effect in schooling outcomes. Does this group diversity include genetic diversity? One may argue that the cultural differences between ethnically diverse groups are due more to nurture than to nature. Some argue, however, that cultural behaviour may also have genetic roots (see e.g., Pyysiäinen and Hauser, 2010 who argue that religion may have genetic roots). Some genetic-rooted learning disorders that imply costs to be overcome also have quite different prevalence rates among different ethnic groups. Examples are autism, attention deficit and hyperactivity syndrome, and handedness (see e.g. Korioth, 2014, Akinbami et al., 2011; Johnston et al., 2009 and McManus, 2009). Another good example is violence as a consequence of genetic diversity. In fact, Ferguson
7 In fact, in robustness analysis these authors also show an overall conditional negative relationship with
6
and Beaver (2009) stressed that violence is a product of evolution and identified a number of polymorphisms associated with violence. Genetically diverse societies are also the adequate environment to trigger the natural selection predisposition to violence. It seems that the way to address the difficulties in learning in diverse genetic environments has been to increase the efforts of educators to compensate for the additional costs of education imposed by diversity (see e.g. Terry and Irving, 2010 and Ponciano and Shabazian, 2012).
3
Genetic Diversity and Human Capital: A Simple Model
Consider an illustrative model of an economy in which the supplied stock of human capital depends on family h and on inherited general cognitive ability ( , )F xi , a set of complementary genetic traits (where 0 1 is the degree of genetic diversity) that shape abilities (x ) to read and write, logical and calculus skills, creativity, ability to work i in group, or to lead. General cognitive ability is specified as:
( , ) , with 0 1,and 0 0 i F x
x
i
(1)where ( , ) 0F xi is an increasing concave function F( ) 0; 2F( )2 0
that
guarantees the complementarity between the different traits in shaping the general cognitive ability. While α assures the concavity of F, θ governs the complementarity between the different genetic traits xi. The stock of human capital can be written as:
0 i .
H h x
(2)The family decides consumption, c, and human capital effort, h, in order to maximize a logarithmic utility as U h c( , )log h( )log c( ) subject to a resource constraint
( )
c
p c p h , where y is the family income.y 8 The family cannot influence the
genetically-inherited general cognitive ability, but decides its own investment in education given the general cognitive ability F. The price of education p ( ) 0 is an
8 The introduction of human capital in the utility function highlights the quantity-quality trade-off and is
present in economic growth literature (see e.g. Becker et al., 1990 and Clark, 2005). The intuition is that the family gains satisfaction from the offspring human capital. For simplification, the family effort on human capital is directly converted into useful skills.
7
increasing non-concave function of genetic diversity
2 2 ( ) ( ) 0; 0 p p . This
feature of the model incorporates the idea according to which increasing genetic diversity in the school environment implies diverse genetically-rooted behaviours (e.g. violent behaviours) and an increased probability of having at least one element with learning disabilities. Those features of increased diverse school environments represent a cost of learning associated with adaptation of curricula and routines to people coming from different origins, special education services targeting children with special needs, and policing services to deter potential violence in schools. As is natural, the properties of
( )
p guarantee that these types of learning costs are increasing more than proportionally to the degree of genetic diversity. This means e.g. that the costs of increasing genetic diversity from a relatively homogeneous situation are quite low. Although the family does not control genetic diversity, it becomes aware of the cost of education associated with it. First-order conditions, after solving in order to h, yields:
. (1 ) ( ) y h p (3)
Substituting equation 3 into (2) yields:
0 . (1 ) ( ) i y H x p
(4)Interestingly, this simple model encompasses important features linking human capital and genetic diversity described above. First, it predicts an influence of family income on average human capital, which is highlighted by all the human capital theory (see e.g. Acemoglu, 2009: Ch. 10). Taken broadly, y can be taken as the family endowments and can therefore be interpreted as including also parents’ education. Second, it includes an inherited composite measure of complementary genetic traits, generally defined as general cognitive ability. Third, it highlights the costs of great genetic diversity to education. We now wish to show that equation (4), representing the average supply of human capital, is such that it has a maximum for a level of genetic diversity 0 1. The first-order condition for this maximization problem yields:
0 ( ) 1 0. ( ) i i x p p x
(5)8
Without loss of generality, we assume that each trait has equal contribution to the general cognitive ability and thus xi . Using this generalization and multiplying equation (5) x by 𝜔 > 0 the first-order condition is simplified to:
( ) 0 ( ) p p , (6)
which implies that 0 ( ) 1
( ) p p
, meaning that the percentage variation of the price due to a percentage variation in genetic diversity must be equal to 0 1.
Second-order condition to a maximum is the following:
2 2 2 ( ) ( ) ( ) ( ) , ( ) ( ) p p p p p p (7)
which is always negative at the extremum given by (5), given the properties of p( ) .9
Note that if p is not a function of , then the negative effect of genetic diversity in human capital will be nullified. Also, if the maximum value of the function is obtained for an that is above any empirically reasonable value, then the predicted relationship will be a positive one between genetic diversity and human capital.
In the first regressions of the empirical part of the paper we find the value of 0.7
as the proportion of genetic diversity that maximizes human capital, meaning that above this value, more genetic diversity will deter human capital. We will give some examples of functional forms for p( ) for which a reasonable value of the share of the general cognitive ability may replicate empirically the proportion of genetic diversity that maximizes human capital.
9 This is a model for the supply of human capital, as empirical evidence is based on variables mostly linked
with the supply side of the market for human capital. If one plugs y from the model of Ashraf and Galor (2013a) into equation (4) the same hump-shaped relationship between human capital and genetic diversity appears given certain conditions. If alternatively to what Ashraf and Galor (2013a) did, we modelled y dependent on human capital, we may also consider that genetic diversity contributes to decrease the productivity of human capital, in an efficiency argument similar to the one used in their article. So our model highlights an alternative channel between genetic diversity and development, through human capital. More generally, any model with an -increasing concave general cognitive ability F( , ) 0 xi and an -increasing non-concave p( ) 0 would yield a maximum for fulfilling (.) / (.).
(.) / (.) F F p p
9 Example 1 Consider that ( ) 1
1 p . Equation (6) yields 1 1 , which is between 0.5 and 1. With 0.4286, genetic diversity that maximizes human capital is
0.7
.
Example 2 Consider thatp( ) 1 . Equation (6) yields 1 , which yields 0.7 for 0.4117.
Example 3 Consider that ( )p e. Equation (6) yields , which yields 0.7
for 0.7.
If the beneficial effects of genetic diversity dominate at lower levels of diversity and the detrimental effects prevail at higher ones (i.e., if there are diminishing marginal returns to both diversity and homogeneity), the theory would predict a hump-shaped effect of genetic diversity on human capital throughout the development process. However, if the predicted value for the theory would be lower than the observed maximum for genetic diversity, then a match between theory and data is obtained for always positive influence of genetic diversity in human capital. In the empirical findings, we will see that the most robust results will point to this last case, i.e., an ever positive effect of genetic diversity in human capital.
4
Empirical Findings
4.1 Data and Sources
In this section we describe the variables and data sources for the empirical part of this work. Our dependent variable is human capital, for which we use two different measures – enrolments and scores on international tests. These alternative measures of human capital were taken from Cohen and Soto (2007) for measures of quantity of human capital and from Hanushek and Woessmann (2012) for measures of the quality of human capital.10 In fact, the quality of human capital has been argued to be crucial in explaining
countries’ different performances (see e.g. Hanushek and Woessmann, 2015).
Explanatory variables are from the database from Ashraf and Galor (2013a) who include variables that measure genetic diversity, as adjusted to migratory movements and
10 A previous working-paper version of this work, which used very different specifications, also included
different measures of human capital. In that previous and preliminary work, the unconditional hump-shaped relationship between genetic diversity and human capital was confirmed for many different proxies for quality and quantity of human capital.
10
ancestry adjusted. For our benchmark analysis we use the ancestry adjusted (to 2000) predicted genetic diversity. As genetic diversity measured by this variable has been adjusted to account for the 2000 composition of populations (that can trace their ancestral origins to different source countries in the year 1500) this is the appropriate measure to relate to the distribution of human capital in the world after the year 2000. Other explanatory variables will be introduced as controls later on.11
The countries included in our cross-section analysis depend on the availability of human capital data and human capital variables.12
Table 1 summarizes two dependent variables used: school, which measures quantity of schooling (years of schooling or attainment) and cogn to measure quality of schooling, available as tests scores. Table 2 reports descriptive statistics for the dependent variables. The explanatory variables used (predicted genetic diversity ancestry adjusted and mobility index-predicted genetic diversity ancestry adjusted) are pdiv_aa and pdivhmi_aa, respectively, and measure, as explained above, genetic diversity for 2000.
Table 1: Human Capital Variables Variables for Human Capital
(HC) Name Measure (years and source)
Years of schooling of population+25
sch25 1960-2010 (Ashraf and Galor, 2013a) Average test score in math
and science
cogn primary through secondary, all years 1964-2003 (Hanushek and Woessmann, 2012) Table 2: Descriptive Statistics
Variable Mean Std. Dev. Min Max
(a) pdiv_aa .7267 .0269 .6279 .7743
(b) pdivhmi_aa .7229 .02904 .6178 .7826
(1) sch25 4.8623 2.8126 .4089 10.8622
(2) cogn 4.5429 .5709 3.0893 5.3376
Notes: (a) Predicted genetic diversity ancestry adjusted; (b) Mobility index-predicted genetic diversity ancestry adjusted. Ancestry adjustment is made to make variables consistent to time-measurement in 2000. Details are given in the Appendix F of Ashraf and Galor (2013a).; (1) Years of schooling; (2) Average test score in math and science, primary through end of secondary school, all years (scaled to PISA scale divided by 100)
4.2 Replication of the Ashraf and Galor (2013a) result for Schooling
In this section we document the fact that there is a hump-shaped relationship between different variables linked with human capital (quantity, quality) and the genetic diversity
11 Which has also been done by Ashraf and Galor (2013a) in their Section V.
12 The largest list of countries used (123) is detailed in the Appendix. Detailed lists of countries for each
11
of countries. We estimate OLS regressions using exactly the same specifications that Ashraf and Galor (2013a) did in their Tables 5 and 6. These regressions through different dependent variables predict surprisingly similar maximum values for the genetic diversity above which human capital tends to decrease (around 0.70), which is slightly below the median value for these variables (see Table 2). This means that there is a quite realistic value for genetic diversity below which human capital increases with diversity and above which it decreases. Moreover, this result is very similar to that obtained by Ashraf and Galor (2013a: Tables 1 and 6) when testing the relationship between genetic diversity and development.
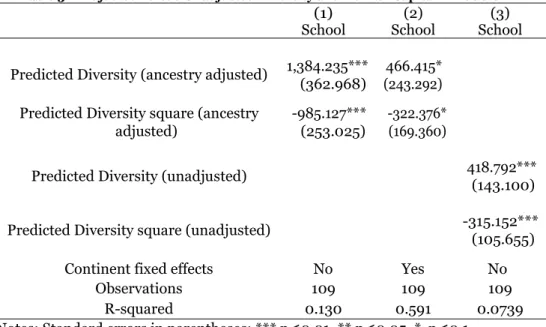
Table 3 — Adjusted versus Unadjusted Diversity and Human Capital in 2000 CE
(1)
School School (2) School (3) Predicted Diversity (ancestry adjusted) 1,384.235*** (362.968) (243.292) 466.415*
Predicted Diversity square (ancestry adjusted)
-985.127*** (253.025)
-322.376* (169.360)
Predicted Diversity (unadjusted) 418.792*** (143.100) Predicted Diversity square (unadjusted) -315.152*** (105.655)
Continent fixed effects No Yes No
Observations 109 109 109
R-squared 0.130 0.591 0.0739
Notes: Standard errors in parentheses; *** p<0.01, ** p<0.05, * p<0.1
According to our estimates in Table 3 (column 1), there is a clear and (unconditional) hump-shaped relationship between genetic diversity and schooling. In fact, according to these results a 1 percentage point increase in genetic diversity for the country with least genetic diversity in the sample would be associated with an increase in schooling of around 1.37 years and the same increase for the country with highest genetic diversity would be associated with a reduction of roughly 1.51 years of school. These are sizeable quantitative effects, representing almost 1/3 of the schooling average value. Moreover, the positive effect of increased genetic diversity for lower levels is relatively lower than the negative effect of increased genetic diversity for higher levels. The effects calculated under the coefficients estimated under regressions presented in Table 3, columns 2 and 3
12
are lower, but by now tend to confirm the strength of the negative effect when compared with the positive effect of genetic diversity.
In Table 4 (replicating Table 6 in Ashraf and Galor, 2013a) we introduce the same number of controls in those regressions of Table 3 that they also did. The conclusion is that the hump-shaped relationship between genetic diversity human capital vanishes. It is worth noting the negative and significant effect of the log of population density in 1500 in determining schooling nowadays, which may indicate that the process of education cannot be rooted in the economic development of the pre-Columbian era. Given the results in Table 4, which clearly reject the hump-shaped relationship in Section 4.3, we present results of a linear relationship between genetic diversity and two important measures of quantity and quality of human capital. This is important in light of the possible interpretations of the effect of genetic diversity on different aspects of development and in particular in determining if schooling may have reinforcing effects of the costs of diversity or on the contrary, some mitigation costs may be hypothesized, which we discuss later in the paper.
Table 4—Diversity and Human Capital in 2000 CE
(1)
School School (2) School (3) Predicted diversity (ancestry adjusted) 43.472 241.739 136.664
(220.486) (239.799) (214.954) Predicted diversity square (ancestry adjusted) -25.346 -161.391 -95.209 (156.414) (169.367) (152.667) log Neolithic transition timing (ancestry adjusted) -1.008 -0.194
(0.740) (0.823) log Neolithic transition timing (unadjusted) -1.367**
(0.630)
log percentage of arable land -0.177 -0.108 0.134
(0.288) (0.339) (0.331)
log absolute latitude 0.597** 0.646** 0.412
(0.275) (0.287) (0.296)
log land suitability for agriculture 0.016 0.020 0.198
(0.267) (0.287) (0.265)
log population density in 1500 CE -0.609**
(0.242)
Optimal diversity 0.858 0.749 0.718
(3.320) (2.505) (0.706)
Continent fixed effects Yes Yes Yes
Observations 109 109 109
R-squared 0.644 0.622 0.656
13
4.3 A Linear Relationship: robustness to other controls
The results obtained so far mean that the hump-shaped relationship described in the previous section is a pattern in data that cannot be regarded as robust to other variables determining human capital, and certainly does not resemble the relationship described in Ashraf and Galor (2013a) between genetic diversity and development (population density). Does this mean that genetic diversity does not contribute to human capital as our model describes and some microevidence seem to indicate? In fact, we found some evidence of a positive (linear) relationship between predicted genetic diversity, predicted using the human mobility index. The human mobility index is the (optimal) average migratory distance from Addis Ababa but that takes into consideration the time cost of travelling through the earth surface in the absence of steam-powered transportation technologies. The optimality of the path is determined by incorporating information on natural impediments to human spatial mobility. It is worth noting that the relationship between human capital and predicted genetic diversity using the benchmark migratory distance that does not incorporate the human mobility index is also statistically significant in some specifications considered.13
Using a sample of 76 and 43 countries (for School and Cognitive as dependent variables, respectively) for which data are available for the institutional and cultural controls that are employed in the examination, Column 1 of Table 5 (which presents a linear version of the specification presented in Ashraf and Galor 2013a, Table 7, for the human capital variables as dependent variables) demonstrates that genetic diversity has a linear effect on the current levels of schooling, accounting for the set of baseline controls employed in the historical analysis, i.e., the logs of the weighted timing of the Neolithic transition, the percentage of arable land, and absolute latitude, as well as continent fixed effects. The estimated linear coefficients associated with the diversity channel is statistically significant at the 1 percent level, when dummies are not introduced (Table 5, columns (1) to (3)), but its significance decreases when dummies for OPEC countries, legal origin, and major religion shares are introduced. Thus the robustness of the influence of genetic diversity in schooling is good to the inclusion of a measure of institutional quality, as captured by the social infrastructure index of Hall and Jones (1999), but are
14
not to other institutional measures such as legal origin and religion shares. While ethnic fractionalization does not indeed confer a significant adverse effect on current levels of schooling, the linear impact of genetic diversity remains highly statistically significant (column 3). In Table 6 we analyse the effect of genetic diversity on test scores, using the same specification as in Table 5, but we have reached a positive and significant effect in only one of the specifications.
However, as established in Tables 7 and 8 (replicating Table 8 in Ashraf and Galor, 2013a, for the human capital variables), the linear positive effect of genetic diversity remains somewhat significant if the sample is restricted to (i) non-OECD economies (i.e., economies that were less attractive to migrants) in Column 2, (ii) non-Neo-European countries (i.e., excluding the U.S., Canada, Australia, and New Zealand) in Column 3, (iii) non-Latin American countries in Column 4, (iv) non-Sub-Saharan African countries in Column 5, and (v) countries whose indigenous population is greater than 97 percent of the entire population (i.e., under conditions that virtually eliminate the role of migration in contributing to diversity over the last 500 years) in Column 6. The robustness of the linear effect of genetic diversity on Cognitive tests on these robustness analyses is particularly impressive. Quantitatively, an increase of 0.1 in genetic diversity would increase test scores from 0.9 to 2.8 points, quite a significant result given the usual values of the test scores (which oscillate from 3.08 to 5.34). On the contrary, the robustness tests on the relationship between genetic diversity and schooling show that this relationship is robust only to the non-Sub-Saharan African countries in Column 5.
These results contradict those in Kodila-Tedika and Asongu (2016) and Asongu and Kodila-Tedika (2017). In fact, contrary to the results obtained by those authors, a positive influence of genetic diversity on human capital outcomes implies that if immigration policies that contribute to increase genetic diversities have a significant effect and if this relationship will be maintained for the centuries that come, this result should be regarded as positive.
15
Table 5—Diversity and Other Determinants of Quantity of Human Capital in 2000 CE
(1) (2) (3) (4) (5) (6)
Variables Dependent Variable: School in 2000 CE
Mobility index predicted 23.305** 24.322*** 24.197*** 14.545* 14.269 7.697 genetic diversity (9.705) (7.462) (6.455) (8.252) (8.841) (7.466) log [Neolithic transition -1.541** -0.550 -0.510 0.879 1.078 0.457 timing] (0.642) (0.672) (0.647) (0.961) (0.948) (0.903) log [% of arable land] -0.264 -0.126 -0.131 -0.206 -0.166 -0.188
(0.195) (0.163) (0.186) (0.195) (0.220) (0.204) log [Absolute latitude] 0.464 0.412** 0.402* 0.423 0.086 -0.121
(0.386) (0.180) (0.244) (0.274) (0.363) (0.297) Social infrastructure 4.535*** 4.553*** 4.483*** 4.483*** 3.704*** (1.181) (0.971) (0.887) (1.363) (1.315) Ethnic fractionalization -0.127 0.016 0.232 0.491 (0.787) (0.825) (1.032) (0.886) % population at risk of 0.426 0.496 contracting malaria (1.382) (1.166) % population living in -1.413 -1.371** tropical zones (0.925) (0.600) Mean distance to -1.066 -0.973 nearest waterway (0.860) (0.900)
OPEC fixed effects No No No No Yes Yes
Legal origin fixed effects No No No Yes Yes Yes
Major religion shares No No No Yes Yes Yes
Observations 76 76 76 76 76 76
Adj R-squared 0.656 0.750 0.746 0.841 0.855 0.875
Note: Level of Significance: *** for p-value<0.01; **for p-value<0.05;* for p-value<0.1. Bootstrap standard errors, accounting for the use of generated regressors, are reported in parentheses. All regressions include continent dummies.
16
Table 6—Diversity and Other Determinants of Quality of Human Capital in 2000 CE
(1) (2) (3) (4) (5) (6)
Variables Dependent Variable: Cognitive
Mobility index predicted 6.074 7.278 7.913 13.883* 16.304 18.589 genetic diversity (5.689) (6.741) (5.921) (8.090) (10.378) (14.748) log [Neolithic transition -0.710** -0.523 -0.418 -0.305 -0.281 -0.247
timing] (0.349) (0.330) (0.351) (0.433) (0.451) (0.904)
log [% of arable land] 0.125 0.159 0.176* 0.160 0.230 0.245
(0.085) (0.128) (0.098) (0.157) (0.155) (0.271) log [Absolute latitude] 0.043 -0.007 -0.094 -0.215 -0.609 -0.622
(0.231) (0.260) (0.178) (0.241) (1.063) (0.929) Social infrastructure 0.820*** 0.942*** 1.579* 2.247** 2.344 (0.275) (0.324) (0.904) (0.902) (1.637) Ethnic fractionalization -0.546* -0.360 -0.362 -0.357 (0.316) (0.400) (0.564) (0.804) % population at risk of 0.845 0.759 contracting malaria (1.496) (1.491) % population living in -1.044 -1.040 tropical zones (1.081) (2.039) Mean distance to 0.165 0.145 nearest waterway (0.899) (0.999) % population of -0.404 european descent (1.551)
OPEC fixed effects No No No No Yes Yes
Legal origin fixed effects No No No Yes Yes Yes
Major religion shares No No No Yes Yes Yes
Observations 43 43 43 43 43 43
Adj R-squared 0.557 0.630 0.652 0.683 0.766 0.759
Note: Level of Significance: *** for p-value<0.01; **for p-value<0.05;* for p-value<0.1. Bootstrap standard errors, accounting for the use of generated regressors, are reported in parentheses. All regressions include continent dummies.
Table 7: Addressing Endogenous Post-1500 Migrations and Quantity of Human Capital Full sample Omit OECD countries
Omit Neo-European countries Omit Latin American countries Omit Sub-Saharan African countries Countries with population at least 97 % indigenous
17
Note: Level of Significance: *** for p-value<0.01; **for p-value<0.05;* for p-value<0.1. Bootstrap standard errors, accounting for the use of generated regressors, are reported in parentheses. All regressions include continent dummies.
Table 8: Addressing Endogenous Post-1500 Migrations and Quality of Human Capital
Full sample Omit OECD countries Omit Neo-European Countries
Omit Latin American countries Omit Sub-Saharan African countries (1) (2) (3) (4) (5)
Variable Dependent Variable: Cognitive
Mobility index predicted 16.304*** 9.483* 15.194*** 28.124*** 16.495***
genetic diversity (4.535) (4.365) (4.280) (7.675) (4.585)
log [Neolithic transition -0.281 0.256 -0.291 -0.632** -0.422
timing] (0.247) (0.261) (0.233) (0.239) (0.277)
log [% of arable land] 0.230** 0.195** 0.140 0.259** 0.105
(0.099) (0.067) (0.104) (0.107) (0.106)
log [Absolute latitude] -0.609*** -0.887*** -0.611*** -0.800*** -0.588***
(0.199) (0.107) (0.172) (0.203) (0.194) Social infrastructure 2.247*** 1.822** 1.782*** 1.446** 1.845*** (0.386) (0.516) (0.588) (0.628) (0.401) Ethnic fractionalization -0.362 -1.386*** -0.312 -0.516 -0.178 (0.361) (0.293) (0.302) (0.394) (0.326) % population at risk of 0.845 -0.238 1.031* -0.446 1.707** contracting malaria (0.587) (0.605) (0.500) (0.768) (0.658) % population living in -1.044** -0.731** -1.054*** 0.165 -1.403*** tropical zones (0.458) (0.261) (0.363) (0.683) (0.325) Mean distance to 0.165 -0.572 -0.851* 0.462 0.313 nearest waterway (0.350) (0.508) (0.409) (0.362) (0.266) Observations 43 25 41 36 37 R-squared 0.883 0.982 0.922 0.918 0.915
Note: Level of Significance: *** for p-value<0.01; **for p-value<0.05;* for p-value<0.1. Bootstrap standard errors, accounting for the use of generated regressors, are reported in parentheses. All regressions include continent dummies.
4.4 Discussion
(1) (2) (3) (4) (5) (6)
Variables Dependent Variable: School
Mobility index predicted 14.269** 3.371 7.373 2.754 21.097** 16.869 genetic diversity (6.851) (7.116) (6.333) (11.212) (8.141) (13.558) log [Neolithic transition timing] 1.078 1.419* 0.894 0.512 -0.330 -1.627
(0.748) (0.818) (0.700) (0.811) (1.096) (1.089) log [% of arable land] -0.166 -0.375** -0.320** -0.223 -0.348* -0.523
(0.182) (0.173) (0.144) (0.188) (0.200) (0.164)
log [Absolute latitude] 0.086 -0.066 -0.069 -0.118 -0.047 -1.081
(0.252) (0.278) (0.251) (0.277) (0.332) (0.312) Social infrastructure 4.483*** 1.981* 2.009** 1.935* 3.114*** 3.770 (0.938) (0.995) (0.871) (1.018) (1.039) (1.724) Ethnic fractionalization 0.232 -0.285 0.110 0.406 0.853 -3.167 (0.788) (0.891) (0.759) (0.948) (1.057) (0.754) % population at risk of 0.426 0.039 0.169 -0.229 -4.765*** 3.836 contracting malaria (0.882) (1.064) (0.919) (1.183) (1.714) (1.397) % population living in -1.413*** -1.450*** -1.456*** -1.252** -2.219*** -2.781 tropical zones (0.525) (0.517) (0.486) (0.578) (0.641) (0.589) Mean distance to -1.066* -1.572*** -1.811*** -1.569** -1.754*** -2.987* nearest waterway (0.547) (0.532) (0.527) (0.596) (0.620) (0.458) Observations 76 58 74 58 51 22 R-squared 0.895 0.833 0.901 0.941 0.924 0.999
18
In light of the results that relate genetic diversity to proxies of current economic development in a hump-shaped manner (e.g. Ashraf et al., 2014, using night time light intensity, Cardella et al., 2018 on financial development; and Sequeira and Santos, 2017 on the relationship with technological adoption in 1500), ours is one of the first to predict (at most) a positive association between genetic diversity and one of the dimensions of development, in this case schooling. This means that schooling may have mitigation effects on the costs of genetic diversity that were mentioned above. In particular, the cost of diversity may be diminished because more interpersonal conflict led by genetic diversity may be mitigated by education (Arbatli et al., 2018: Table 11), the cost of diversity may be mitigated because of the effect of genetic diversity in fractionalization, and the adverse effect of fractionalization on development will be mitigated by education (Ashraf and Galor, 2013b); the cost of genetic diversity linked with the emergence of autocratic regimes highlighted in Galor and Klemp (2017) may be mitigated by the positive effect education may have on democracies.14 As mentioned by Ashraf and Galor
(2017: 12), “the costs of diversity can be mitigated by modern education systems that promote social cohesiveness.” Finally, the positive effect of genetic diversity in development tends to be greater in more educated societies, as mentioned in Ashraf and Galor (2017: 12).
5
Conclusion
We investigate the relationship between human capital and the ancestry adjusted predicted genetic diversity of populations. The paper highlights a new channel through which genetic diversity can affect development: human capital. We have devised a simple model in which human capital benefits from an increasing (inherited) variety of genetic traits (heterozygosity), which enhance learning abilities. Additionally, a cost of human capital that depends increasingly on genetic diversity is essential to depict a negative or decreasing relationship between genetic diversity and the human capital supply. This cost represents the additional effort economic agents have to support in order to overcome the negative influence of very diverse genetic backgrounds on the school environment. Despite its simplicity, the model encompasses the interplay between nature and nurture
14 The effect of education on the emergence of democracies (or autocracies) is greatly debated in the
literature, as well as the effect of democracy on development (see e.g., Sequeira, 2017 and Tavares and Wacziarg, 2001).
19
in the human capital supply of the economy, the presence of inherited family genetic traits, and the costs of diversity on learning environment.
We based our empirical study on a database of human capital variables coming from Cohen and Soto (2007) for measures of quantity of human capital, and from Hanushek and Woessmann (2012) for measures of quality of human capital, and then merged it with the database of genetic diversity from Ashraf and Galor (2013a). We found an empirical fact describing a hump-shaped relationship between human capital and genetic diversity, common to different measures of quantity and quality of human capital. However, when submitting this relationship to the presence of different controls (the same controls used by Ashraf and Galor, 2013a, Tables 6, 7, and 8) the hump-shaped relationship between genetic diversity and human capital vanishes. This means that although we found an empirical fact with a relationship between genetic diversity and human capital, genetic diversity cannot be regarded as a deeply-rooted determinant of the present levels of human capital in a hump-shaped manner as described in Ashraf and Galor (2013a).15
Then, we analyse a conditional linear relationship between human capital and genetic diversity. In most specifications, in which more controls are introduced, the genetic diversity coefficients appear to be positive and statistically significant. However, in some other specifications we obtained a statistically nonsignificant positive sign. Thus, if there is a (causal) relationship between human capital and genetic diversity, it is a positive influence of diversity in human capital. This establishes that this relationship is subject to the number and type of controls included in the regressions. One of several policy implications of our possible positive influence of genetic diversity on human capital outcomes is that if immigration and refugees policies that help to increase genetic diversity of countries would have a significant effect, it should be a positive (and not a negative) one! Moreover, education may have a number of mitigation effects of the negative effects of genetic diversity, a role that may be subject to further research, namely in more micro or experimental studies.
When comparing our empirical evidence with the model, we must conclude that the positive channel of general cognitive ability in shaping human capital must be much stronger than the negative effect of diversity.
15 In Sequeira and Santos (2017) we found that genetic diversity can be regarded as a determinant of
technological adoption in 1500 in a hump-shaped manner, tending to confirm a positive channel through technological progress to development.
20
References
[1] Acemoglu, D., S. Johnson, and J. A. Robinson (2005). Institutions as a Fundamental Cause of Long-Run Growth. Handbook of Economic Growth, Vol IA., ed. Philippe Aghion and Steven N. Durlauf. Amsterdam, The Netherlands: Elsevier North-Holland.
[2] Acemoglu, D. (2009). Introduction to Modern Economic Growth. Princeton University Press.
[3] Adodo, S. and J. Agbayewa (2011). Effect of homogenous and heterogeneous ability grouping class teaching on students interest, attitude and achievement in integrated science. International Journal of Psychology and Counselling, 3(3): 48-54.
[4] Ahlerup, P. and O. Olsson (2012). The roots of ethnic diversity. Journal of Economic Growth, 17(2): 71-102.
[5] Alesina, A., A. Devleeschauwer, W. Easterly, S. Kurlat, and R. Wacziarg (2003). Fractionalization. Journal of Economic Growth, 8 (2): 155-194.
[6] Akinbami, L., X. Liu, P. Pastor, and C. Reuben (2011). Attention Deficit Hyperactivity Disorder Among Children Aged 517 Years in the United States, 19982009. NCHS Data Brief, 70, August.
[7] Arbatli, C., H. Q. Ashraf, O. Galor, and M. Klemp (2018). Diversity and Conflict. Available at: http://web.econ.ku.dk/klemp/doc/Arbatli-Ashraf-Galor-Klemp_Diversity-and-Conflict.pdf. Accessed 19 June 2018.
[8] Ashraf, Q. and O. Galor (2013a). The Out of Africa Hypothesis, Human Genetic Diversity, and Comparative Economic Development. American Economic Review, 103 (1): 1-46.
[9] Ashraf, Q. and Galor, O. (2013b). Genetic Diversity and the Origins of Cultural Fragmentation. The American Economic Review, 103(3): 528-533.
[16] Ashraf, Q., Galor, O., and Klemp, M. (2014). The out of Africa hypothesis of comparative development reflected by night time light intensity. Working Paper. Brown University. Department of Economics 2014.
[17] Ashraf, Q. and O. Galor (2017). The Macrogenoeconomics of Comparative Development. NBER Working-Paper 23199.
[18] Asongu, S. and O. Kodila-Tedika (2017). Is Poverty in the African DNA (Gene)? South African Journal of Economics, 85: 533–552. 10.1111/saje.12165.
21
[10] Barro, R. J. and R. M. McCleary (2003). Religion and Economic Growth across Countries. American Sociological Review, 68 (5): 760-781.
[11] Becker, G., K. Murphy, and R. Tamura (1990). Human Capital, Fertility, and Economic Growth, Journal of Political Economy, 98, issue 5, p. S12-37.
[12] Cardella, E., I. Kalcheva, and D. Shang (2018). Financial Markets and Genetic Variation. Journal of International Financial Markets, Institutions and Money 52: 64-89.
[13] Carter, P. (2003). “Black” Cultural Capital, Status Positioning, and Schooling Conflicts for Low Income African American Youth. Social Problems. 50(1): 136-155.
[14] Clark, G. (2005). Human Capital, Fertility, and the Industrial Revolution. Journal of the European Economic Association, 3(2/3), 505-515.
[15] Cohen, D. and M. Soto (2007). Growth and Human Capital: Good Data, Good Results. Journal of Economic Growth, 12: 51-76.
[16] De Neve, J-E, S. Mikkaylov, C. Dawes, N. Cristakis, and J. Fowler (2013). Born to lead? A twin design and genetic association study of leadership role occupancy. The Leadership Quarterly 24: 45-60.
[17] Easterly, W. and R. Levine (1997). Africa’s Growth Tragedy: Policies and Ethnic Divisions. Quarterly Journal of Economics, 112 (4): 1203-1250.
[18] Ferguson, C. and K. Beaver (2009). Natural born killers: The genetic origins of extreme violence. Aggression and Violent Behaviour, 14: 285-294.
[19] Galor, O. and M. Klemp (2014). The Biocultural Origins of Human Capital Formation. NBER Working Paper No. 20474.
[20] Galor, O. and Klemp, M. (2017). Roots of Autocracy. NBER Working-Paper 23301.
[21] Glaeser, E. L., R. La Porta, F. Lopez-de-Silanes, and A. Shleifer (2004). Do Institutions Cause Growth? Journal of Economic Growth, 9 (3): 271-303.
[19] Guiso, L., P. Sapienza, and L. Zingales (2009). Cultural Biases in Economic Exchange? Quarterly Journal of Economics, 124 (3): 1095-1131.
[20] Hall, R. and C. I. Jones (1999). Why Do Some Countries Produce So Much More Output Per Worker Than Others? Quarterly Journal of Economics, 114 (1): 83-116.
[21] Hanushek, E. and L. Woessmann (2011). The Economics of International Differences in Educational Achievement (chapter 2). Handbook of the Economics of Education, 3: 89-200.
22
[22] Hanushek, E. and L. Woessmann (2012). Do Better Schools Lead to More Growth? Cognitive Skills, Economic Outcomes, and Causation. Journal of Economic Growth, 17 (4): 267-321.
[23] Hanushek, E. and L. Woessmann (2015). The Knowledge Capital of Nations. CESifo Book Series, The MIT Press.
[24] Hill, W., G Davies, L. Lagemaat, A Christoforou, R. Marioni, C. Fernandes, D. Liewald, M. Croning, A. Payton, L. Craig, L. Whalley, M. Horan, W. Ollier, N. Hansell, M. Wright, N. Martin, G. Montgomery, V. Steen, S. Hellard, T. Espeseth, A. Lundervold, I. Reinvang, J. Starr, N. Pendleton, S. Grant, T. Bates, and I. Deary- (2014). Human cognitive ability is influenced by genetic variation in components of postsynaptic signalling complexes assembled by NMDA receptors and MAGUK proteins. Translational Psychiatry, 4: 1-8.
[25] Kodila-Tedika, O. and S. Asongu (2016). Genetic distance and cognitive human capital: a cross-national investigation. Journal of Bioeconomics, 18(1): 33-51. [26] Korioth, T. (2014). Autism prevalence now 1 in 68, varies by sex, race/ethnic group. AAP News - breaking news, March 27.
[27] Johnston, D. and M. Nicholls, M. Shah, and M. Shields (2009). Nature’s experiment? Handedness and Early Childhood Development. Demography, 46(2): 281-301.
[28] McManus, I. (2009). The history and geography of human handedness. Language Lateralization and Psychosis, ed. Iris E. C. Sommer and Ren S. Kahn., Cambridge University Press.
[29] Olsson, O., D. Hibbs Jr.(2005). Biogeography and long-run economic development. European Economic Review, 49: 909-938.
[30] Petril, S., P. Lipton, J. Hewitt, R. Plomin, S. Cherny, R. Corley, and J. DeFries (2004). Genetic and Environmental Contributions to General Cognitive Ability Through the First 16 Years of Life. Developmental Psychology, 40(5): 805-812.
[31] Ponciano, L. and A. Shabazian (2012). Interculturalism: Addressing Diversity in Early Childhood. Dimensions of Early Childhood, 40(1): 23-29.
[29] Plomin, R. and I. Craig (2001). Genetics, Environment and Cognitive Abilities: review and work in progress towards a genome scan for quantitative trait locus associations using DNA pooling. British Journal of Psychiatry, 178: s41-s48.
[30] Pyysiäinen, I. and M. Hauser (2010). The origins of religion: evolved adaptation or by-product? Trends in Cognitive Sciences, 14(3): 104-109.
[31] Rietveld, C., Sarah E. Medland, Jaime Derringer, Jian Yang, Tnu Esko, Nicolas W. Mar-tin, Harm-Jan Westra, Konstantin Shakhbazov, Abdel Abdellaoui, Arpana Agrawal, Eva Albrecht, Behrooz Z. Alizadeh, Najaf Amin, John Barnard, Sebastian E. Baumeister, Kelly S. Benke, Lawrence F. Bielak, Jeffrey A. Boatman, Patricia A.
23
Boyle, Gail Davies, Christiaan de Leeuw, Niina Eklund, Daniel S. Evans, Rudolf Ferhmann, Krista Fischer, Christian Gieger, Hkon K. Gjessing, Sara Hgg, Jennifer R. Harris, Caroline Hayward, Christina Holzapfel, Carla A. Ibrahim-Verbaas, Erik Ingelsson, Bo Jacobsson, Peter K. Joshi, Astanand Jugessur, Marika Kaakinen, Stavroula Kanoni, Juha Karjalainen, Ivana Kolcic, Kati Kristiansson, Zoltn Kutalik, Jari Lahti, Sang H. Lee, Peng Lin, Penelope Lind, Yongmei Liu, Kurt Lohman, Marisa Loitfelder, George McMahon, Pedro Mar-ques Vidal, Osorio Meirelles, Lili Milani, Ronny Myhre, Marja-Liisa Nuotio, Christopher Oldmeadow, Katja E. Petrovic, Wouter J. Peyrot, Ozren Polaek, Lydia Quaye, Eva Reinmaa, John P. Rice, Thais S. Rizzi, Helena Schmidt, Reinhold Schmidt, Albert V. Smith, Jennifer A. Smith, Toshiko Tanaka, Antonio Terracciano, Matthijs J. H. M. van der Loos, Veronique Vitart, Henry Vlzke, Jrgen Wellmann, Lei Yu, Wei Zhao, Jri Al-lik, John R. Attia, Stefania Bandinelli, Franois Bastardot, Jonathan Beauchamp, David Bennett, Klaus Berger, Laura J. Bierut, Dorret I. Boomsma, Ute Bltmann, Harry Campbell, Christopher F. Chabris, Lynn Cherkas, Mina K. Chung, Francesco Cucca, Mariza de Andrade, Philip L. De Jager, Jan-Emmanuel De Neve, Ian J. Deary, George Dedoussis, Panos Deloukas, Maria Dimitriou, Gun Eirksdttir, Martin F. Elderson, Johan G. Eriksson, David M. Evans, Jessica D. Faul, Luigi Ferrucci, Melissa E. Garcia, Henrik Grnberg, Vilmundur Gunason, Per Hall, Juliette M. Harris, Tamara B. Harris, Nicholas D. Hastie, Andrew C. Heath, Dena G. Hernandez, Wolfgang Hoffmann, Adri-aan Hofman, Rolf Holle, Elizabeth G. Holliday, Jouke-Jan Hottenga, William G. Iacono, Thomas Illig, Marjo-Riitta Jrvelin, Mika Khnen, Jaakko Kaprio, Robert M. Kirkpatrick, Matthew Kowgier, Antti Latvala, Lenore J. Launer, Debbie A. Lawlor, Terho Lehtimki, Jingmei Li, Paul Lichtenstein, Peter Lichtner, David C. Liewald, Pamela A. Madden, Pa-trik K. E. Magnusson, Tomi E. Mkinen, Marco Masala, Matt McGue, Andres Metspalu, Andreas Mielck, Michael B. Miller, Grant W. Montgomery, Sutapa Mukherjee, Dale Nyholt, Ben A. Oostra, Lyle J. Palmer, Aarno Palotie, Brenda W. J. H. Penninx, Markus Perola, Patricia A. Peyser, Martin Preisig, Katri Rikknen, Olli T. Raitakari, Anu Realo, Susan M. Ring, Samuli Ripatti, Fernando Rivadeneira, Igor Rudan, Aldo Rustichini, Veikko Salomaa, Antti-Pekka Sarin, David Schlessinger, Rodney J. Scott, Harold Snieder, Beate St Pourcain, John M. Starr, Jae Hoon Sul, Ida Surakka, Rauli Svento, Alexander Teumer, The LifeLines Cohort Study, Henning Tiemeier, Frank J. van Rooij, David R. Van Wagoner, Erkki Vartiainen, Jorma Viikari, Peter Vollen-weider, Judith M. Vonk, Grard Waeber, David R. Weir, H.-Erich Wichmann, Elisabeth Widen, Gonneke Willemsen, James F. Wilson, Alan F. Wright, Dalton Conley, George Davey-Smith, Lude Franke, Patrick J. F. Groenen, Albert Hofman, Magnus Johannesson, Sharon L. R. Kardia, Robert F. Krueger, David Laibson, Nicholas G. Martin, Michelle N. Meyer, Danielle Posthuma, A. Roy Thurik, Nicholas J. Timpson, Andr G. Uitterlin-den, Cornelia M. van Duijn, Peter M. Visscher, Daniel J. Benjamin, David Cesarini, and Philipp D. Koellinger (2013). GWAS of 126,559 Individuals Identifies Genetic Variants Associated with Educational Attainment. Science, 340 (6139): 1467-1471.
[32] Rodrik, D., A. Subramanian, and F. Trebbi (2004). Institutions Rule: The Primacy of Institutions Over Geography and Integration in Economic Development. Journal of Economic Growth, 9 (2): 131-165.
24
[33] Sequeira, T. and N. Ferraz (2009). Is Education Prejudiced by Country-Risk? Economic Record, 85 (270): 307-317.
[34] Sequeira, T. (2009). On the Relationship Between Education and Country-Risk: A New Fact. Acta Oeconomica 59 (4): 441-454.
[35] Sequeira, T. (2017). Democracy and income: taking parameter heterogeneity and cross-country dependency into account. The B.E. Journal of Macroeconomics (advances), 17(2).
[36] Sequeira, T.N. and Santos, M. (2017). Technology in 1500 and Genetic Diversity. Empirical Economics. https://doi.org/10.1007/s00181-017-1391-6
[37] Shin, M-H., S-S Kweon, J-S Choi, Y-H. Lee, H-S, Nam, K-S. Park, H. Kim, H-R. Song, B. Kim, S-M. Choi, S-Y. Oh, and S-K Jeong (2014). The effect of an APOE polymorphism on cognitive function depends on age. Journal of Neurology 261: 66-72.
[38] Sokoloff, K. and S. Engerman (2000). History Lessons: Institutions, Factor Endowments, and Paths of Development in the New World. Journal of Economic Perspectives, 14 (3): 217-232.
[39] Tabellini, G. (2008). Institutions and Culture. Journal of the European Economic Association, 6 (2-3): 255-294.
[40] Tavares, J. and R. Wacziarg (2001). How democracy affects growth, European Economic Review, 45(8): 1341-1378.
[41] Terry, N. and M. Irving (2010). Cultural and Linguistic 4 Diversity: Issues in Education, in Special Education for ALL Teachers, ed. Colarusso and O’Rourke, 5th ed, Kendall Hunt Publishing Co.
[42] Tucker-Drab, E. and P. Harden (2012). Learning motivation mediates gene-by-socioeconomic status interaction on mathematics achievement in early childhood. Learning and Individual Differences, 22: 37-45.
A
Appendix
A.1 List of countries – largest (123) sample
Afghanistan; United Arab Emirates; Argentina; Australia; Austria; Burundi; Belgium; Benin; Bangladesh; Bulgaria; Bahrain; Bolivia; Brazil; Botswana; Central African Republic; Canada; Switzerland; Chile; China; Cameroon; Congo, Rep.; Colombia; Costa Rica; Cuba; Cyprus; Czech Republic; Germany; Denmark; Dominican Republic; Algeria; Ecuador; Egypt, Arab Rep.; Spain; Estonia; Ethiopia; Finland; Fiji; France; United Kingdom; Ghana; Gambia, The; Greece; Guatemala; Guyana; Hong Kong; China; Honduras; Croatia; Haiti; Hungary; Indonesia; India; Ireland; Iran; Islamic Rep.; Iraq; Israel; Italy; Jamaica; Jordan; Japan; Kazakhstan; Kenya; Korea, Rep.; Kuwait; Liberia; Libya; Sri Lanka; Lesotho; Lithuania; Latvia; Moldova; Mexico; Mali; Malta; Myanmar;
25
Mozambique; Mauritania; Mauritius; Malawi; Malaysia; Niger; Nicaragua; Netherlands; Norway; Nepal; New Zealand; Pakistan; Panama; Peru; Philippines; Papua New Guinea; Poland; Puerto Rico; Portugal; Paraguay; Romania; Russian Federation; Rwanda; Sudan; Senegal; Singapore; Sierra Leone; El Salvador; Slovak Republic; Slovenia; Sweden; Swaziland; Syrian Arab Republic; Togo; Thailand; Tajikistan; Trinidad and Tobago; Tunisia; Turkey; Uganda; Uruguay; United States; Venezuela, RB; Vietnam; Serbia and Montenegro; South Africa; Congo, Dem. Rep.; Zambia; Zimbabwe.