Contents lists available atScienceDirect
Journal of Air Transport Management
journal homepage:www.elsevier.com/locate/jairtramanGlobal decision support for airport performance and e
fficiency assessment
Maria Emília Baltazar
a,b,∗, Tiago Rosa
a,b, Jorge Silva
a,baUniversidade da Beira Interior, Aerospace Science Department (DCA-UBI), Rua Marquês d’Ávila e Bolama, 6201- 001 Covilhã, Portugal bCERIS, CESUR, Instituto Superior Técnico, Universidade de Lisboa, Av. Rovisco Pais 1, 1049-001 Lisboa, Portugal
A R T I C L E I N F O Keywords:
Decision support
Airport performance and efficiency MACBETH
A B S T R A C T
Airport benchmarking depends on airport performance and efficiency indicators, and it is an important issue for
business, operational management, regulatory agencies, airlines and passengers. Using the MACBETH (Measuring Attractiveness by a Categorical Based Evaluation Technique) approach, a hierarchical additive value model is constructed with criteria weights and value scales derived from expert's judgments (obtained by an online survey) and by comparison of different reference levels and profiles of performance. This model measures
airport performance and efficiency and also peer benchmarks it within a set of direct competitors or
self-benchmarks itself during a specified period. GDS (Global Decision Support) model outputs, integrated into a
management system, allows the identification of deficiencies requiring urgent intervention and corrective
measures for its continuous improvement.
1. Introduction
Airport industry with all its inputs and outputs has a significant impact on the global economy, and it must find an optimal level for balancing the interests of the public in general, the stakeholders and all the airport operators. A benefit of benchmarking is that it can be a straightforward means to identify performance deficiencies or excep-tional performance, without detailed and complex examination of processes. The benchmarking of airports is essential to give all stake-holders the appropriate tools to participate in the management process of such infrastructures.
As many airports have transformed from government operated public utilities to privately operated commercial enterprises, there has been an increased interest in utilising benchmarking to assess and im-prove performance. Benchmarking has been used to examine some different aspects of the airport business (Liebert and Niemeier, 2010), (Francis et al., 2002):
− Pricing - the cost to the airline of flying to the airport regarding landing fees, terminal charges, etc. (Pels and Verhoef, 2003; Rivasplata, 2013);
− Service quality - customer satisfaction levels, average queue times, incidences of delays (Fodness and Murray, 2013;Tsai et al., 2011); − Cost - unit cost, such as operating or total cost per Work Load Unit1
(WLU) (Oum and Yu, 2004);
− Productivity or efficiency - Total Factor Productivity (TFP), Variable
Factor Productivity (VFP), or single factor productivity measures (Oum et al., 2003; Oum and Yu, 2004;Perelman and Serebrisky, 2012;Sarkis, 2000;Tovar and Martín-Cejas, 2010).
The results of these benchmarking studies are often used to high-light some positive or negative aspects of an airport– highest customer satisfaction in Asia, the most efficient airport in North America (Lin et al., 2013;Sarkis and Talluri, 2004), the most expensive airport in the world. However, it is essential to understand how these statistics are produced and how different approaches and different data quality can affect the results.
A review of airport benchmarking studies made by Liebert and Niemeier (2013)andLai et al. (2012), refers different methodologies applied to a wide range of airport areas and activities. The most fre-quently used methods are Data Envelopment Analysis (DEA), para-metric stochastic frontier analysis and the price index total factor pro-ductivity (Adler et al., 2013; P. Hooper and Hensher, 1997; P. G. Hooper and Hensher, 1997;Martín and Román, 2001;Oum et al., 2008; Pels et al., 2003;Pestana Barros and Dieke, 2007). The performance of airports using DEA was used to benchmark within national infra-structures, including Portugal, Spain, Australia, U.S, U.K., Taiwan and as well as airports around the world (Adler et al., 2013;Baltazar et al., 2014).
DEA and SFA are used to estimate either technical efficiency or cost efficiency. Hence contributions can be divided not only between non-parametric and non-parametric but also between those studying technical
https://doi.org/10.1016/j.jairtraman.2018.04.009
∗Corresponding author. Universidade da Beira Interior, Aerospace Science Department (DCA-UBI), Rua Marquês d’Ávila e Bolama, 6201- 001 Covilhã, Portugal. E-mail addresses:[email protected](M.E. Baltazar),[email protected](T. Rosa),[email protected](J. Silva).
1Work Load Unit (WLU) - Defined as one passenger or 100 kg of cargo (ACI Airport Council International, 2012).
Available online 17 April 2018
0969-6997/ © 2018 Elsevier Ltd. All rights reserved.
efficiency and those focusing on cost efficiency. Some studies in-vestigate the impact on airport performance of variables such as airport competition, effects of LCC on airport operations and government corruption (whether corruption influences airports' decision-making) (Choo and Oum, 2013;D'Alfonso et al., 2015;Martini et al., 2013b;Yan and Oum, 2014).
Some studies that incorporate in the benchmarking analysis airport environmental negative outputs like noise and pollution show that ex-ternalities generated from commercialflights have had various impacts regarding noise, air and water quality, energy conservation and ecology. The annoyance produced by noise has undoubtedly been the most significant of these and has had the greatest impact on the com-munities surrounding the airports. The undesirable nature of aircraft noise is too important to ignore. Studies seeking to provide a more reliable evaluation of the performance of airports should use currently available airport resources while embracing undesirable outputs and environmental factors (Yu, 2004;Yu et al., 2008).
Aviation and its effect on the environment is a growing matter of interest increase in demand for air transport. The pursuit of efficiency aims to increase the aircraft operations, the passengers transported and the cargo handled. As a result, it is not considered the impact of en-vironmental externalities associated with airport activities (Martini et al., 2013b). Thus, it is necessary to integrate emissions and noise into productivity measures to design policies providing to airlines the in-centives needed for moving towards a greener fleet (Martini et al., 2013a).
In addition to standard desirable outputs,Pathomsiri et al. (2008) consider time delays and delayedflights as undesirable outputs and find that excluding delays, large congested airports are efficient. When considering undesirable outputs, smaller airports are efficient because they compensate for lower desirable output/input ratios with shorter delays. Failing to recognise these may cause bias-efficiency estimations used in benchmarking (Lozano and Gutiérrez, 2011). Some studies (Grampella et al., 2017;Scotti et al., 2014) consider several undesirable externalities of airport activities like delays, noise and local air pollu-tion.
An evaluation mechanism for measuring the overall safety of air-lines is needed, to examine similar safety levels among airair-lines for safety management and improvement purposes. Multi-criteria decision making has been used to create safety index which brings together the many attributes of airline safety(Chang and Yeh, 2004). The hierarchy model was established by the evaluation offlight safety, to improve the management of flight safety for an airline company. A flight safety evaluation model with the weights determined by the Analytic Hier-archy Process was analysed by (Xiao-yu and Jiu-sheng, 2012). A recent study by MacLean (MacLean et al., 2016) addresses benchmarking airports with specific safety performance measures, but it was not found any study mention airport safety in an MCDA analysis.
Baltazar et al. (2014)used, and compared the results, of two mul-tidimensional tools, MCDA/MACBETH and DEA, applied to three Iberian airports, two in Portugal (Lisbon and Ponta Delgada) and one in Spain (Barcelona). The preliminary results evidenced how MACBETH approach seems to be an auspicious one when compared with those (DEA based) traditionally in use. Mainly, because MACBETH appears to be more accurate than DEA, and it can be easily applied in managerial practice including, in the process, all the related stakeholder (Baltazar et al., 2014).
The literature did not show any MCDA (Multi-Criteria Decision Analysis) application for airport performance and efficiency assess-ment. Authors propose a hierarchical additive value model (GDS) tofill this gap. Thus MACBETH (Measuring Attractiveness by a Categorical Based Evaluation Technique) approach is the MCDA one used (Bana e Costa et al., 2016), (Bana e Costa et al., 2012), (C.Bana e Costa and
Vansnick, 1994). This study assesses the potentialities of the use of MACBETH in the Key Performance Areas (KPAs) each one associated with several Key Performance Indicators (KPIs) of Airport Council In-ternational (ACI) reports (ACI - Airport Council International, 2012).
Section2presents background information on the scope and pur-pose of the project. Section3includes the description of GDS model development and a brief technical overview of MACBETH.
Section4presents the outputs from the eleven years of application of GDS model to assess airport performance and efficiency. Finally, Section5elaborates some conclusion and future work from the devel-oping and implementation GDS model.
2. Scope and purpose
The process of identifying the best practices using performance benchmarking enables the understanding and the adaptation of these practices to help the airport management to improve their performance. The comparison of a pre-set data allows the airport management to establish new performance goals with new standards and measures. Over designated time frames, benchmarking can improve operating levels and lead to improved organisational efficiency and performance. Performance measures also have the responsibility of accommodating the needs and requirements of all airports, regardless of size or vo-lumes.
Performance measures should be accessible, reliable, dependable, and accurate (ACI Airport Council International, 2012). For this study, the data was retrieved from airport annual and sustainability reports to create the dataset for three test airports.
ACI (ACI - Airports Council International, 2006), summarises the benchmarking process:first is about management and organisational change, and secondly is about measurement and technology. The self-benchmarking (internal) basis is an excellent management tool to monitor performance improvements. Peer-benchmarking (external), is an efficient way to identify best practices to see if they can be in-corporated into an organisation and to determine unsound practices to determine if they can be eliminated.
Decision makers need to be informed how the airport is complying with the established strategies of all the interested stakeholders and the owner, which can be the government in public ownership, the stake-holders in private ownership or even both if it is a Public Private Partnership (PPP).
In the reviewed literature, we found virtually no studies of multi-criteria decision analysis models that enable managers to measure the performance and efficiency of any airport not only in a global per-spective but also to peer benchmark it within a set of direct competitors or to self-benchmark itself during a given period. The proposed struc-ture resulted from the analysis and discussion of the Airport Council International (ACI) reports (ACI Airport Council International, 2012). ACI divided the airport into six Key Performance Areas (KPAs), each one is associated with several Key Performance Indicators (KPIs) which are integrated in the multi-criteria decision analysis MACBETH (ACI Airport Council International, 2012;Baltazar et al., 2014;Bana e Costa et al., 2016; C. A.Bana e Costa and Vansnick, 1994). The development of this model respects the airports' diversity allowing it to adapt the study to the airports’ characteristics.
3. Methodology
3.1. Introduction
Lai et al. (2012)state that the primary method in MCDA is the analytical hierarchy process-AHP, which uses procedures for deriving the weights and the scores archived by alternatives that are based on
Table 1
Key performance area (KPA) and key performance indicator (KPI) scope.
Source: Own elaboration based on ACI (ACI Airport Council International, 2012).
Key Performance Area (KPA) Key Performance Indicator (KPI) [Measuring Units] Core: measures used to characterise and categorise
airports
Passengers Passengers, including enplaning and deplaning, measured over the course of a year. [nºpax]
Origin and Destination Passengers Passengers whose air travel begins or ends at the airport, measured over the course of a year. [nºpax o&d]
Aircraft Movements Aircraft take-offs or landings at an airport, measured over the course of a year. One arrival and one departure are counted as one movement. [nºmovs]
Freight or Mail Loaded/Unloaded Freight or mail loaded or unloaded at the airport, measured in metric tonnes over the course of a year. [metric tonnes]
Destinations—Nonstop Number of airports with nonstop service, including destinations with only seasonal service, measured over the course of a year. [nº airp non-stop] Safety and Security: characterises airport
responsibilities
Runway Accidents Aircraft accidents involving a runway per thousand aircraft movements (take-offs and landings are counted separately), measured over the course of a year. [accidents/1000movs]
Runway Incursions Number of occurrences per thousand movements involving the incorrect presence of an aircraft, vehicle, or person on the protected area of a surface designated for the landing and take-off of aircraft, measured over the course of a year. [incursions/1000movs]
Bird Strikes Number of incidents per thousand movements, involving bird strikes, which are collisions of airborne animals (usually birds, but also including bats) with aircraft, measured over the course of a year. [bs/1000movs] Public Injuries Number, of public injuries per thousand passengers, measured over the
course of a year. [pinj/1000movs]
Occupational Injuries Occupational injuries to airport authority employees per thousand hours worked. [ocpinj/1000hoursworked]
Lost Work Time from Employee Accidents and Injuries
Lost time due to employee accidents and injuries, measured per thousand hours worked. [lwt/1000hoursworked]
Service Quality: reflects the evolution of airport Practical Hourly Capacity Maximum aircraft movements per hour assuming an average delay of no more than 4 min, or such other number of delay minutes as the airport may set. [maxmovs/hour]
Gate Departure Delay Average gate departure delay perflight in minutes - measured from scheduled departure time at average and peak times. [∑δgtj/nflights] Taxi Departure Delay Average taxi delay for departing aircraft perflight in minutes - measured by
comparing actual taxi time versus unimpeded taxi time at average and peak times. [∑δttj/nflights]
Customer Satisfaction The overall level of passenger satisfaction as measured by survey responses. [0–100%]
Baggage Delivery Time The average time for delivery offirst bag and last bag measured over the course of a year. [∑δbdtj/nflights]
Security Clearing Time Average security clearing time from entering the queue to completion of processing - measured at average and peak times. [∑δsctj/npax] Border Control Clearing Time Average border control clearing time from entering the queue to
completion of processing - measured at average and peak times. [∑δbcctj/ npax]
Check-in to Gate Time Average time from entering the check-in queue, to arrive at the boarding gate - measured at average and peak times. [∑ (δtj x paxj)/∑npax] Productivity/Cost Effectiveness: measures
related/overlapping measures of an airport's performance
Passengers per Employee Total passengers per employee, expressed as full-time equivalents (FTEs), measured over the course of a year. [pax/emp]
Aircraft Movements per Employee Aircraft movements per employee, expressed as full-time equivalents (FTEs), measured over the course of a year. [movs/emp]
Aircraft Movements per Gate Aircraft movements per gate, measured over the course of a year. [movs/ gate]
Total Cost per Passenger Airport total costs per passenger, i.e., operating costs plus non-operating costs, divided by passengers, measured over the course of a year. [tcost/ pax]
Total Cost per Movement Airport total costs per movement, i.e., operating cost plus non-operating cost divided by movements, measured over the course of a year. [tcost/ movs]
Total Cost per workload units-WLU Airport total costs per Work Load Unit, i.e., operating costs plus non-operating costs divided by Work Load Units. [tcost/wlu]
Operating Cost per Passenger Airport operating costs per passenger, divided by passengers, measured over the course of a year. [opcost/pax]
Operating Cost per movement Airport operating cost per movement, measured over the course of a year. [opcost/movs]
Operating Cost per WLU Airport operating costs per Work Load Unit, measured over the course of a year. [opcost/wlu]
pairwise comparisons between criteria and between options, respec-tively. There are other outranking methods:
− ELimination Et Choix Traduisant la Realité that is, Elimination and Choice Expressing Reality-ELECTRE designed for choosing a single action ELECTRE I or for choosing with rankings by eliminating many alternatives, the remaining subset is the most satisfying al-ternative ELECTRE II, III and IV;
− Preference Ranking Organisation Method for Enrichment of Evaluations-PROMETHEE defines preference functions based on differences between attributes among different schemes;
− Technique for Order Preference by Similarity to Ideal Solution-TOPSIS, this method uses ideal and non-ideal solutions tofind the best alternative but assumes that each indicator takes monotonic function utility.
In the user guide of the M-MACBETH, the authors underline that MACBETH is a user-friendly approach that requires only qualitative judgments about differences of value to help decision-makers to quantify the relative attractiveness among several options (Bana e Costa et al., 2017). Thus, MACBETH is the MCDA method selected to elabo-rate a new approach to airport performance and efficiency assessment. To apply MACBETH methodology a six steps model (GDS) was
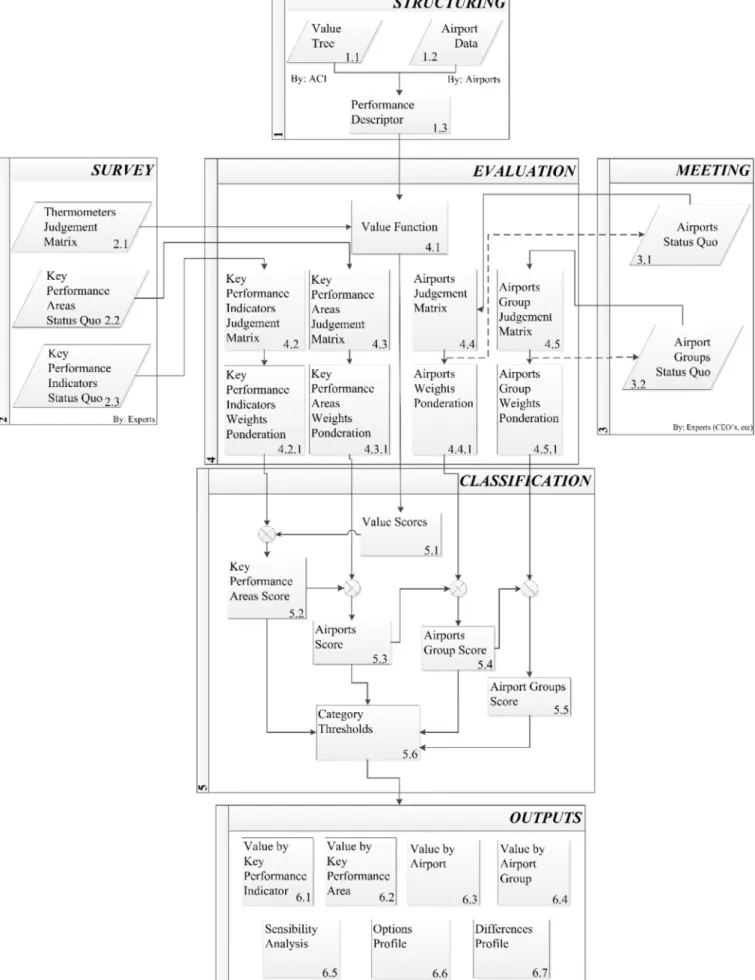
developed as depicted in Fig. 1. The objective of this model is to evaluate and classify airports with different scales and operations. Thus, it is necessary to understand what are the key features of this type of infrastructures. Based on the literature, a value tree (Fig. 2) was con-structed compiling the key performance areas and associated key per-formance indicators identified. After structuring value tree and its data, a performance descriptor is constructed (Step 1), the GDS model com-piles a survey and a meeting (Step 2 and Step 3) to be applied to groups of experts in the KPAsfields. With these structuring steps, it is now possible to start the MACBETH evaluation and classification process (Step 4 and Step 5) resulting infinal scores. Subsequently, GDS model analyses these scores providing not only a categorical threshold but also a wide range of outputs analysis (Step 6). To validate GDS model this process was applied to 3 different airports allowing to peer-benchmark and self-benchmark them in an 11 years’ time-period.
3.2. Structuring
GDSfirst step (Structuring) shows that the structuring value tree is assessed from ACI (ACI Airport Council International, 2012) (Fig. 1). Therefore, a value tree of six KPAs (core, safety and security, service quality, productivity/cost-effectiveness, financial/commercial and en-vironmental) and related KPIs (key criteria) is constructed based on Table 1 (continued)
Key Performance Area (KPA) Key Performance Indicator (KPI) [Measuring Units]
Financial/Commercial: measures relating to airport charges, airportfinancial strength and sustainability
Aeronautical Revenue per Passenger Aeronautical charges per passenger, measured over the course of a year. Average of aeronautical revenues collected per passenger for the use of airfield (landing fees, ramp/apron fees), gate charges, terminal space, passenger-related charges, and ground-handling user fees. [rev/pax] Aeronautical Revenue per Movement Aeronautical charges per movement, measured over the course of a year.
Average of aeronautical revenues collected per movement for the use of airfield (landing fees, ramp/apron fees), gate charges, terminal space, passenger-related charges, and ground-handling revenue. [rev/movs] Non-Aeronautical Operating Revenue as
Percent of Total Operating Revenue
Total non-aeronautical operating revenue as a percentage of total operating revenue, measured over the course of a year. [nonaerooprev/totalop ver (%)]
Non-Aeronautical Operating Revenue per Passenger
Total non-aeronautical operating revenue per passenger, measured over the course of a year. [nonaerooprev/pax]
Debt Service as Percentage of Operating Revenue
Debt service (principal plus interest) as a percent of operating revenue, measured over the course of a year. [debt/oprev (%)]
Long-Term Debt per Passenger Long-term debt plus accrued interest payable less the balance in both the debt service reserve fund and debt service or sinking fund, per passenger measured at the end of the year. [lt debt/pax]
Debt to EBITDA Ratio Debt-to-EBITDA (earnings before interest, taxes, depreciation, and amortisation) measured at the end of the year. [debt/ebita]
EBITDA per Passenger EBITDA (or earnings before interest taxes depreciation and amortisation) per Passenger, measured over the course of a year. [ ebitad/pax] Environmental: measure to assess environmental
impacts
Carbon Footprint The carbon footprint is the total set of greenhouse gas (GHG) emissions caused by activities at the airport within the airport's control, expressed regarding the amount of carbon dioxide or its equivalent in other GHG emitted. It excludes emissions caused by airline/tenant operations and the public. [GHG/PAX]
Waste Recycling Percentage of solid waste that is recycled/reused/composted, including pre-consumer organics and post-consumer compostable, as well as airfield trash, measured over the course of a year. It does not include construction waste. [% water recycled]
Waste Reduction Percentage Percentage reduction over the previous year in tonnes of solid waste, including pre-consumer organics, and post-consumer compostables, as well as airfield trash. It does not include construction waste. [Waste red (%)] Renewable Energy Purchased by the Airport
(Percent)
The amount of renewable energy purchased by the airport, as a percentage of total energy consumed by the airport. It excludes energy purchases by tenants. [REP (%)]
Utilities/Energy Usage Per Square Meter of Terminal
Utilities and energy used per square meter of the terminal building (conditioned space), measured in kilowatt-hours and in terms over the course of a year. [KWh/m2]
Water Consumption Per Passenger Water consumption in the terminal complex divided by number of passengers, measured over the course of a year. [ H2O (Lit)/PAX]
Table 1.Fig. 2shows the proposed airport value tree. 3.2.1. Value tree
Value tree (Fig. 2), is formed by two distinct types of nodes,“criteria nodes” (KPI) and “non-criteria nodes” (KPAs), depending on whether or not it will be used to evaluate the options attractiveness that is asso-ciated with“basis for comparison”. In an 11 years’ time series the years 2003–2013 are the options.
3.2.2. Airport data
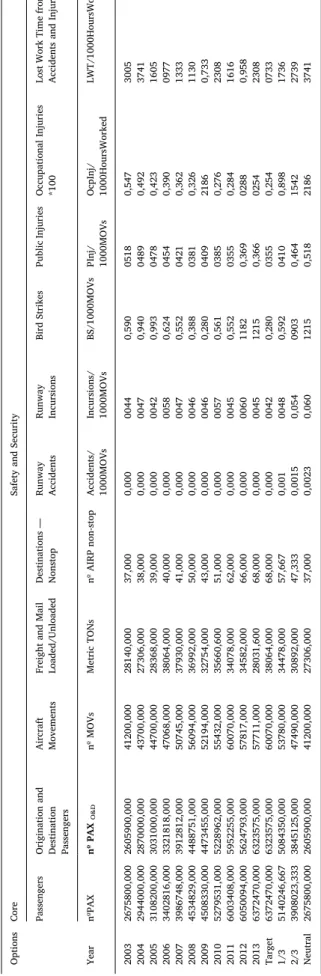
Table 2shows an example of the collected data needed tofill the performance table, this was an enormous task, as it was necessary to gather data for three airports for all KPIs of each KPA. All data was retrieved from airports annual reports and sustainability for the years 2003–2013 to create three different airports characteristics to validate GDS model.
This data refers three Portuguese airports from the airport group VINCI/ANA and has partial data collected from the published public reports for these airports. Although diligence were made to complete the performance table, there was no willingness to cooperate with this study. Moreover, the performance table was complemented with data from world airports similar in scale to Lisbon, Porto and Faro airports, which for this study were called Airport 1, 2 and 3, respectively.
The choice of these three airports allows demonstrating that this methodology does not depend on the size (nº of passengers, nº of movements) and offers a way to compare large airports efficiency with small ones. It also allows to compared airports that are mainly LCC oriented (Faro airport), hubs (Lisbon) or even combo airports like Porto. Thus, making this tool universal.
3.2.3. Performance descriptor
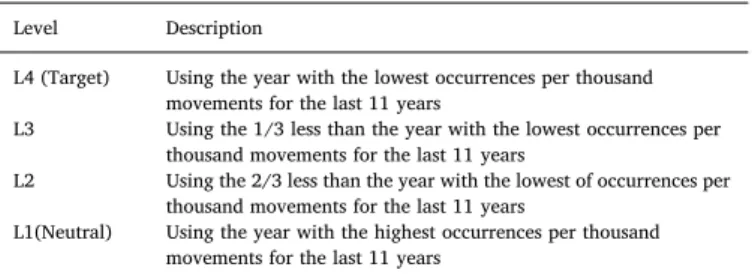
With data gathered, it is possible to construct the performance de-scriptors. Thus, these descriptors translate the information needed for efficient performance and evaluation assessment. Table 3 depicts an example of a performance descriptor for runway incursions.
Descriptors are performance scales, an example is illustrated in Table 3, formed by four reference levels of accomplishment that permit the assessment of the airport performance on each KPI included in GDS model and to trace the airport performance profile in each area. For all the descriptors, were established two reference levels (Target and Neutral) which have underlying meaning for managers. Target is the best level of performance in the last 11 years indicating that no im-provement is required in the particular criterion. Neutral is the worst level of performance in the last 11 years showing the ensures minimum working conditions. However, below this level action is recommended to improve the airport performance, at least until the Neutral level is achieved. It is possible for airport managers to update or establish the definition of target and neutral that best reflects their perception of the airport. Nevertheless, when performing a peer benchmarking these definitions must be in a standard and unique structure.
3.3. Survey
An online survey was sent to more than 500 experts of the KPA of the model. Step 2 (Survey) ofFig. 1shows the survey outputs that will be inputs for the evaluation stage of GDS model. The survey has a margin error of 10%, with a confidence level of 95%, the population size is 500 and a sample size of 81. This survey is still open to answers, but for this study, it stopped at 81 answers.
Table 4shows the survey response rate by KPA, of several experts per area. Note that GDS model does not rely on the number of answers but the quality of these answers and their relevance to the case in study. The selected experts that answer to the survey were from wide scope expertise such as aeronautic engineers, academics - including professors and researchers, transport managers, civil aviation authorities from different countries, infrastructure and planning systems engineers, air
Table 2 Example of airport data collected. Source: Own elaboration. Options Core Safety and Security Passengers Origination and Destination Passengers Aircraft Movements Freight and Mail Loaded/Unloaded Destinations — Nonstop Runway Accidents Runway Incursions Bird Strikes Public Injuries Occupational Injuries *100 Lost Work Time from Employee Accidents and Injuries Year nºPAX nº PAX O&D nº MOVs Metric TONs nº AIRP non-stop Accidents/ 1000MOVs Incursions/ 1000MOVs BS/1000MOVs PInj/ 1000MOVs OcpInj/ 1000HoursWorked LWT/1000HoursWorked 2003 2675800,000 2605900,000 41200,000 28140,000 37,000 0,000 0044 0,590 0518 0,547 3005 2004 2944000,000 2870000,000 43700,000 27306,000 38,000 0,000 0047 0,940 0489 0,492 3741 2005 3108200,000 3031000,000 44700,000 28368,000 39,000 0,000 0042 0,993 0478 0,423 1605 2006 3402816,000 3321818,000 47068,000 38064,000 40,000 0,000 0058 0,624 0454 0,390 0977 2007 3986748,000 3912812,000 50745,000 37930,000 41,000 0,000 0047 0,552 0421 0,362 1333 2008 4534829,000 4488751,000 56094,000 36992,000 50,000 0,000 0046 0,388 0381 0,326 1130 2009 4508330,000 4473455,000 52194,000 32754,000 43,000 0,000 0046 0,280 0409 2186 0,733 2010 5279531,000 5228962,000 55432,000 35660,600 51,000 0,000 0057 0,561 0385 0,276 2308 2011 6003408,000 5952255,000 60070,000 34078,000 62,000 0,000 0045 0,552 0355 0,284 1616 2012 6050094,000 5624793,000 57817,000 34582,000 66,000 0,000 0060 1182 0,369 0288 0,958 2013 6372470,000 6323575,000 57711,000 28031,600 68,000 0,000 0045 1215 0,366 0254 2308 Target 6372470,000 6323575,000 60070,000 38064,000 68,000 0,000 0042 0,280 0355 0,254 0733 1/3 5140246,667 5084350,000 53780,000 34478,000 57,667 0,001 0048 0,592 0410 0,898 1736 2/3 3908023,333 3845125,000 47490,000 30892,000 47,333 0,0015 0,054 0903 0,464 1542 2739 Neutral 2675800,000 2605900,000 41200,000 27306,000 37,000 0,0023 0,060 1215 0,518 2186 3741
and space law specialists, airport operators and technical directors. One limitation of this model is that experts of a given area may have an aptitude for overestimating the relevance of their area of expertise.
However, all 81 experts answer on 6 KPA relevance, and data show a consensus. Moreovers, in safety and security KPA the answers dis-tribution was concentrated in“extreme” and “very strong” classifica-tions, 61 out of 81.Table 5, depicts a consensus on safety and security KPA relevance, this trend is also present in the other KPA.
3.3.1. Survey structure
The survey followed the eight steps for all KPA and associated KPI:
1. Welcome message.
2. Personal information; name, email and professional expertise. 3. Which key performance area is the more relevant?
4. Rank the KPA in order of relevance: It is possible to give the same rank to different areas, being 1 the least relevant and 6 the most relevant.
5. Choose the area of expertise among the KPA.
6. In the KPA of expertise which KPI is the more relevant?
7. Rank the KPI in order of relevance: It is possible to give the same rank to different areas, being 1 the least relevant and 6 the most relevant.
8. Fill the judgement matrix for all KPI answering to the 6 questions so that A refers to the best option of the KPI over the course of 10 years; D refers to the worst option of the KPI over the course of 10 years; B and C are intermediate values equally distributed between A and D. 8.1 AD - A is more attractive than D. The difference is? (Question 1) 8.2 AC - A is more attractive than C. The difference is? (Question 2) 8.3 BD - B is more attractive than D. The difference is? (Question 3) 8.4 AB - A is more attractive than B. The difference is? (Question 4) 8.5 BC - B is more attractive than C. The difference is? (Question 5) 8.6 CD - C is more attractive than D. The difference is? (Question 6) 3.3.2. Survey outputs
With Statistical Weighted Average (SWA) (Eq.(1)) of the survey answers using rank distribution, it is now possible to obtain three outputs that reflect the expert's opinions for each KPA and associated KPI.
=
= ×
+…+ = ×
SWA
Rank n very weak answers Rank n extreme answers
n total answers
[( 1) º )
( 6) º )]
( º ) (1)
As an example, applying equation(1)toTable 5, we get a SWA KPA-Safety and Security= 39881 = 4.91corresponding to the rank Strong - Very
Strong.
The model objectives are the descriptors or scales of performance, the descriptor of each KPI is defined, and the performance scale is converted to a value scale using qualitative judgments of differences in attractiveness between performance levels, two at a time. Six semantic categories of difference of attractiveness are offered to ease the judg-ment process. Possible answers are:“very weak”; “weak”; “moderate”; “strong”; “very strong” or “extreme”; or a succession of these in case hesitation or disagreement arise (Bana e Costa et al., 2012).
3.3.3. Criteria judgment matrix
Table 6shows an example of the difference of attractiveness of the criteria for the airport 1 passengers per employee KPI. The model produces this output for all KPI and remains unaltered for all the air-ports in the study.
3.3.3.1. KPA status quo.Table 7shows the relevance associated to all KPA retrieve by the expert's survey, for each ranking we can retrieve the status quo of the KPA, which remains unaltered for all the airports in the study, so that it can be possible to obtain the KPA judgement matrix.
3.3.3.2. KPI status quo. Table 8 shows an example of the relevance associated to all KPIs in service quality KPA retrieved by the expert's Table 3
Performance descriptor for“runway incursions”.
Source: Own elaboration. Level Description
L4 (Target) Using the year with the lowest occurrences per thousand movements for the last 11 years
L3 Using the 1/3 less than the year with the lowest occurrences per thousand movements for the last 11 years
L2 Using the 2/3 less than the year with the lowest of occurrences per thousand movements for the last 11 years
L1(Neutral) Using the year with the highest occurrences per thousand movements for the last 11 years
Table 4
GDS survey answers distribution.
Source: Own elaboration based on the online survey. Survey Answers
Core 19
Safety and Security 19
Service Quality 14 Productivity/Cost Effectiveness 12 Financial/Commercial 9 Environmental 8 Total 81 Table 5
GDS survey rank and answers distribution for safety and security. Source: Own elaboration based on the online survey answers.
RANK Safety and Security
Answers Answers x Rank
Very Weak (1) 1 1x1 Weak (2) 2 2x2 Moderate (3) 4 4x3 Strong (4) 13 13x4 Very Strong (5) 37 37x5 Extreme (6) 24 24x6 Total 81 398 Table 6
Judgement matrix airport 1 passengers per employee KPI. Source: Own elaboration based on the online survey answers.
Descriptor value Level L3 L2 L1
43647,05 L4 Weak-Moderate Moderate-Strong Strong-Very Strong 35379,26 L3 Weak-Moderate Moderate 27111,46 L2 Weak-Moderate 18843,66 L1 Table 7
Airport KPAs ranking.
Source: Own elaboration based on the online survey answers. Key Performance Areas Ranking Status Quo
Safety and Security 4,91 Strong-Very Strong
Core 4,77 Strong-Very Strong
Productivity/Cost Effectiveness 4,43 Strong
Service Quality 4,30 Strong
Financial/Commercial 4,26 Strong
survey, for each ranking we can retrieve the status quo of the KPI, which remains unaltered for all the airports in the study so that it can be possible to obtain the KPI judgement matrix.
3.4. Meetings
A decision conference is a gathering of the key player who wishes to resolve a critical issue faced by their organisation. They are assisted by an impartial facilitator who is a specialist in decision analysis and works as a process consultant. Using a model of relevant data and judgements created on the spot it is possible to assist the group in thinking more clearly about the issues.Fig. 3shows the building pro-cess of a decision conference.
3.4.1. Airport meeting outputs
The survey did not refer the airports level of achievement. Subsequently, the assignment of weights for each indicator was ob-tained throughout negotiation meetings with experts, all professionals
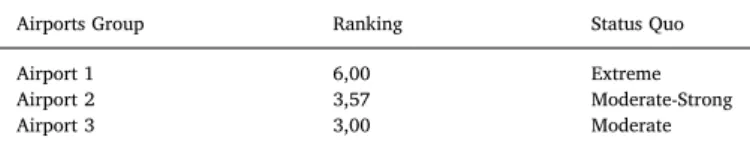
involved in aircraft operations,flight safety and air transport economics and management. The role of the facilitator was played by the authors allowing difference of opinions of the experts, assessing the trade-offs and agree on thefinal weights and differences of attractiveness. 3.4.1.1. Airports status quo. Table 9 shows the relevance associated with the three airports retrieved by the expert's meetings, for each ranking we can retrieve the status quo of the airport. Thus it is now possible to obtain the airport's judgement matrix.
3.4.1.2. Airports group status quo. The relevance associated with distinct groups of airports is not a part of this study. Thus, it is not possible to show real rankings, from either survey or meetings. Nevertheless, it is possible to apply the same process to airports status quo (e.g., ANA-Vinci airports, AENA airports, Manchester Airports Group).
3.5. Evaluation
Managers’ value judgments, required the construction of value scales and assigned weights to criteria (KPI) and areas (KPA), which are the essence of the subjective component of the model.Fig. 1shows the fourth step of GDS model, in this stage, it has retrieved the value function (Fig. 4) from all performance descriptors and option judge-ment matrix and all the airport group, airports (Table 10), KPA and KPI judgement matrices and weights ponderation.
“There are two alternative weighting modes in M-MACBETH: the simple mode (or non-hierarchical weighting) in which weights are assigned in a single step to all criteria nodes simultaneously; and hierarchical weighting, in which weights can be assigned in several steps at different levels of the value tree. In both modes, two weighting references (one “upper” and one “lower”) are required for each criterion involved (Bana e Costa et al., 2017)”.
GDS model assesses all the weights ponderation using the designation “target” as “upper” and “neutral” as “lower”.Fig. 5shows the Airport 2 wt profile for service quality KPA KPIs.
3.6. Classification
Fig. 1, in step 5 (Classification), shows how after the performances are given it is possible to calculate the value scores of each KPA and proceed to the overall value score. For management proposes and to identify potential needs for action to be taken, it will be associatedfive categories of accomplishment that go from“excellent” to “catastrophic” called the level of performance.
3.6.1. Classification scores
The value scores (for each option and KPI) are retrieved from the value function. Subsequently, all KPA, Airport and Airports Group scores are determined.Table 11andFig. 6shows the value scores and KPI weights (importance that experts address to each KPIs) for core KPA and core KPA score, andFig. 7lists airport 3 options ranking with all the KPA.
3.6.2. Category thresholds
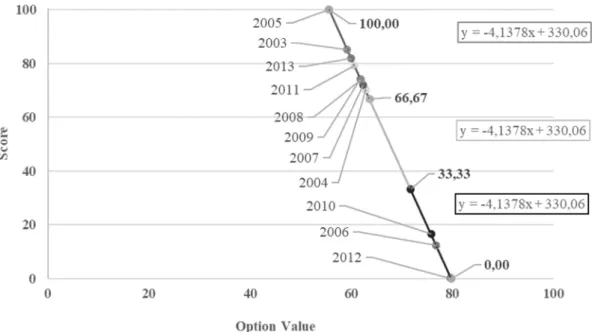
A six categories scales were associated with the score ranges of each KPA and each airport (Table 12), to make the options score more op-erational to the decision makers.Fig. 8shows an example of core KPA category thresholds profile for the KPI scores on Airport 2 were 2003 option has the poorest scores while 2013 archives the highest scores. In Table 13it is possible to obtain the information on core KPA category thresholds and scores for 2003, 2007 and 2013 options on airport 2 and conclude that the evolution of the categories scales for the core KPA is positive and no action is necessary.
Table 8
Ranking all KPIs in service quality KPA.
Source: Own elaboration based on the online survey answers.
Service Quality Ranking Status Quo
Customer Satisfaction 4,93 Strong-Very Strong Gate Departure Delay 4,64 Strong-Very Strong
Baggage Delivery Time 4,43 Strong
Taxi Departure Delay 4,36 Strong
Security Clearing Time 4,29 Strong
Border Control Clearing Time 4,14 Strong
Check-in to Gate Time 4,14 Strong
Practical Hourly Capacity 4,07 Strong
Fig. 3. The building process of a decision conference.
Source: Adapted (Phillips and Bana e Costa, 2007).
Table 9
Airports ranking and status quo.
Source: Own elaboration based on the expert's meetings.
Airports Group Ranking Status Quo
Airport 1 6,00 Extreme
Airport 2 3,57 Moderate-Strong
4. Implementation results 4.1. GDS outputs
Follow the proposed GDS model inFig. 1, within the sixth step of GDS model it is possible to adopt a schematic panel data to sort the outputs of airport performance and efficiency assessment that will allow monitoring performance and value over time.
4.1.1. Performance profile
Profiles of (quantitative or/and qualitative) performance can be traced both within and across areas.Fig. 9, shows an example of en-vironmental KPA for 2003–2013 options performance profile. From this figure, it is possible to observe that the option 2013 is the best profile having 4/6 scores over the target level. 2004 as an intermittent KPI behaviour with 4/6 scores that are either above or under neutral level. 2005 as the same behaviour as 2004 but in different KPI. The evalua-tion of this performance profile shows an ongoing positive progression from 2003 to 2013 options; it has the best scores in carbon footprint, waste recycling, and renewable energy purchased by the airport (per-cent), utilities/energy usage per square meter of terminal and water consumption per passenger. Only on waste reduction percentage is under the 2004, 2005, 2008 and 2009 option. To have all 2013 KPI of this KPA in an excellent threshold category, it is necessary the im-provement of the waste reduction KPI percentage and carbon footprint. Fig. 4. Value function for runway incursion KPI of the airport 1 safety and security KPA.
Table 10
Airports judgement matrix and weights ponderation.
Airport 2 Airport 3 Neutral Weights Airport 1 Moderate Moderate-Strong Extreme 50,00% Airport 2 Very Weak Moderate-Strong 28,57%
Airport 3 Moderate 21,43%
4.1.2. Options and difference profile
Using the options profile from airport 2 service quality KPA, it is possible to assess the pairwise profile of the options allowing to com-pare each KPI of a KPA from the options (years). InFig. 10is showed
the 2005 and 2008 options profile.Fig. 11 shows the corresponding difference profile of 2008 score has overcome 2005 allowing the deci-sion maker to decide whether it is essential or not to act upon the KPI in which 2005 still has a better score than 2008 and understand why. Table 11
Airport 3 KPI weights for KPA core. Source: Own elaboration.
Year Passengers Aircraft Movements Origin and Destination Passengers Freight and Mail Loaded/Unloaded Destinations -Nonstop Key Performance Area Score
2003 3,89 0,00 4,82 100,00 0,00 19,11 2004 0,00 7,36 0,00 77,26 3,30 15,40 2005 8,22 24,19 8,86 54,11 19,78 21,52 2006 33,32 58,16 33,96 40,91 32,97 40,38 2007 61,79 87,83 61,35 40,22 65,38 64,47 2008 60,05 82,94 59,35 19,10 70,33 59,59 2009 31,24 57,08 32,52 23,84 42,86 37,79 2010 52,22 81,25 52,35 6,00 100,00 57,78 2011 72,64 91,44 73,65 2,60 90,11 67,63 2012 76,89 79,30 77,16 0,38 90,11 66,27 2013 100,00 100,00 100,00 0,00 90,11 81,44 Weigths 25,71% 22,86% 20,00% 17,14% 14,29% 100%
Fig. 6. Airport 3 KPA score.
4.1.3. Sensitivity analysis
Sensitivity analysis on the KPI weights in the KPA scores or the overall airport score is obtained by GDS model allowing the decision maker to observe the cost of increasing or decreasing these weights. Fig. 12depicts total cost per WLU KPI in the productivity/cost-effec-tiveness KPA. The left vertical axis represents the KPA score, and the right vertical axis represents the KPI scores for each option (year). The vertical grey line represents the weight (10,99%) assign to this KPI. For 2009 overcome 2011 rank the weight of this KPI must change to a value over 50%. If the total cost per WLU KPI weight increase to 38%, 2007 option would lose the second position in the ranking, surpassed by 2008–2011 options.
4.1.4. Value by KPI, KPA, airport and airport group
GDS does the ranking of the KPIs value scores and produces the ranking of the related KPA options (Fig. 13andFig. 14). Moreover, it is possible to assess the value scores of the KPAs (Fig. 15) and the ranking of the associated airport options (Fig. 16).Fig. 17 depicts the value scores of the three airports andFig. 18depicts the ranking of the cor-responding airport group options.
4.2. GDS model - advantaged and disadvantage
The major advantage of GDS model is that it is a user-friendly multi-criteria decision analysis approach that only requires qualitative judg-ments about differences to quantify the relative attractiveness among Table 12
Levels, scores and category thresholds with six levels and 11 categories scales. The darker shade is, the worse results (from 0 to 40 points) when in color this is red; the medium shade is medium values (from 40 to 60 points) when in color this is yellow, and the lighter shade is the best results (from 60 to 100 points) when in color this is green.
Source: Own elaboration based on the expert's meetings. Levels Scores Category Thresholds
L0 0 Catastrophic ]L0,L1] Alert-Catastrophic L1 20 Alert ]L1,L2] Alert-Poor L2 40 Poor ]L2,L3] Poor-Satisfactory L3 60 Satisfactory ]L3,L4] Satisfactory-Good L4 80 Good ]L4,L5] Good-Excellent L5 100 Excellent
Fig. 8. Example of core KPA category thresholds profile for the KPI scores of airport 2. Table 13
Core KPA category thresholds and scores for 2003, 2007 and 2013 options on airport 2. The darker shade is, the worse results (from 0 to 40 points) when in color this is red; the medium shade is medium values (from 40 to 60 points) when in color this is yellow, and the lighter shade is the best results (from 60 to 100 points) when in color this is green.
several options values. Although the qualitative judgements have an associated subjectivity, this can be mitigated by increasing the number of survey answers. The model allows evaluating performance and effi-ciency of any airport in a global perspective, to benchmark all the direct competitors, and to self-benchmark the same airport over several years. The score obtained by the airports is independent even when the peers change, as the score of each airport is achieved following the same evaluation method and using the same expert judgements.
The major disadvantages of building this kind of model can be grouped into four main difficulties:
− First, collecting information will not always be well understood ei-ther because of terminology in use is unknown, or because it is misinterpreted, this implies that adequacy and modification of the model building process as to be taken;
− Second, this is a time-consuming process due to the large number of KPIs and a significant amount of information that requires an
interactive and dynamic approach with successive adjustments until the model can be considered done;
− Third, the need to inspect multiple procedures and resources in distinct KPAs can be a complicated task to achieve; and
− Fourth, the definition of neutral and target levels, for each non-re-dundant and independent KPIs forces to set“neutral” level of per-formance to guarantee the regular working conditions accomplish-ment or the quantity and quality components of performance interdependencies requires merging them into a single KPI. 5. Conclusions and future work
Global decision support (GDS) for airport performance and effi-ciency assessment based on MACBETH methodology on airport key performance areas was used to assess the overall performance of three airports and under two distinct processes, peer benchmarking and self-benchmarking ones (in this particular along several years in the recent Fig. 9. Performance profile for environmental KPA for 2003–2013 options.
past).
The results evidence the importance of this type of decision support that can help to understand how airports deal with performance and efficiency assessment and how KPA and KPI may impact in any benchmarking process and the overall evaluation. This method proves itself very flexible if the data is available. The choice of the KPIs to construct the rankings to benchmark the airports must be very accurate, and consensual; also, to promote the performance of the airport, it is necessary to promote the chain as a whole.
Complex and dynamic organisations such as international airports
provide a challenge in establishing an appropriate performance mea-surement system, to improve their roles in an increasingly competitive aeronautical activity.
A more participative contribute from all stakeholders will allow a more efficient airport benchmark. We believe that this (new) GDS to assess airport performance and efficiency based on an MCDA approach – the MACBETH, will allow an easy engagement of all stakeholders.
In future work, we will optimise and implement GDS model as a robust andflexible multidimensional tool that can be used in a user-friendly environment by airport managers and researchers. Thus, Fig. 11. Airport 2 service quality differences profile.
Fig. 13. Airport 2 KPI value scores of core KPA.
Fig. 14. Airport 2 core KPA options ranking.
Fig. 16. Airport 2 options ranking.
Fig. 17. Value scores of the of airports group.
understanding how new performance assessments can evaluate air transport companies (LCC/Flag and air cargo) with new KPAs and KPIs. Moreover, extending the evaluation of airport performance to hinter-land components too, after all the airport is only one element in an integrated chain of multi-actors that needs to be promoted as a whole.
Acknowledgements
The authors would like to acknowledge the support provided by Bana Consulting Ltda, the use of the M-Macbeth Software and the on-line platform WISED allowing this work to exist.
Appendix A. Step by step example on how to obtainfinal airport score with GDS model Step– structuring
KPI performance descriptor:
To define each KPI performance descriptor, we analyse the KPI data from a time-span. Table A. 1
Waste recycling KPI data.
Source: Own elaboration based on airport data 2003–2013.
Options 2003 2004 2005 2006 2007 2008 2009 2010 2011 2012 2013
Waste Recycling 5,78 7,57 10,17 9,39 11,48 14,56 19,46 23,95 30,84 19,11 13,33
It is possible to identify inTable A. 1, 2011 (30,84) as the best year and 2003 (5,78) as the worst one. With this information, the performance descriptor is built as shown inTable A. 2.
Table A. 2
Waste recycling KPI performance descriptor.
Source: Own elaboration based on airport data 2003–2013. Waste Recycling L4 (Target) A = 30,84 L3 B = 22,49 L2 C = 14,13 L1 (Neutral) D = 05,78 Step– survey
From the application of the survey, we obtain three outputs: Criteria judgement matrix, key performance indicators status quo and key per-formance areas status quo.
Criteria judgement matrix Table A. 3
Waste recycling KPI criteria judgement.
Source: Own elaboration based on online survey. Waste Recycling AD AC BD AB BC CD No Difference 0 0 0 1 1 1 Very Weak 0 0 1 0 1 1 Weak 1 1 2 3 3 2 Moderate 1 3 1 1 1 1 Strong 2 2 3 3 2 3 Very Strong 3 2 1 0 0 0 Extreme 1 0 0 0 0 0
Weighted Arithmetic Mean 4,25 3,63 3,13 2,63 2,25 2,50
Table A. 3depicts the expert's answers to question 8 of the survey. These results will be later used to obtain the value function. (Note: each KPI of the model follow this process).
Key performance indicators status quo Table A. 4
KPI of environmental KPA judgements.
Source: Own elaboration based on online survey. Carbon Footprint per Passenger Waste Recycling Waste Reduction Percentage Renewable Energy Purchased by the Airport (%)
Utilities/Energy Usage per Square Meter of Terminal
Water Consumption per Passenger Very Weak 0 0 0 0 0 0 Weak 0 1 0 0 0 1 Moderate 0 1 2 1 2 4 Strong 0 3 5 5 5 1 Very Strong 6 2 0 2 0 1 Extreme 2 1 1 0 1 1 Weighted Arithmetic Mean 5,25 4,13 4,00 4,13 4,00 3,63
All Worst Very Strong Strong Strong Strong Strong Moderate-Strong
Table A. 5
Status quo of each KPI of environmental KPA. Source: Own elaboration based on online survey.
Environmental Status Quo
Carbon Footprint per Passenger 5,25
Waste Recycling 4,13
Renewable Energy Purchased by the Airport (%) 4,13
Waste Reduction Percentage 4,00
Utilities/Energy Usage per Square Meter of Terminal 4,00
Water Consumption per Passenger 3,63
Table A. 4andTable A. 5, depict the experts’ answers to question 7 of the survey. These results are later used to build KPI judgement matrix and weight ponderation. (Note: each KPA of the model follow this process).
Key performance areas status quo Table A. 6
KPA Judgements.
Source: Own elaboration based on online survey.
Core Safety and
Security Service Quality Productivity/Cost Effectiveness Financial/ Commercial Environmental Very Weak 0 1 0 0 1 2 Weak 2 2 1 1 2 26 Moderate 6 4 12 9 16 17 Strong 22 13 41 28 24 18 Very Strong 30 37 16 40 32 11 Extreme 21 24 11 3 6 7 Weighted Arithmetic Mean 4,77 4,91 4,30 4,43 4,26 3,38
Status Quo Strong-Very
Strong
Strong-Very Strong
Table A. 7
Status quo of each KPA.
Source: Own elaboration based on online survey.
Key Performance Areas Status Quo
Safety and Security 4,91
Core 4,77
Productivity/Cost Effectiveness 4,43
Service Quality 4,30
Financial/Commercial 4,26
Environmental 3,38
Table A. 6andTable A. 7, depict the expert's answers to question 6 of the survey. These results will be later used to build KPA judgement matrix and weight ponderation.
Step– evaluation
This step uses the outputs of previous step 1 and 2 to build the value functions, judgment matrices and to determine weights ponderations. Value function
Table A. 8depicts an example of a judgment matrix that can be constructed for each one of the KPI. Using the performance descriptor inTable A. 2(L4-L1) and the expert's judgments collected inTable A. 3(AB, AC, AD, BC, BD and CD) it is possible to create waste recycling judgment matrix. Table A. 8
Waste recycling judgment matrix
Source: Own elaboration based on online survey. Waste Recycling
Performance descriptor Judgment matrix
L4 A 30,84 B 22,49 C 14,13 D 5,78
L3 B 22,49 A 30,84 (AB) Weak-Moderate (AC) Moderate-Strong (AD) Strong
L2 C 14,13 B 22,49 (BC) Weak (BD) Moderate
L1 D 5,78 C 14,13 (CD) Weak
Applying MACBETH mathematical foundations, from the matrix onTable A. 8we obtain the value function for this KPI, as shown inFig. A. 1.
Fig. A. 1. Waste recycling value function.
Key performance indicators judgement matrix and weights ponderation
This matrix (Table A. 9) is built for each one of the KPA using the expert's judgments collected inTable A. 4andTable A. 5.
Table A. 9
Environmental KPI's judgment matrix.
Source: Own elaboration based on online survey. Waste
Recycling
Renewable Energy Purchased by the Airport (%)
Waste Reduction Percentage
Utilities/Energy Usage per Square Meter of Terminal
Water Consumption per Passenger All Worst Carbon Footprint per Passenger Very Weak-Weak
Very Weak-Weak Very
Weak-Weak
Very Weak-Weak Weak Very
Strong Waste
Recycling
No Very Weak Very Weak Very Weak Strong
Renewable Energy Purchased by the Airport (%)
Very Weak Very Weak Very Weak Strong
Waste Reduction Percentage
No Very Weak Strong
Utilities/Energy Usage per Square Meter of Terminal
Very Weak Strong
Water
Consumption per Passenger
Moderate-Strong
Applying MACBETH mathematical foundations approach (Bana e Costa et al., 2016), (Bana e Costa et al., 2012), (C.Bana e Costa and Vansnick, 1994) from the matrix inTable A. 5we obtain the weights ponderation for each KPI, as shown inTable A. 10. (Note: each KPA of the model follow this process).
Table A. 10
KPI weight ponderation of environmental KPA. Source: Own elaboration based on online survey.
Key Performance Indicators Current Scale Weight
Carbon Footprint per Passenger 7 21,21%
Waste Recycling 6 18,18%
Renewable Energy Purchased by the Airport (%) 6 18,18%
Waste Reduction Percentage 5 15,15%
Utilities/Energy Usage per Square Meter of Terminal 5 15,15%
Water Consumption per Passenger 4 12,12%
Key performance areas judgement matrix and weights ponderation
This matrix (Table A. 11) is built using the expert's judgments collected inTable A. 6andTable A. 7. Table A. 11
Airport KPA's judgment matrix.
Source: Own elaboration based on online survey. Core Productivity/Cost Effectiveness Service Quality Financial/ Commercial
Environmental Status Quo
Safety and Security Very Weak Very Weak Very Weak Very Weak Weak Strong-Very
Strong
Core Very Weak Very Weak Very Weak Very
Weak-Weak
Strong-Very Strong Productivity/Cost
Effectiveness
Very Weak Very Weak Very
Weak-Weak
Strong Service
Quality
No Very Weak Strong
Very Weak Strong
Table A. 11 (continued) Core Productivity/Cost Effectiveness Service Quality Financial/ Commercial
Environmental Status Quo
Financial/ Commercial
Environmental Moderate
Applying MACBETH mathematical foundations approach (Bana e Costa et al., 2016), (Bana e Costa et al., 2012), (C.Bana e Costa and Vansnick, 1994) from the matrix inTable A. 11, we obtain the weights ponderation for each KPA, as shown inTable A. 12.
Table A. 12
KPA weight ponderation.
Source: Own elaboration based on online survey.
Key Performance Areas Current Scale Weight
Safety and Security 9 21,95%
Core 8 19,51% Productivity/Cost Effectiveness 7 17,07% Service Quality 6 14,63% Financial/Commercial 6 14,63% Environmental 5 12,20% Step– classifications
This step uses the outputs of step 4 to obtain thefinal scores for each KPI, each KPA and airport overall score. Value scores
With the value function shown inFig. A. 1, we obtain the KPI scores asTable A. 13depicts. (Note: each KPI of the model follow this process). Table A. 13
Waste recycling scores.
Source: Own elaboration based on online survey. Waste recycling scores
Options 2003 2004 2005 2006 2007 2008 2009 2010 2011 2012 2013
Scores 0 7,14 17,52 14,41 22,75 35,04 54,59 72,51 100 53,19 30,13
KPA scores
Multiplying each KPI scores (Table A. 13) with each KPI weights ponderation (Table A. 10) and then summing all these results, we obtain the KPA score for each year (option), asTable A. 14depicts. (Note: each KPA of the model follow this process).
Airport scores
Multiplying each KPA scores (Table A. 14) with each KPA weights ponderation (Table A. 12) and then summing all these results, it is obtained the airport score for each year (option) with the correspondent performance level of the categorical threshold, asTable A. 15depicts.
Appendix B. Mathematical elements of the GDS multi-criteria value model
The mathematical elements of the GDS multi-criteria value model built are as follows (Bana e Costa et al., 2016), (Bana e Costa et al., 2012),(C. Bana e Costa and Vansnick, 1994):
Leth=1, …, m designate the KPA, jh=1 ,h …,nh the KPI of KPA h, Xjh the performance descriptor of the KPI jh andvjh: Xjh→ R the
respective value scale. For a given performance assessment and for a given KPA h, let xjhbe the airport's performance on KPI jhof h and ⎜⎛ ⎟ ⎝ ⎞ ⎠ vj xj h h the Table A. 14
Environmental KPA scores. The darker shade is, the worse results (from 0 to 40 points) when in color this is red; the medium shade is medium values (from 40 to 60 points) when in color this is yellow, and the lighter shade is the best results (from 60 to 100 points) when in color this is green.
Source: Own elaboration based on online survey.
Table A. 15
Airport 1 scores and correspondent performance level. The darker shade is, the worse results (from 0 to 40 points) when in color this is red; the medium shade is medium values (from 40 to 60 points) when in color this is yellow, and the lighter shade is the best results (from 60 to 100 points) when in color this is green.
respective value score; x1h, …, xjh, …, xnhand … ⎜ ⎟ ⎛ ⎝
⎞ ⎠
v1h(x1h), , vjh xjh , .. . , vnh( )xn, are the airport performance and value profiles respectively. The
partial value scores of the airport performance and the overall value are given by the simple additive model Eq.(B.1)and the hierarchical additive model Eq.(B.2):
∑
⎜ ⎟ ⎜ ⎟ ⎜ ⎟ ⎜ ⎟ ⎛ ⎝ … … ⎞ ⎠ = ⎛ ⎝ ⎞ ⎠ ⎧ ⎨ ⎪ ⎪ ⎩ ⎪ ⎪ ⎛ ⎝ ⎞ ⎠ = ⎛ ⎝ ⎞ ⎠ = v x x x k v x with v target v neutral , , , , 100, 0, h j n j j j j j j j j 1h h h h h h h h h h h (B.1)∑
∑
⎜ ⎟ = ⎛ ⎝ ⎜ ⎛ ⎝ ⎞ ⎠ ⎞ ⎠ ⎟ v airport overall( ) k k v x , h h j j j j h h h h (B.2) weretargetjh and neutraljhare the“target” and “neutral” reference levels of the KPI jh; and kjh and kh are weights assign to the KPI and KPA respectively, such that ∑jhkjh=1andkjh>0and ∑hkh=1andkh>0, for all j and all h.References
ACI - Airport Council International, 2012. Guide to Airport Performance Measures. Montreal | Quebec | H4Z1G8 | Canada.
ACI - Airports Council International, 2006. Airport Benchmarking to Maximise Efficiency, World Economics. ACI WORLD HEADQUARTERS, Geneva– Switzerland. Adler, N., Liebert, V., Yazhemsky, E., 2013. Benchmarking airports from a managerial
perspective. Omega 41, 442–458.https://doi.org/10.1016/j.omega.2012.02.004. Baltazar, M.E., Jardim, J., Alves, P., Silva, J., 2014. Air transport performance and
effi-ciency: MCDA vs. DEA approaches. Procedia - Soc. Behav. Sci. 111, 790–799.https:// doi.org/10.1016/j.sbspro.2014.01.113.
Bana e Costa, C.A., de Corte, J.-M., Vansnick, J.-C., 2017. M-MACBETH Version 3.2.0 (Beta) User's Guide. [WWW Document]. URL. http://m-macbeth.com/wp-content/ uploads/2017/10/M-MACBETH-Users-Guide_BETA.pdf(accessed 1.31.18). Bana e Costa, C.A., de Corte, J.-M., Vansnick, J.-C., 2016. On the mathematical
founda-tions of MACBETH. In: International Series in Operafounda-tions Research and Management Science, pp. 421–463.https://doi.org/10.1007/978-1-4939-3094-4_11.
Bana e Costa, C.A., de Corte, J.-M., Vansnick, J.-C., 2012. Macbeth. Int. J. Inf. Technol. Decis. Mak 11, 359–387.https://doi.org/10.1142/S0219622012400068. Bana e Costa, C.A., Vansnick, J.-C., 1994. MACBETH— an interactive path towards the
construction of cardinal value functions. Int. Trans. Oper. Res. 1, 489–500.https:// doi.org/10.1016/0969-6016(94)90010-8.
Chang, Y.-H., Yeh, C.-H., 2004. A new airline safety index. Transp. Res. Part B Methodol. 38, 369–383.https://doi.org/10.1016/S0191-2615(03)00047-X.
Choo, Y.Y., Oum, T.H., 2013. Impacts of low cost Carrier services on efficiency of the major U.S. airports. J. Air Transport. Manag. 33, 60–67.https://doi.org/10.1016/j. jairtraman.2013.06.010.
D'Alfonso, T., Daraio, C., Nastasi, A., 2015. Competition and efficiency in the Italian airport system: new insights from a conditional nonparametric frontier analysis. Transport. Res. Part E Logist. Transp. Rev. 80, 20–38.https://doi.org/10.1016/j.tre. 2015.05.003.
Fodness, D., Murray, B., 2013. Passengers' expectations of airport service quality. J. Serv. Market.
Francis, G., Humphreys, I., Fry, J., 2002. The benchmarking of airport performance. J. Air Transport. Manag. 8, 239–247.https://doi.org/10.1016/S0969-6997(02)00003-0. Grampella, M., Martini, G., Scotti, D., Tassan, F., Zambon, G., 2017. Determinants of
airports' environmental effects. Transport. Res. Transport Environ. 50, 327–344. https://doi.org/10.1016/j.trd.2016.11.007.
Hooper, P., Hensher, D., 1997. Measuring total factor productivity of airports— an index number approach. Transport. Res. Part E Logist. Transp. Rev. 33, 249–259.https:// doi.org/10.1016/S1366-5545(97)00033-1.
Lai, P.L., Potter, A., Beynon, M., 2012. The development of benchmarking techniques in airport performance evaluation research. Transport. J. 51, 305–337.https://doi.org/ 10.5325/transportationj.51.3.0305.
Liebert, V., Niemeier, H.-M., 2013. A survey of empirical research on the productivity and efficiency measurement of airports. J. Transport Econ. Pol. 47, 157–189. Liebert, V., Niemeier, H.-M., 2010. Benchmarking of airports - a critical assessment 1
introduction. In: 12th World Conf. Transp. Reasearch Lisbon Port, pp. 1–46. Lin, F., Choo, Y., Oum, T.H., 2013. Efficiency benchmarking of North american Airports :
comparative results of productivity index. Data Envelopment Analysis and Stochastic Frontier Analysis 52, 47–67.
Lozano, S., Gutiérrez, E., 2011. Slacks-based measure of efficiency of airports with air-planes delays as undesirable outputs. Comput. Oper. Res. 38, 131–139.https://doi. org/10.1016/j.cor.2010.04.007.
MacLean, L., Richman, A., MacLean, S., 2016. Benchmarking airports with specific safety performance measures. Transport. Res. Part A Policy Pract 92, 349–364.https://doi. org/10.1016/j.tra.2016.06.016.
Martín, J.C., Román, C., 2001. An application of DEA to measure the efficieny of Spanish airports prior to privatization. J. Air Transport. Manag. 7, 149–157.https://doi.org/ 10.1016/S0969-6997(00)00044-2.
Martini, G., Manello, A., Scotti, D., 2013a. The influence of fleet mix, ownership and LCCs on airports' technical/environmental efficiency. Transport. Res. Part E Logist. Transp. Rev. 50, 37–52.https://doi.org/10.1016/j.tre.2012.10.005.
Martini, G., Scotti, D., Volta, N., 2013b. Including local air pollution in airport efficiency assessment: a hyperbolic-stochastic approach. Transport. Res. Transport Environ. 24, 27–36.https://doi.org/10.1016/j.trd.2013.05.002.
Oum, T.H., Yan, J., Yu, C., 2008. Ownership forms matter for airport efficiency: a sto-chastic frontier investigation of worldwide airports. J. Urban Econ. 64, 422–435. https://doi.org/10.1016/j.jue.2008.03.001.
Oum, T.H., Yu, C., 2004. Measuring airports' operating efficiency: a summary of the 2003 ATRS global airport benchmarking report. Transport. Res. Part E Logist. Transp. Rev. 40, 515–532.https://doi.org/10.1016/j.tre.2004.08.002.
Oum, T.H., Yu, C., Fu, X., 2003. A comparative analysis of productivity performance of the world's major airports: summary report of the ATRS global airport benchmarking research report - 2002. J. Air Transport. Manag. 9, 285–297.https://doi.org/10. 1016/S0969-6997(03)00037-1.
Pathomsiri, S., Haghani, A., Dresner, M., Windle, R.J., 2008. Impact of undesirable out-puts on the productivity of US airports. Transport. Res. Part E Logist. Transp. Rev. 44, 235–259.https://doi.org/10.1016/j.tre.2007.07.002.
Pels, Eric, Verhoef, Erik., 2003. The Economics of Airport Congestion Pricing (No. Tinbergen Institute Discussion Paper No. 03-083/3).
Pels, E., Nijkamp, P., Rietveld, P., 2003. Inefficiencies and scale economies of European airport operations. Transport. Res. Part E Logist. Transp. Rev. 39, 341–361.https:// doi.org/10.1016/S1366-5545(03)00016-4.
Perelman, S., Serebrisky, T., 2012. Measuring the technical efficiency of airports in Latin America. Util. Pol. 22, 1–7.https://doi.org/10.1016/j.jup.2012.02.001.
Pestana Barros, C., Dieke, P.U.C., 2007. Performance evaluation of Italian airports: a data envelopment analysis. J. Air Transport. Manag. 13, 184–191.https://doi.org/10. 1016/j.jairtraman.2007.03.001.
Phillips, L.D., Bana e Costa, C.A., 2007. Transparent prioritisation, budgeting and re-source allocation with multi-criteria decision analysis and decision conferencing. Ann. Oper. Res. 154, 51–68.https://doi.org/10.1007/s10479-007-0183-3. Rivasplata, C.R., 2013. Congestion pricing for Latin America: prospects and constraints.
Res. Transport. Econ. 40, 56–65.https://doi.org/10.1016/j.retrec.2012.06.037. Sarkis, J., 2000. Analysis of the operational efficiency of major airports in the United
States. J. Oper. Manag. 18, 335–351.https://doi.org/10.1016/S0272-6963(99) 00032-7.
Sarkis, J., Talluri, S., 2004. Performance based clustering for benchmarking of US air-ports. Transport. Res. Part A Policy Pract 38, 329–346.https://doi.org/10.1016/j.tra. 2003.11.001.
Scotti, D., Dresner, M., Martini, G., Yu, C., 2014. Incorporating negative externalities into productivity assessments of US airports. Transport. Res. Part A Policy Pract 62. https://doi.org/10.1016/j.tra.2014.02.008.
Tovar, B., Martín-Cejas, R.R., 2010. Technical efficiency and productivity changes in Spanish airports: a parametric distance functions approach. Transport. Res. Part E Logist. Transp. Rev. 46, 249–260.https://doi.org/10.1016/j.tre.2009.08.007. Tsai, W.-H., Hsu, W., Chou, W.-C., 2011. A gap analysis model for improving airport
service quality. Total Qual. Manag. Bus. Excel. 22, 1025–1040.https://doi.org/10. 1080/14783363.2011.611326.
Xiao-yu, Z., Jiu-sheng, C., 2012. Decision model offlight safety based on flight event. Phys. Procedia 33, 462–469.https://doi.org/10.1016/j.phpro.2012.05.090. Yan, J., Oum, T.H., 2014. The effect of government corruption on the efficiency of US
commercial airports. J. Urban Econ. 80, 119–132.https://doi.org/10.1016/j.jue. 2014.01.004.
Yu, M.-M., 2004. Measuring physical efficiency of domestic airports in Taiwan with un-desirable outputs and environmental factors. J. Air Transport. Manag. 10, 295–303. https://doi.org/10.1016/j.jairtraman.2004.04.001.
Yu, M.-M., Hsu, S.-H., Chang, C.-C., Lee, D.-H., 2008. Productivity growth of Taiwan's major domestic airports in the presence of aircraft noise. Transport. Res. Part E Logist. Transp. Rev. 44, 543–554.https://doi.org/10.1016/j.tre.2007.01.005.