ABSTRACT: In order to improve the reliability of aviation airline network, this paper presents an empirical analysis on the airline network structure of an aviation company in China from the perspective of complex network, and the calculation result of the statistical features and degree distribution of the network, proves that the network is a small-world network and a scale-free network. Four indicators, i.e. degree, closeness, vertex betweenness and low betweenness, are utilized for aviation network centralization so as to distinguish the most appropriate method. The inluence of nodes in local network is to be measured through the indicators. The results show that vertex betweenness can achieve the best aviation network centralization effect. Speciically, the centrality degree reaches 95.87%. On this basis, the network reliability is analyzed to discover that when two nodes with maximum degree or maximum betweenness are removed, the network performance is reduced by a half. Eventually, countermeasures are proposed for further improvement according to the results. In other words, complex network method is feasible used to analyze the topological structure and statistical features of aviation network. Based on this, a study is conduced to the network reliability and suggestions are proposed for optimizing the aviation network.
KEYWORDS: Complex network, Aviation network, Scale-free property, Reliability.
Reliability Analysis for Aviation Airline
Network Based on Complex Network
Dong Bing1,2INTRODUCTION
Aviation network refers to an airline system constituted by airlines connected in a certain way in a district, serving as a basis for the production and development of the airline company. In the studies on aviation network with network research methods, it is found that the aviation network has relevant statistical features (Guimera and Amaral, 2004; Guimera et al., 2005; Barrat et al., 2004) of “small-world network”. However, most studies (Barrat et al., 2005) focus on the analysis on physical statistical features of aviation network structure and the evolution of overall topological structure, while only a few studies are made on the analysis of route network with social network methods (Porta et al., 2006). Since there are signiicant diferences between aviation network nodes, it is particularly necessary to conduct comparative analyses on relevant nodes and studies on centrality of aviation network. he concept of network centrality can be traced back to the idea of applied statistics in the 19th Century (Gaertler and Wagner, 2001). Typically, diferent centrality indicators are required for centralization for diferent types of networks, and the multiple centrality study method needs to be applied in combination with parameters. In China, some scholars adopt other theories and methods to study the centrality of aviation network (Dang and Li, 2011). For instance, some scholars use rank-size model to measure the air transport concentration degree so as to assess the position of hub airports; some scholars mainly adopt the dominant low method supplemented by squared Euclidean distance method and distance-based cluster method to analyze the level and change of major cities in China in domestic passenger aviation network, based on the air passenger statistical data; moreover, some scholars (Porta et al., 2006) employ the Geographic Information System (GIS) method to study the spatial pattern
1.Southwest Jiaotong University – Chengdu/Sichuan – China 2.Civil Aviation Flight University of China – Guanghan – Deyang/Sichuan – China
Author for correspondence: Dong Bing | School of Trafic and Transportation | Southwest Jiaotong University | 610031 Chengdu/Sichuan – China | Email: [email protected]
of the domestic aviation network airport system on the basis of air low data.
With the development of the civil aviation industry in China, the air transport network keeps booming in scale. Nevertheless, it still sufers imperfection, low reliability and low operation efficiency. On the airline company’s side, while planning aviation network, network planners basically conduct decision analysis according to experience. hey only take the demand for a single airline as the primary indicator for assessing the necessity of launching an airline. Besides, they oten select airlines that are basically the same in route of airlines beneiting other companies while neglecting the network reliability and its overall synergistic efect. he safety and reliability of aviation network exert on an important impact on market competitiveness and economic beneits of an airline company. herefore, the aviation network should be planned in a systematical manner to improve its overall synergistic efect. A complex network method is proposed to analyze the topological structure and statistical features of aviation network by taking China Southern Airlines (CSA) as an example. Based on this, a study is conduced to the network reliability and suggestions are proposed for optimizing the aviation network of CSA.
COMPLEX NETWORK PROCESSING METHODS AND RELATED RESEARCH
As a small world model and a scale-free network model were proposed in the end of the 20th century, the complex network gradually became the research hotspot in diferent discipline. In order to facilitate the study of complex network efectively, all kinds of research sotware are introduced, such as Pajek, Ucinet, NetworkX and NetMiner 3.
In this paper, Ucinet is used for airline network. Ucinet is a social network analysis program developed by Steve Borgatti, Martin Everett and Lin Freeman. he program is distributed by analytic technologies. he sotware Ucinet involves, in the network analysis, programs such as community discovery and region analysis, ego network analysis and the hole structure analysis and so on. It also contains a large number of analysis programs, such as cluster analysis, multidimensional scaling, singular value decomposition, factor analysis and correspondence analysis, the role and status analysis, including structure, and the role and regular equivalence.
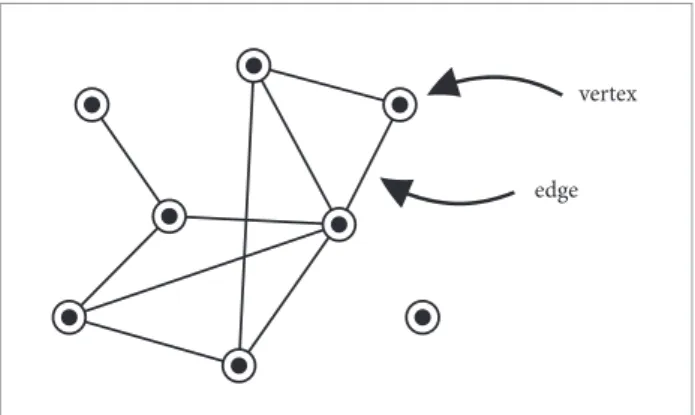
In this paper, we take airline passenger flow data as samples, the city for the network nodes, routes between cities as the network edge, aviation passenger low between cities as
the mapping relationship between node and nodes in the network structure and construction of air traffic network, as shown in Fig. 1:
Figure 1. Network structure and construction of air
trafic network.
vertex
edge
Based on Ucinet sotware, two kinds of simulation systems were introduced (Hongguang and Liping, 2012), the deliberate targeting system and random interference system are designed, and some simulation experiments are done. The structure diagrams of air passenger low network are plotted with the sotware (Dang and Li, 2010) and analyzed from the perspective of structural characteristics, degree of distribution and network centrality. However, traditional research methods fail to thoroughly identify the complexity of aviation network spatial relations between airports in a proper way. Centrality tests for network nodes are important means for judging the importance of nodes in the network, adjusting the aviation layout, and optimizing resource allocation, which, in particular, is greatly signiicant for safety of aviation network.
the aviation network, Kij, in the matrix, refers to the number of lights from Airport i to Airport j. Due to data limitation, the network in this paper is an undirected one. hat is, out-degree and in-degree are not involved.
STATISTICAL FEATURE AND THE DEGREE OF DISTRIBUTION
According to the statistics, there are 187 nodes and 1,245 edges. It is thus evident that the aviation network is concentrated and its structure is relatively complex. To show network hierarchical relationship, a backbone aviation network of CSA is built. he node weight threshold is taken as 500 in the weighted network. According to the statistics, there are 99 nodes and 369 edges.
In the complex network theory (Newman, 2003), the indicators relecting the statistical features of network structure are mainly degree of nodes, average degree, average path length, density, clustering coeicient, etc.
The relation matrix (aij) is built for the aviation network, in which aijindicates the relation of flight numbers between city i and city j: if there are any flights between city i
and city j, aij = 1; otherwise, aij = 0. Upon calculation, the statistical feature indicators of 2010 aviation network of CSA are listed in Table 1.
the network. According to Table 1, the average degree is 6.684, indicating that, in average, each city node is connected to other 6.684 city nodes.
Table 1. Statistical features of 2010, CSA aviation network.
Project Statistical Value
1 Number of Nodes 187
2 Degree of Node 1250
3 Average Degree 6.684
4 Average Path Length 2.558
5 Network Density 0.0358
6 Clustering Coeicient 0.592
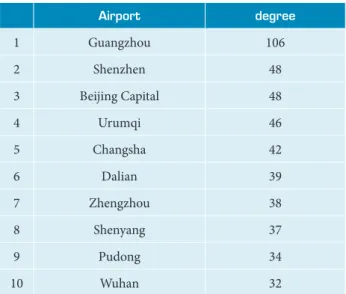
Table 2. Top 10 degree values of CSA airports, in 2010.
Airport degree
1 Guangzhou 106
2 Shenzhen 48
3 Beijing Capital 48
4 Urumqi 46
5 Changsha 42
6 Dalian 39
7 Zhengzhou 38
8 Shenyang 37
9 Pudong 34
10 Wuhan 32
he degree of a node in an aviation network refers to the number of airports having direct flights with this airport (node); greater degree of a node means greater importance to some extent. Table 2 shows CSA ten airports with top degrees in 2010, among which Guangzhou ranks the irst of airport degree as an airline hub of CSA. The average degree of a network refers to the average value of all degrees of nodes in
Generally, the distance between two nodes is deined as the number of edges of the shortest path between two nodes, and the average path length of a network is the average value of the distances between all node pairs. In an aviation network, the distance describes the path from one airport to another one using the minimum transit times; the shorter the distance is, the less transit times are required. Meanwhile, the average path length stands for the depth of the air transport, which is a property of the transport shortcut in the integral network; the shorter the average path length is, the less transit times are required between any two airports, bringing more convenience for the passengers. In 2010, the average path length of CSA aviation network is 2.558, which means only 1.558 transit times are required for transporting from one airport to another, favorably meeting the air transport demand.
are closer. In 2010, the density of aviation network is 0.0358, which is relatively small, indicating that the connections are not very strong among CSA airports.
he clustering coeicient of a node in the network stands for the ratio of the actual connection number to the maximum possible connection edges between this node and its adjacent nodes. In an aviation network, the clustering coeicient of a node indicates the average cluster degree of the local network comprised of the airport and its adjacent airports. Higher clustering coeicient means greater cluster degree of the local network, and smaller impact of this node on the adjacent airports; on the contrary, lower value means more dependence of the adjacent airports on this node. Guangzhou Airport has a clustering coeicient of 0.06, which is the smallest of all, indicating that the adjacent airports are highly dependent on Guangzhou Airport, and large numbers of lights will be afected if failure occurs in Guangzhou Airport. he clustering coeicient of the integral network is the average value of the clustering coeicients of all city nodes. As shown in Table 1, CSA aviation network, in 2010, has relatively small average shortest path length and large clustering coeicient; hence this aviation network belongs to a small-world network.
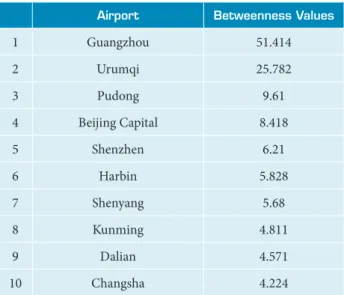
Betweenness is generally deined as the capability of a node for controlling the connection of other node pairs, i.e., the efect of a node acting as a bridge between other node pairs. Higher betweenness of a node indicates stronger efect of the node as a bridge, and more important role in the network. See Table 3 for
the betweennesses of top 10 airports of CSA Aviation Network in 2010, based on which Guangzhou Airport, as a CSA hub, has the maximum degree and betweenness, taking up the most important position in the network. Secondly, Urumqi, Beijing Capital and Shenzhen Airports also play prominent roles as bridges. Speciically, Pudong Airport ranks third in the betweenness value; although its degree value is not particularly high, it is still a signiicant transit in the network. If a fail occurs in important transit airports mentioned above, the connections will be greatly afected between other nodes.
he degree distribution of the nodes in the network can be described in the power-law distribution function;
p(k)=k-α (1)
he power-law distribution coeicient α shows the degree distribution characteristics of a network(Newman, 2003). he distribution p(k) is the probability of a randomly selected node of degree k.
Power-law distribution is also known as scale-free distribution; a scale-free network is a network whose degree distribution follows a power law. In the log-log plot, a straight line with negative slope can be obtained by conducting a linear itting for the degree distribution, and the absolute value of slope is the power exponent. If the absolute value is relatively small, this network is scale-free. Correlation coeicient indicates the itting degree of the curve; higher correlation coeicient means the curve is more favorably itted, explaining actual problems more adequately. he degree distribution of undirected network is discussed here. By applying a double-segment itting in the log-log plot, we obtained the power exponent and correlation coeicient variance of the degree distribution (Table 4), and degree distribution (Fig.2) of CSA aviation network in, 2010.
Based on Table 3 and Fig. 2 , at the signiicance level of
α=0.0001, Segment 1 and Segment 2 both have excellent itting, with correlation coeicient exceeding 0.96. Since Segment 1 and Segment 2 both have relatively small power exponents, the degree distribution of CSA aviation network is subject to double-segment power-law distribution, and thus this network is scale-free. Hence, the nodes in the aviation network are heterogeneous, certain nodes (hubs) have large numbers of connections, playing the dominant role in the network, while other large number of nodes only have small numbers of connections and are located on the edge of the network, according to the Matthew Efect.
Table 3. Betweenness values of top 10 airports of CSA
aviation network, in 2010.
Airport Betweenness Values
1 Guangzhou 51.414
2 Urumqi 25.782
3 Pudong 9.61
4 Beijing Capital 8.418
5 Shenzhen 6.21
6 Harbin 5.828
7 Shenyang 5.68
8 Kunming 4.811
9 Dalian 4.571
Where, W refers to the whole network,
represents the centrality value of the node with the largest centrality degree.
According to the equation, if the centrality of all nodes is the same, namely the network has no center, then . In case the centrality degree of only one node is of 1 and that of other nodes is 0, will be greater, and the handful of center nodes will be more prominent, which shows that the larger the centrality diference between network nodes, the higher the centrality indicators of the handful of center nodes. hus, the accuracy of center nodes will be higher, and so will the centrality degree.
Diferent network centrality (Friedkin, 1991; Newman, 2005) degrees can be igured out by substituting degree, closeness, vertex betweenness and low betweenness into the following equations respectively.
(3)
Where CD(x), CC(x), CB(x), and CFB(x) represents the degree, closeness, vertex betweenness and low betweenness indicator values of network nodes, respectively. In contrast, the degree indicator is more suitable for measuring the inluence of nodes in local network. In global scope, however, the closeness indicator needs to be referenced. he two indicators are only applicable to static network analysis, while the betweenness indicator is more suitable for analysis of dynamic network. When the degree, closeness, vertex betweenness and low betweenness indicators are used for aviation network centralization based on the formula above, the centrality degree under the diferent indicators is shown in Table 3.
Obviously, the centrality degree varies with the selected centrality indicators for network centralization. he centrality degree of closeness is relatively low, which indicates that closeness is not suitable for aviation network centralization. Moreover, the
Figure 2. Node degree distribution of CSA aviation
network, in 2010.
2
slope= -0.55094
Kβ=27
log
P
(
k
)
0
log k 2
slope= -1.53157
0
Table 4. Feature values of degree distribution of domestic
light network.
Project Statistical Value
1 Number of
Nodes(N) 187
2 Degree of
Nodes(k) 1250
3 Fitting of
Segment 1
Power Exponent(|α|) 0.55094
Correlation
Coeicient(|ACC|) 0.55094
4 Fitting of
Segment 2
Power Exponent(|α|) 1.53157
Correlation
Coeicient(|ACC|) 0.96051
COMPARISON OF CENTRALITY DEGREE UNDER DIFFERENT INDICATORS
Relevant network centrality indicators serve as the basis for measuring the centrality degree of the network. On the assumption that centrality indicators have been deined in Network CA with n nodes, the centrality degree of the network will be deined as follows (Costenbader and Valente, 2003):
top 10 nodes in the aviation network are selected to catch the distribution of indicator values for each node, as shown in Fig. 2. herefore, degree and closeness fail to obviously distinguish nodes, while the diference of distributions of betweenness is relatively large. hrough calculating the centrality degree of each indicator, and comparing the cumulative distribution of centrality data of top 10 nodes, vertex betweenness is the most suitable indicator for aviation network centralization.
NETWORK RELIABILITY ANALYSIS
here are a lot of network attack means in reality (Barrat et al., 2005; Holme et al., 2002; Kai-Quan et al., 2012; Li and Cai, 2012), where the random attack and the hostile attack are relatively representative, and the hostile attack is very destructive. As it was demonstrated before, the aviation network of CSA is a scale-free one, with associate scale-free properties, such as “Stable and Fragile” in attacks, which means it has a very strong lexibility in random attacks or unexpected malfunctions while it is very fragile in hostile attacks (Xiaohuan Wu et al., 2013).
The most important indicators to characterize the network topologic structure are the average path length and the clustering coefficient. The average path length in the aviation network represents air transport depth, the clustering coefficient represents air transport width, and the network efficiency represents overall coordination of the network. With a smaller average path length of the network, a bigger clustering coefficient, and higher network efficiency, it is indicated that the network has a better performance and a stronger fault-tolerant capability. Therefore, this paper will have the reliability analysis on the current network of CSA with the three indicators, and the calculation formulas are as follows:
(4)
In Eq.(4) N stands for network node number, dij stands for the shortest distance from Node i to Node j.
Ci=2Ei/(ki(ki-1)) (5)
In Eq. (5) ki stands for the number of edges directly connecting with airport i, and Ei stands for the number of existing connecting edges between airports in number of ki.
(6)
In Eq.(6) with 0≤E≤1 . When E=1, the network is completely connected; and when E=0, all nodes in the network are isolated.
Airport nodes in the aviation network of CSA are sorted according to the degree and the betweenness value in descending order, and then the airport based on a relatively big degree and that, based on a relatively big betweenness, are removed orderly, the average path length, the clustering coeicient, and the network eiciency of the network are calculated respectively, and changes of the average path length, the clustering coeicient and the network eiciency corresponding to the decrease of the airport number are counted and compared, then the contents indicated in Fig.4, Fig. 5 and Table 5 are respectively obtained.
As indicated by Figs. 3 and 4, the luctuation of average path length is relatively strong when several nodes are removed, and the luctuation of average path length based on the remove policy of degree priority is stronger than the one based on the policy of
Figure 3. The cumulative distribution of centralized data
under four indicators of the top 10 nodes.
0.16 Flow Betweenness
Degree
P
0
Rank 2
Closeness
1 0.18
0.14 0.12 0.10 0.08 0.06 0.04 0.02
4
3 5 6 7 8 9 10
Vertex Betweenness
Figure 4. Comparison of average path length changes.
2 1
O
ve
r age p
ath l
en
g
th
4
3 5 6
Betweenness Priority L Betweenness Priority L
Figure 5. Comparison of clustering coeficient changes.
Betweenness Priority C
0
2 1 0.8
0.6
0.4
0.2
4
3 5 6
Degree Priority C
C
lus
te
rin
g c
o
effi
ci
en
t
Removed nodes
Table 5. Centrality degree under the different indicators of
CSA aviation network.
Indictor Centrality Degree
1 Degree CD 83.12%
2 Closeness CC 42.50%
3 Vertex Betweenness CB 95.87%
4 Flow Betweenness CFB 93.12%
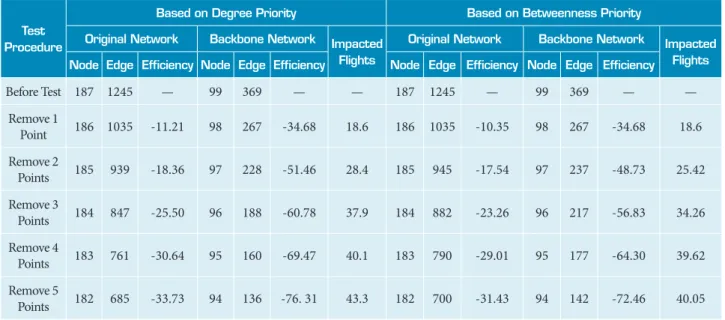
Table 6. Comparison of network eficiency changes based on two different remove policies.
Test Procedure
Based on Degree Priority Based on Betweenness Priority
Original Network Backbone Network Impacted
Flights
Original Network Backbone Network Impacted
Flights Node Edge Eficiency Node Edge Eficiency Node Edge Eficiency Node Edge Eficiency
Before Test 187 1245 — 99 369 — — 187 1245 — 99 369 — —
Remove 1
Point 186 1035 -11.21 98 267 -34.68 18.6 186 1035 -10.35 98 267 -34.68 18.6
Remove 2
Points 185 939 -18.36 97 228 -51.46 28.4 185 945 -17.54 97 237 -48.73 25.42
Remove 3
Points 184 847 -25.50 96 188 -60.78 37.9 184 882 -23.26 96 217 -56.83 34.26
Remove 4
Points 183 761 -30.64 95 160 -69.47 40.1 183 790 -29.01 95 177 -64.30 39.62
Remove 5
Points 182 685 -33.73 94 136 -76. 31 43.3 182 700 -31.43 94 142 -72.46 40.05
priority of betweenness. he average path length increases to a largest extent when Guangzhou Airport node with the greatest degree and the highest betweenness is removed, then it decreases aterwards because the network is divided into multiple connected sub-graphs, among which no connection exists. he average
path length decreases ater increasing, which is a shortcoming for measuring the network performance.
However, overall, it shows that ater the node with the greatest degree or the highest betweenness has been removed, the average path length luctuates widely, which causes the network instability. As it is indicated in Fig. 4, the clustering coeicient decreases ater several nodes are removed, and the decrease of the one based on the remove policy of degree priority is slightly larger than the one based on the betweenness priority; therefore, the clustering coeicient decreases and the clustering degree becomes smaller when the node with the greatest degree or highest betweenness has been removed from the network.
contains 99 nodes and 369 routes; when two airports with the greatest degree value (Guangzhou Airport and Shenzhen Airport) have been removed according to the irst policy, 306 routes disappear, the original network efficiency is decreased by 18.36%, the backbone network eiciency is decreased by 51.46%, and the network performance is decreased by half. When two airports with the highest betweenness (Guangzhou Airport and Urumqi Airport) are removed according to the second policy, 300 routes disappear, the original network eiciency is decreased by 17.54%, and the backbone network eiciency is decreased by 48.73%. Its decrease is slightly smaller than that of the remove policy based on the degree priority.
When two airports with the greatest degree are removed, the number of routes of the whole network in south-to-north direction is decreased substantially; when two airports with the highest betweenness are removed, most airports in the western area become isolated nodes, holding up lights, and the overall network performance is decreased by half or so. However, the network performance decreases approximately by about 25% (Dang and Li, 2011) when two nodes are removed in the America aviation network, indicating that the southern aviation network is relatively fragile when facing a selective attack and the overall network reliability is expected to be enhanced. Apart from the selective attack, the current network layout of CSA can cause heavy strike to the aviation transportation when facing random attacks, including natural disasters. herefore, while enlarging the scale of network development, CSA should also develop its aviation network into a multi-hub system. Judging from the degree value and betweenness value of the airport node, number of airlines removed from the network, and the network eiciency decrease condition, in addition to taking Guangzhou Airport as the core hub, CSA can further plan and revise its aviation network by deining Beijing as the important hub between Europe, America and the inland of China, deining Urumqi as the regional hub between the middle Asia and the inland of China. On the other hand, the Company can promote connections in east-to-west direction, for example, establishing connections between the west and the east centered in Zhengzhou to ill up the blank in this direction. In this way, the overall performance and reliability of the network can be enhanced, ensuring luent running of the air transport system.
CONCLUSION
In this paper, complex network theory is applied, an aviation network structure model is built for CSA, and its structure is analyzed. It is discovered that Guangzhou Baiyun Airport is the hub of the aviation network of CSA, the majority of airlines are in the south and north directions, the airlines in Western Region are distributed around Urumqi in a radial way. Moreover, analysis is conducted on the distribution of statistical features and degree distribution of the network, and it is proven that the aviation network of CSA is a small-world network and a scale-free network. Based on this, the reliability of the network is analyzed according to the degree and betweenness of nodes in the network. he results show that the backbone network performance will be reduced to a half, once 2 nodes are removed and it basically breaks down once 5 nodes are removed. he overall reliability of the network is far from high. herefore, CSA should put more eforts in the overall programming of the aviation network as well as the construction and management of the aviation hub, seek to develop as an multi-hub airport, launch more lights in west and east directions, reasonably allocate air transport resources, and improve the overall performance of the network so as to meet the demand of sustained and healthy development of air transport of CSA.
The Complex network method is used to analyze the topological structure and statistical features of aviation network. Based on this, the suggestions are proposed for optimizing the aviation network from the analysis of the network reliability the application of the methodology (airport planning, leet sizing, route planning, etc) isn’t mentioned in the paper. hey will be discussed in other papers.
ACKNOWLEDGEMENTS
REFERENCES
Barrat, A., Barthélemy, M., Pastor-Satoras, R. and Vespignani, A., 2004, “The Architecture of Complex Weighted Networks”, Proceedings of the National Academy of Sciences of the United States of America, Vol. 101, No.11, pp. 3747-3752.
Barrat, A., Barthélemy, M. and Vespignani, A., 2005, “The Effects of Spatial Constraints on the Evolution of Weighted Complex Networks”, Journal of Statistical Mechanic, doi:10.1088/1742-5468/2005/05/P05003.
Costenbader, E. and Valente, TW., 2003, “The Stability of Centrality Measures When Networks Are Sampled”, Social network, Vol. 25, pp.238-307.
Friedkin, N.E., 1991, “Theoretical foundations for centrality measures”, American Journal of Sociology, Vol. 96, pp. 1478-1504.
Gaertler, M. and Wagner, D., 2001, “Algorithms for representing network centrality, groups and density and clustered graph representation”, Convolution and Self- organization in Dynamical Networks, Vol. 3, pp.1-7.
Guimera, R.and Amaral, L.A.N., 2004, “Modeling the world-wide airport network”, The European Physical Journal B, Vol. 38, pp. 381-385.
Guimera, R., Mossa, S., Turtschi, A. and Amaral, L.A.N., 2005, “The Worldwide Air Transportation Network: Anomalous Centrality, Community Structure, and Cities’ Global Roles”, Proceedings of the National Academy of Sciences of the United States of America, Vol. 102, pp. 7794-7799.
Holme, P., Kim, B.J., Yoon, C.N. and Han, S.K., 2002, “Attack Vulnerability of Complex Networks”, Physical Review E, Vol. 65, pp.1-14.
Hongguang, Y. and Liping, Z., 2012, “Research on Robustness of China’s Aviation Network Based on Simulation Analysis”, Journal of Wuhan University of (Technology Transportation Science & Engineering), Vol. 36, pp. 42-46.
Kai-Quan, C., Jun, Z., Wen-Bo, D. and Xian-Bin, C., 2012, “Analysis of the Chinese Air Route Network as a Complex Network”, Chinese Physics B, Vol. 21, pp. 31-37.
Li, W. and Cai, X., 2012, “Statistical Analysis of Airport Network of China”, Physical Review E, Vol. 69, 6106-6112.
Newman, M.E.J., 2003, “The Structure and Function of Complex Networks”, SIAM Review, Vol. 45, pp. 167-225.
Newman, M.E.J., 2005, “A measure of Betweenness Centrality Based on Random Walks”, Social Networks, Vol. 27, pp. 39-54.
Porta, S., Crucitti, P. and Latora, V., 2006, “The Network Analysis of Urban Streets: A Dual Approach”, Physica A: Statistical Mechanics and its Aplications, Vol. 369, pp. 853-866.
Xiaohuan, W., Jinfu, Z., Weiwei, W. and Qiang, G., 2013, “Interval Robust Optimization of Airline Network Designing”, Journal of Southwest Jiaotong University, Vol. 48, pp. 559-564.
Dang, Y. and Li, W., 2010, “Air passenger Flow Structure Analysis with Network View”, Journal of Transportation Systems Engineering and Information Technology, Vol. 10, pp.167-174.