Rogério Barbosa Soares
Ph.D. student in Water Resources, Universidade Federal do Ceará. Technician at the Institute of Research and Economic Strategy of Ceará – Fortaleza (CE), Brazil.
Samiria Maria Oliveira Silva
Professor, Department of Hydraulic and Environmental Engineering, Universidade Federal do Ceará – Fortaleza (CE), Brazil.
Francisco de Assis
de Souza Filho
Professor, Department of Hydraulic and Environmental Engineering, Universidade Federal do Ceará – Fortaleza (CE), Brazil.
Ticiana Marinho de
Carvalho Studart
Professor, Department of Hydraulic and Environmental Engineering, Universidade Federal do Ceará – Fortaleza (CE), Brazil.
Renata Locarno Frota
Ph.D. student in Water Resources, Universidade Federal do Ceará – Fortaleza (CE), Brazil.
Correspondence address: Rogério Barbosa Soares – Rua 1 H, 120 – Parque Tabapuá – CEP: 61635-100 – Caucaia (CE), Brazil – E-mail: [email protected] Received on: 09/13/2019 Accepted on: 07/01/2020
ABSTRACT
This research aimed at evaluating groundwater vulnerability to agrochemical contamination. To that end, we developed an index called Hydric Vulnerability and Agrochemical Contamination Index (HVACI), which integrates a geographic information system and fuzzy logic to measure catchment vulnerability to agrochemical contamination. Our case study investigates two sub-basins, the Baixo Jaguaribe and the Médio Jaguaribe, in the state of Ceará, Brazil. We built a logical relationship matrix involving economic and environmental information as a tool to enhance public managers’ decision-making capabilities. Evaluation was based on four categories of vulnerability — high, medium-high, medium-low, and low —, and we found that the joint area of the Baixo Jaguaribe and Médio Jaguaribe sub-basins presented the following levels of risk contamination: 80.3% of the area had low vulnerability, 3.5% had medium-low vulnerability, 3.0% had medium-high vulnerability, and 13.2% had high vulnerability. Geographically, the municipalities with high vulnerability to contamination by pesticides were Aracati, Icapuí, Limoeiro do Norte, Tabuleiro do Norte, and Quixeré. Therefore, HVACI is an important tool for directing environmental management efforts toward areas identified as highly vulnerable to agrochemical contamination.
Keywords: semi-arid; fuzzy logic; aquifer.
RESUMO
O objetivo deste estudo foi avaliar a vulnerabilidade das águas subterrâneas à contaminação por agroquímicos por meio da construção do índice de vulnerabilidade hídrica e contaminação agroquímica (IVHCA), utilizando sistema de informação geográfica acoplado à lógica fuzzy. Este estudo foi aplicado no Ceará, para as sub-bacias hidrográficas do Baixo e Médio Jaguaribe. Elaborou-se uma matriz de relacionamento lógico envolvendo informações econômicas e ambientais, visando munir os gestores públicos com uma ferramenta capaz de direcionar a tomada de decisão. A avaliação foi realizada por meio de quatro categorias: alta, média-alta, média-baixa e baixa vulnerabilidade. Verificou-se que 80,3% da área conjunta das sub-bacias do Médio e Baixo Jaguaribe apresentou baixa vulnerabilidade hídrica à contaminação por agroquímicos e que 3,5% dessa área possui média-baixa vulnerabilidade; 3% possui média-alta vulnerabilidade; e 13,2%, alta vulnerabilidade. Os municípios de Aracati, Icapuí, Limoeiro do Norte, Tabuleiro do Norte e Quixeré foram os que apresentaram áreas com alta vulnerabilidade. Portanto, o IVHCA é uma importante ferramenta para o direcionamento de esforços de gestão ambiental em áreas identificadas com elevada vulnerabilidade à contaminação por agroquímicos.
Palavras-chave: semiárido, lógica fuzzy; aquífero.
GROUNDWATER VULNERABILITY TO AGROCHEMICAL CONTAMINATION
VULNERABILIDADE À CONTAMINAÇÃO POR AGROQUÍMICOS EM ÁGUAS SUBTERRÂNEASINTRODUCTION
Global population growth, coupled with economicde-velopment and better living standards, has generated pressures on the natural environment. This scenario has been causing serious environmental problems, such as pollution of hydrological catchment (GUNDA
et al., 2019; USSAMI; GUILHOTO, 2018).
Unsustainable socioeconomic practices and a gov-ernance structure that mismanages water resources results not only in the inequitable and inefficient dis-tribution of water but also in the lack of both water spring preservation and quality control. The resilience of aquatic systems on a world scale becomes seriously jeopardized and raises the question of how a projected increment of three billion people by 2050 can be sus-tainable amidst the upcoming global hydrological crisis (STADDON; SCOTT, 2018; NOVOA et al., 2019).
In this context, chemical contaminants produced by both industrial and agricultural activities (found both in surface water and groundwater) are some of the main contributors affecting water quality. Specifically, they comprise pesticides, fertilizers, nitrogen compounds, other organic volatile compounds, and metals used in production and storage in agriculture and livestock pastures. Other harmful substances and products in-clude herbicides, desiccants, and growth stimulants/ inhibitors (FERREIRA et al., 2016; SANTOS et al., 2018; SORANDO et al., 2018; TIBEBE et al., 2019).
A model indicates that Brazil’s total agricultural out-put is superior to 238 million tons a year and demands the intensive use of genetically modified organisms (GMOs) and chemical inputs, such as fertilizers and pesticides, to keep production levels high. Brazil’s economic model requires information subsidizing the use of these pollutants in compliance with national and state regulations for the protection of these re-sources (DELLA-FLORA et al., 2019), since agricultural production generates serious risk and vulnerability to regional water resources due to agrochemical pollu-tion of aquifers.
Various models have been developed to reduce the risk of aquifer agrochemical pollution. According to Momejian et al. (2019), Nistor (2020), Barreto-Ne-to and Marchesi (2019), Secron et al. (2017), Sakala
et al. (2018), and Calderon et al. (2016), the high risk
of contaminating local groundwaters near agricultural areas is normally associated with how climate change impacts the rainy season, and how rains, in turn, re-inforce the leaching of soils contaminated with agro-chemical products produced by agribusiness, in partic-ular insecticides, fungicides, herbicides, and fertilizers. Aside from climate change, other regional characteris-tics facilitate the transport of agrochemicals, such as:
• soil use and foliage cover;
• soil declivity;
• soil type;
• hydraulic conductivity, which may increase or re-duce the flow of chemical products through soil via infiltration and leaching, even under normal circumstances (NADIRI et al., 2019; DAS; CHANDRA PAL, 2020).
A study using the Scopus database for the two-year period between 2018 and 2019 revealed a gap still present in studies on agrochemical contamination, given that the literature (RESHMA; SINDHU, 2019; KADAOUI; BOUALI; ARABI, 2019; GIMSING et al., 2019; HE et al., 2019; EJIOGU et al., 2019; FIDELIBUS; PULIDO-BOSCH, 2019; DEMIR; DILEK; YETIS, 2019; OKADERA et al., 2018; LIN; YAYA, 2018) has focused on the analysis of vulnerability to different variables, such as anthropic impacts, active ingredients of pes-ticides, coal mining, water salinity, pesticide leaching processes, saltwater infiltration, and the presence of nitrates, ammonia, and phosphates.
Ismael and Rocha (2019) claim that the most com-monly used mathematical models to evaluate the po-tential for surface and groundwater contamination is the United States Environmental Protection Agency (EPA) method of screening, the Goss method, and the Groundwater Ubiquity Score (GUS) index. However, implementing the EPA methods demands knowledge of both the active ingredients and the physicochemical properties contained in pesticide formulas to under-stand how these residues are transported throughout the environment.
Other models, such as DRASTIC (ALLER et al., 1987) and ALPRIFT (NADIRI et al., 2019), provide vulnerabil-ity analysis of groundwaters, including analysis of hy-drogeological and hydrochemical parameters, and can be incorporated into a geographic information system (GIS), as shown in Moustafa (2019) and Barzegar et al. (2019). The downside of these models is that they re-quire extensive amounts of field data, making them costly for the evaluation of large geographic areas, especially given the lack of hydrogeological and geo-chemical databases.
More recently, fuzzy analysis has been used to eval-uate the degree of vulnerability of groundwaters by analytical and numerical data manipulation. Stud-ies developed by Nobre et al. (2007) and Gonçalves
et al. (2019) point to the use of fuzzy analysis coupled
with GIS as a tool capable of assessing the degree of groundwater vulnerability to contamination without depending on the physicochemical parameters of fer-tilizers and pesticides.
Along these lines of research, works developed by Dix-on (2005), Feizizadeh et al. (2014), and Barrile et al. (2016) show that fuzzy analysis combined with GIS can be a powerful instrument for modeling problems of
complex ecosystems from a spatial perspective. By su-perimposing and intersecting regional maps, indexing parameters with their appropriate weights can elimi-nate imprecise or subjective inherent concepts from the multiple criteria evaluation necessary to assess groundwater vulnerability.
In this study, we developed an index to measure groundwater vulnerability to agrochemical contami-nation by linking fuzzy logic to a GIS environment via association functions capable of dealing with a high degree of uncertainty and ambiguous situations, as is the case when evaluating groundwater vulnerability to agrochemical contamination.
Our method provides a more practical data treatment, using a computationally-friendly analysis technique. This method enabled the construction of a vulnerabili-ty index that is continuous and spatially computable at the river sub-basin level, using ten parameters compat-ible with the GUS, Goss, DRASTIC, and ALPRIFT models. It is grounded in three dimensions — hydrology, soil, and economy — and provides information to water resources and environmental policymakers that may assist their decision making on how to prevent ground-water contamination.
STUDY SITE
This study was developed for the Baixo and MédioJag-uaribe sub-basins, located in the JagJag-uaribe River basin, geographically situated in the east quadrant of the state of Ceará, in Northeastern Brazil. These sub-ba-sins occupy about 51.9% of the total area of the state, encompassing a drainage area of 75,669 km2, between 4°30’ and 7°45’ latitude South and 37°30’ and 41°00’ longitude West.
The Baixo Jaguaribe River sub-basin drains an area of 7,021 km² of low surfaces, with flat relief, and moder-ately dissected between streams tabularly interspersed with sectors of river plains, and with a predominance of sedimentary rocks. Figure 1 shows the Médio Jag-uaribe River sub-basin, which drains an area of 10,335 km2, with river neosol soils in the Jaguaribe River allu-vium (IPECE, 2020).
METHODOLOGY
Methodological strategy
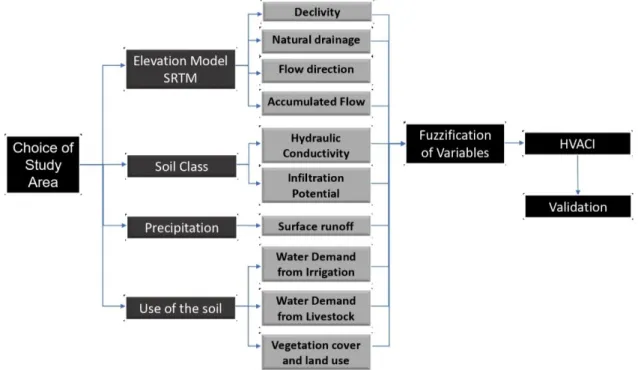
The Hydric Vulnerability and Agrochemical Contami-nation Index (HVACI) was constructed using Feizizadeh
et al.’s (2014) applied methodology of spatial analysis.
Figure 2 illustrates the procedures of coupling fuzzy logic with a GIS environment.
This method addresses different elements of a complex decision problem and organizes the
vari-ous elements in a hierarchical structure involving dimensions central to this study, namely: hydro-geology, soil use, and economy. For this analysis, the definition of parameters was grounded in the works of Milhome et al. (2009), Freitas (2010), Teix-eira (2015), Barrile et al. (2016), Nadiri et al. (2019), and Barzegar et al. (2019).
Figure 1 – Baixo and Médio Jaguaribe River sub-basins, Ceará.
SRTM: shuttle radar topography mission; HVACI: hydric vulnerability and agrochemical contamination index.
Database
In this study, we used the following data:
• Digital terrain elevation model (INPE, 2009);
• Soil type, soil hydraulic conductivity, maximal annu-al precipitation, potentiannu-al water infiltration on soil, soil usage, and foliage cover (FUNCEME, 2019);
• Water demand from irrigated agriculture and live-stock production (ANA, 2019);
• Slope, natural drainage, water flow direction, water flow, and surface runoff, which were esti-mated herein.
Information about slope and altimetry was gathered from the TOPODATA/INPE project via the Shuttle Radar Topography Mission (SRTM). SRTM images are struc-tured in grids that have a 1:250,000 resolution.
The digital terrain model was used to modulate the drainage system and the notching of regional river chan-nels, which directly contribute to the transport of agro-chemicals via surface runoff and soil infiltration by water.
Estimated soil surface runoff
Surface runoff was estimated using the Soil Conserva-tion Service — Curve Number (SCS-CN) model for rain-fall. Zhan and Huang (2004) state that this hydrological model is based on the concept of a surface runoff wa-ter blade produced by a given event, which, according to Gobira (2017), is considered “daily maximal precipi-tation” by the aforementioned model.
The SCS-CN model uses a “curve number” (CN) parameter that represents each area of influence according to the antecedent moisture condition (AMC), classified accord-ing to data on soil use and occupation. Equation 1 esti-mated the surface runoff of the sub-basins under study.
Pe = (1)
In which:
Pe = surface runoff per pixel (mm);
P = maximum daily precipitation per pixel (mm); S = maximum soil retention per pixel (mm).
The maximum daily precipitation per pixel was deter-mined in three steps. First, precipitation data were gathered from the hydrological network of rain gauge stations monitored by Fundação Cearense de Meteo-rologia e Recursos Hídricos (FUNCEME). Second, the
maximum precipitation of a single day was identified in each station, considering the time series from 1980 to 2018. Third, the maximum daily precipitation of each rain gauge station was interpolated in the river sub-ba-sins under study to estimate this information in a spe-cialized way for the entire area, applying the inverse distance weighted (IDW) interpolation method, with the use of the ArcGis “Geostatistical Analyst” tool. We calculated the maximal potential of soil infiltration (S) using Equation 2, employing the runoff curve, CN, of the SCS-CN rainfall model to define the adjustment co-efficients of units based on the hydrological soil-vegeta-tion complex. CN was calculated using the Soil Conser-vation Service–United States Department of Agriculture (SCS-USDA), which considers every type of soil use and occupation of the Médio and Baixo Jaguaribe sub-basins.
S (cm) = (2)
The method proposed by the SCS-USDA to determine the CN divides soil types into four general hydrological groups:
• Group A: Minimal potential of surface runoff and high rate of infiltration, includes deep sandy soils with small amounts of silt and clay that are highly permeable, and an infiltration rate of 8–12 mm/h;
• Group B: Mostly sandy soils, less deep or less com-pact than group A soils, with an average infiltration
superior to and less permeable than the previous, presenting an infiltration rate of 4–8 mm/h;
• Group C: Shallow soils that generate above-average surface runoff and below-average infiltration, con-taining a significant percentage of clay, and present-ing an approximate infiltration rate of 1–4 mm/h.
Soils in this group have moderately high runoff po-tential when thoroughly wet;
• Group D: Shallow soils with very low infiltration rates and high surface runoff rates, containing more clay, which has a 2:1 lattice type.
Slope, flow direction, and accumulated water flow
The slope of the terrain was calculated using the “Spatial Analyst/Surface — Slope” tool of the ArcMap 10.2 software for each 90 × 90 m cell in “raster” format. Flow direction andaccumulated flow were calculated using the “Spatial Ana-lyst/Hydrology — Flow Direction” and the “Spatial Analyst/ Hydrology — Flow Accumulation” techniques, respectively.
Hydraulic conductivity
We estimated hydraulic conductivity using the qual-itative classification method adopted by Neves et al. (1998), considering the following variables: texture, structure, aggregate stability, and soil depth.
Based on the combination of these variables, three groups of hydraulic conductivity were created: low,
medium, and high, represented by the numbers 1, 2, and 3, respectively. These three groups of hydraulic conductivity were taken as a base from the field sur-vey of soils and their physical properties carried out by Fundação Cearense de Meteorologia e Recursos Hídri-cos (FUNCEME, 2012).
Spatial data analysis
Spatial data analysis was performed in a GIS envi-ronment, using the ArcMap 10.2 software, to struc-ture and analyze the parameters in raster format, in 90 × 90 m cells, compatible with the 1:250,000 projections, through the Universal Transverse Mer-cator (UTM) coordinate system and the SIRGAS 2000
Geocentric Reference System, the geodesic system officially adopted in Brazil. To that end, the following ArcMap tools were used:
• Spatial Analyst: Map Algebra to estimate the sur-face runoff and sum the fuzzified parameters;
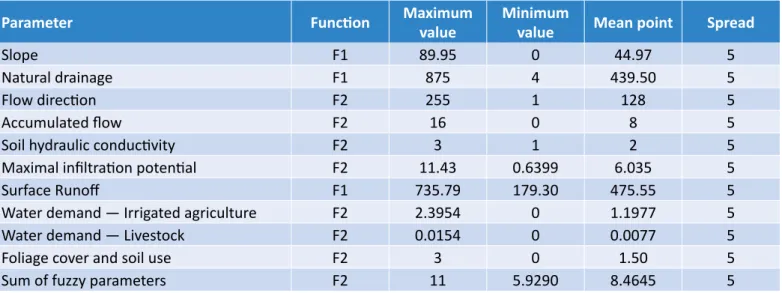
Table 1 – Parameters, criteria, and fuzzy functions applied to the hydric vulnerability and agrochemical contamination index.
Parameter Function Maximum value Minimum value Mean point Spread
Slope F1 89.95 0 44.97 5
Natural drainage F1 875 4 439.50 5
Flow direction F2 255 1 128 5
Accumulated flow F2 16 0 8 5
Soil hydraulic conductivity F2 3 1 2 5
Maximal infiltration potential F2 11.43 0.6399 6.035 5
Surface Runoff F1 735.79 179.30 475.55 5
Water demand — Irrigated agriculture F2 2.3954 0 1.1977 5
Water demand — Livestock F2 0.0154 0 0.0077 5
Foliage cover and soil use F2 3 0 1.50 5
• Spatial Analyst: Surface/Slope to calculate the slope of the terrain;
• Spatial Analyst: Hydrology to calculate the flow di-rection, accumulated flow, and natural drainage;
• Spatial Analyst: Overlay/Fuzzy Membership for pa-rameter fuzzification and HVACI construction.
Fuzzifying the parameters
Spatial Analyst — Fuzzy Membership was used to fuzzi-fy the decision variables in a GIS environment (Table 1). This tool reclassifies and standardizes input data on a scale of 0 to 1 based on the probability that the datum is a member of the specified set. A value of 0 was at-tributed to regions that are not members of the spec-ified set, and a value of 1 was assigned to regions that are members of the specified set.
Two membership functions used the Fuzzy Member-ship technique: “MS Small” denoted by F1 (Equation 3) and “MS Large” by F2 (Equation 4) to capture values that were likely to be part of the subset that affects water vulnerability.
(3)
(4) In which:
f1 = the expansion of the transition from an association value from 1 to 0 (Spread);
f2 = the midpoint that has 0.50 as the associated value. We point out that the Fuzzy Small membership func-tion was used for variables whose lowest input values were more likely to be a member of the set, and the Fuzzy Large membership function was used for vari-ables whose highest input values were more likely to be a member of the set.
Elaboration and validation of the HVACI
HVACI was built from the algebraic sum of the stan-dardized decision variables. This sum was performed using the Spatial Analyst — Map Algebra tool in a GIS environment. It was used to obtain a global value of the contribution of each variable spatially analyzed for the studied sub-basins.Subsequently, risk areas were classified, according to four classes of vulnerability as follows:
• Class 1: high vulnerability, values above 0.75;
• Class 2: medium-high vulnerability, values between 0.50 and 0.75;
• Class 3: medium-low vulnerability, values between 0.25 and 0.50;
• Class 4: low vulnerability, values between 0 and 0.25.
The index was validated by comparing results, follow-ing the procedures developed by Weihs, Sayago and Tourrand (2017), França et al. (2016), Teixeira (2015), Franco et al. (2015), Marcon, Martins and Stein (2014), Oliveira (2012), Martini et al. (2012), Milhome (2011), Andrade et al. (2011), and Lacerda et al. (2004).
RESULTS
In this section, we present the evaluation of
hy-dric vulnerability, analyzing each decision vari- able individually, and the assessment by the HVACI.
Slope and surface runoff of soils
The spatial slope distribution was obtained from the dig-ital terrain elevation model and later standardized using fuzzy logic. We aimed at evaluating the influence of slope
on hydric vulnerability to agrochemical contamination. Areas with the smallest slopes had values closer to 1, since the flatter the terrain, the larger the infiltration
ef-fect, and the smaller the surface runoff, considering that these areas accumulate the water transported by runoff. Areas with indices closer to 1 showed high flood potential and a greater level of infiltration and propensity to receive waters drained from agricultural and livestock regions (Figure 3). According to Costa et al. (2019), this scenar-io results from slope defining the hydraulic gradient, the flow direction, and the accumulated flow, directly influ-encing the transport and storage of pollutants in the soil.
We emphasize that soil slope, surface runoff, and water seepage variables are closely related to the degree of ter-rain slope and its landform, acting conjointly with flow di-rection, natural drainage system, and water flow accumula-tion on soil variables, which in turn allow the identificaaccumula-tion of hydric vulnerability to agrochemical contamination. Figure 4 illustrates the heterogeneous spatial distribution of the surface runoff in the Médio and Baixo Jaguaribe sub-basins, with the Baixo Jaguaribe sub-basin being the
Figure 3 – Use of fuzzy logic to standardize soil slope and hydraulic conductivity variables of Ceará’s Médio and Baixo Jaguaribe sub-basins.
Figure 4 – Use of fuzzy logic to standardize surface runoff and maximum
most susceptible to hydric agrochemical contamination, given its capacity for flow diffusion and concentration. Ac-cording to Franco et al. (2015), terrains with flatter surfac-es tend to prsurfac-esent better conditions for water infiltration and, therefore, higher risk of aquifer contamination. An analysis of hydraulic conductivity and maximal po-tential infiltration of different soil classes reveals that soils present in coastal and alluvium areas, such as neosols, quartz sands, and eutrophic alluvial, red-yel-low podzolic argisols, and red-yelred-yel-low latosols, have
higher conductivity and maximal potential infiltration. We underline that the studied sub-basins have a pre-dominance of neosols, argisols, luvisols, and planosols, which correspond to 87.1% of the total area. We have also found that in areas with more intense cultivation, as in the municipalities of Quixeré and Limoeiro do Norte, hydraulic conductivity values were lower than in non-cultivated soils, making infiltration and aquifer recharge more difficult. These results are aligned with the findings of Soto and Kiang (2018).
Figure 5 – Fuzzy logic standardization of soil use and anthropization variables for the Médio and Baixo Jaguaribe sub-basins in the state of Ceará.
Soil use
The data reveal that 24.4% of the study area is occupied by the agribusiness sector. In other words, the adequate monitoring of sources and dynamics of groundwater con-tamination requires understanding the dynamics of the agribusiness sector in the sub-basin context (Figure 5). Large agricultural projects are located in areas with high infiltration (or seepage) potential, where water is more easily accumulated, and pesticides leave per-manent traces. Consequently, the risk of groundwater contamination is considerable, making these areas highly vulnerable (FRANÇA et al., 2016) (Figure 6). Calculating the contribution of livestock to the total heavy metal load in drainage basins, we found that a determinant factor is the concentration of metals in
live-stock rations of industrial-scale animal farming. In fact, the concentration of metals such as cadmium and lead in animal feces is directly related to the concentration of metals such as copper and zinc in animal rations or dietary supplements (LACERDA et al., 2004) (Figure 6). According to Milhome (2011), Martini et al. (2012), and Teixeira (2015), the process of agrochemical leaching on soil profile is the most common form of groundwater contamination, either by preferen-tial flow or by aquifer recharge zones. The extension of leaching contamination depends, among other things, on soil use and type, the inherent physico-chemical properties of agrophysico-chemical molecules, and regional climate conditions (ANDRADE et al., 2011).
Hydric vulnerability and agrochemical contamination index
HVACI was compiled in 2016 from the fieldwork
infor-mation regarding the study areas. The sub-basins under analysis were classified into four categories: high, medi-um-high, medium-low, and low vulnerability (Figure 7).
We identified that 80.3% of the joint areas of the Médio and Baixo Jaguaribe sub-basins presented low hydric vulnerability to agrochemical contamination, with the remaining area being classified as follows: 3.5% with medium-low vulnerability, 3.0% with medium-high vul-nerability, and 13.2% with high vulnerability.
According to the territorial distribution index (Figure 7), the Baixo Jaguaribe sub-basin had the largest area with the highest degree of vulnerability, with 2,642 km2 clas-sified between medium and high vulnerability and rep-resenting 15.2% of the total area of both sub-basins. We highlight that the Baixo Jaguaribe sub-basin had a larger area comprising both irrigated agriculture and livestock production. Moreover, this region also has lower elevation and flatter landscape, which favors the accumulation of surface runoff waters.
After analyzing the soil in areas indicating vulnerability to agrochemical contamination, we found that they are either areas of irrigated agriculture and livestock pro-duction or near those areas.
With respect to physical characteristics, these areas are flat, with few streams and canals, but with high susceptibility to flooding. These areas are located in the municipalities of Aracati, Icapuí, Limoeiro do Norte, Tabuleiro do Norte, and Quixeré.
On the other hand, we found that areas classified as having a low level of vulnerability presented a high slope terrain, with drainage systems that were natu-rally favorable to surface runoff, and with a near-zero probability of flooding. These areas also showed little pasture or irrigated agriculture.
According to HVACI results, the Quixeré region had the highest hydric vulnerability to agrochemical con-tamination, a finding that is in line with the research by Marcon, Martins and Stein (2014), who indicated a predominance of chlorine, bicarbonate, and calcium in groundwater, with values much higher than those per-mitted by the Brazilian legislation for human consump-tion. Contaminated waters were found in wells over the Jandaíra aquifer, located in the Jaguaribe basins at the Chapada do Apodi, covering the municipalities of Alto Santo, Jaguaruana, Limoeiro do Norte, Quixeré, and Tabuleiro do Norte (state of Ceará), and in the Po-tiguar basin (state of Rio Grande do Norte).
The HVACI results can be confirmed in studies by Oliveira (2012) and Teixeira (2015), who have iden-tified a diverse class of illegal pesticide active in-gredients in sampled wells of Quixeré and Limoeiro do Norte.
We emphasize that the use of fertilizers and pesticides is common in the area of Chapada do Apodi (Quixeré, Ceará), including the use of urea, potassium chloride, calcium nitrate, magnesium sulfate, borax, molyb-dates, and other nutrients. Annually, 800 kg of potassi-um chloride is applied per hectare. According to Back
et al. (2016), the use of pesticides in irrigated fields can
contaminate irrigation and drainage canal waters in riv-er basins, as is the case of the irrigated rice culture in Santa Catarina, which is also explored in the Médio and Baixo Jaguaribe River sub-basins.
If agrochemical contamination becomes prevalent in municipalities with high levels of vulnerability, regional public health-related problems may arise, a situation that will not be perceptible for three or four years, which is the time necessary for these products to be assimilated by the environment. These products may cause chronic diseases like cancer, neurological problems, and fetus malforma-tion due to continued exposure, even in low dos-es (WEIHS; SAYAGO; TOURRAND, 2017; MILHOME
et al., 2009).
In this context, the risk factor for contamination of water resources by agrochemicals is high, main-ly due to aerial spraying, with pesticides that end up contaminating several water sources destined for human consumption, aggravating diseases as a result of polluted environmental compartments (WEIHS; SAYAGO; TOURRAND, 2017). According to Siqueira (2017), risk management is the process of controlling and valuing the sources of exposure to risk, involving the choice of regulatory actions that best apply to the contaminated site, aiming at its re-duction or elimination.
HVACI is, therefore, a tool that points water and en-vironmental resource managers to priority areas that need water quality monitoring and enforcement. It is also a tool that can help managers improve resource allocation to needed programs.
REFERENCES
AGÊNCIA NACIONAL DE ÁGUAS (ANA). Manual de Usos Consuntivos da Água no Brasil. Brasília: ANA, 2019. Available at: <http://snirh.gov.br/usos-da-agua/>. Accessed on: Jun. 15, 2019.
ALLER, L.; BENNETT, T.; LEHR, J. H.; PETTY, R. J.; HACKETT, G. DRASTIC: A standardized system for evaluating ground water pollution potential using hydrogeologic settings. US Environmental Protection Agency, 1987. Available at: <https:// nepis.epa.gov/>. Accessed on: Apr. 4, 2020.
ANDRADE, A. S.; REIS, M. R.; DRUMOND, L. C. D.; CAIXETA, S. P.; RONCHI, C. P. Potencial de lixiviação de herbicidas em solos agrícolas na região do Alto Paranaíba (MG). Pesticidas, v. 21, p. 95-102, 2011. Available at: <https://doi. org/10.5380/pes.v21i0.25848>. Accessed on: Feb. 10, 2020.
BACK, Á.; DESCHAMPS, F.; SANTOS, M. da G. Ocorrência de agrotóxicos em águas usadas com irrigação de arroz no Sul de Santa Catarina. Revista Brasileira de Ciências Ambientais (Online), n. 39, p. 47-58, 2016. Available at: <https://doi. org/10.5327/Z2176-9478201611014>. Accessed on: July 1, 2020.
BARRETO-NETO, A. A.; MARCHESI, A. F. Avaliação da vulnerabilidade socioambiental à desertificação no estado do Espírito Santo. Brasil. Revista Brasileira de Ciências Ambientais (Online), n. 51, p. 28-40, 2019. Available at: <https:// doi.org/10.5327/Z2176-947820190413>. Accessed on: Sept. 4, 2019.
BARRILE, V.; CIRIANNI, F.; LEONARDI, G.; PALAMARA, R. A Fuzzy-based Methodology for Landslide Susceptibility Mapping.
Procedia, v. 223, p. 896-902, 2016. Available at: <https://doi.org/10.1016/j.sbspro.2016.05.309>. Accessed on: Feb. 12, 2020.
CONCLUSION
The use of spatial analysis data with fuzzy logicproved to be effective in identifying areas vulner-able to agrochemical contamination in the Médio and Baixo Jaguaribe sub-basins in the Brazilian Northeast state of Ceará. A score of 0 was attribut-ed to areas with no chance of agrochemical con-tamination, and 1 to areas that are definitely vul-nerable. We emphasize that the variables used in this study have huge spatial variability within the aforementioned sub-basins.
We found that 80.3% of the joint area of the Mé-dio and Baixo Jaguaribe sub-basins had low hydric vulnerability, 3.5% had medium-low vulnerability, 3.0% had medium-high vulnerability, and 13.2% had high vulnerability.
The Quixeré region was identified as one of the most vul-nerable areas. Teixeira’s (2015) empirical fieldwork con-firmed this finding, validating the efficacy of our index in detecting areas vulnerable to contamination. The index could be an important tool for directing impact evalua-tions of areas prone to agrochemical contamination. Areas with high vulnerability show the following char-acteristics: irrigation and/or livestock in or near the area, flatland areas with few streams and canals, soils susceptible to flooding and infiltration due to the low level of surface runoff. On the other hand, areas classi-fied as having a low level of vulnerability were charac-terized by high-slope terrain, a natural drainage system favorable to surface runoff, no flood terrain, and nei-ther irrigation nor livestock in or near the area.
ACKNOWLEDGMENTS
Writing this article was possible due to thetech-nical support from the Instituto de Pesquisa e Es-tratégica Econômica do Ceará (IPECE) and the fi-nancial support from the Conselho Nacional de
Desenvolvimento Científico e Tecnológico (CNPq), granted by Call MCTI/CNPq no. 18/2018, process no. 420882/2018-9. We also thank Luis Barros for his help with the translation.
BARZEGAR, R.; MOGHADDAM, A. A.; ADAMOWSKI, J.; NAZEMI, A. H. Delimitation of groundwater zones under contamination risk using a bagged ensemble of optimized DRASTIC frameworks. Environmental Science and Pollution Research, v. 26, n. 8, p. 8325-8339, 2019. Available at: <https://doi.org/10.1007/s11356-019-04252-9>. Accessed on: Aug. 30, 2019.
CALDERON, M. J.; LUNA, E. de; GOMEZ, J. A.; HERMOSIN, M. C. Herbicide monitoring in soil. runoff waters and sediments in the olive orchard. Science of The Total Environment, v. 569-570, p. 416-422, 2016. Available at: <http:// dx.doi.org/10.1016/j.scitotenv.2016.06.126>. Accessed on: June 12, 2019.
COSTA, C. W.; LORANDI, R.; LOLLO, J. A. de; SANTOS, V. S. dos. Potential for aquifer contamination of anthropogenic activity in the recharge area of the Guarani Aquifer System. southeast of Brazil. Groundwater for Sustainable Development, v. 8, p. 10-23, 2019. Available at: <https://doi.org/10.1016/j.gsd.2018.08.007>. Accessed on: June 12, 2019.
DAS, B.; CHANDRA PAL, S. Irrigation practices causing vulnerability of groundwater resources in water scarce Goghat-I and II Blocks of Hugli District using MCDA. AHP. Fuzzy logic and novel ensemble models. Advances in Space Research, v. 65, n. 12, p. 2733-2748, 2020. Available at: <https://doi.org/10.1016/j.asr.2020.03.027>. Accessed on: Apr. 2, 2020. DELLA-FLORA, A.; BECKER, R. W.; BENASSI, S. F.; TOCI, A. T.; CORDEIRO, G. A.; IBÁÑEZ, M.; PORTOLÉS, T.; HERNÁNDEZ, F.; BOROSKI, M.; SIRTORI, C. Comprehensive investigation of pesticides in Brazilian surface water by high resolution mass spectrometry screening and gas chromatography–mass spectrometry quantitative analysis. Science of The Total Environment, v. 669, p. 248-257, 2019. Available at: <https://doi.org/10.1016/j.scitotenv.2019.02.354>. Accessed on: May 19, 2019. DEMIR, A. E. A.; DILEK, F. B.; YETIS, U. A new screening index for pesticides leachability to groundwater. Journal of
Environmental Management, v. 231, p. 1193-1202, 2019. Available at: <https://doi.org/10.1016/j.jenvman.2018.11.007>.
Accessed on: Aug. 30, 2019.
DIXON, B. Groundwater vulnerability mapping: A GIS and fuzzy rule based integrated tool. Applied Geography, v. 25, n. 4, p. 327-347, 2005. Available at: <https://doi.org/10.1016/j.apgeog.2005.07.002>. Accessed on: Feb. 12, 2020. EJIOGU, B. C.; OPARA, A. I.; NWOSU, E. I.; NWOFOR, O. K.; ONYEMA, J. C.; CHINAKA, J. C. Estimates of aquifer geo-hydraulic and vulnerability characteristics of Imo State and environs. Southeastern Nigeria. using electrical conductivity data. Environmental Monitoring and Assessment, v. 191, p. 238, 2019. Available at: <https://doi.org/10.1007/s10661-019-7335-1>. Accessed on: Aug. 30, 2019.
FEIZIZADEH, B.; ROODPOSHTI, M. S.; JANKOWSKI, P.; BLASCHKE, T. A GIS-based extended fuzzy multi-criteria evaluation for landslide susceptibility mapping. Computers & Geosciences, v. 73, p. 208-221, 2014. Available at: <http://dx.doi. org/10.1016/j.cageo.2014.08.001>. Accessed on: Feb. 19, 2019.
FERREIRA, M. J. M.; VIANA JÚNIOR, M. M.; PONTES, A. G. V.; RIGOTTO, R. M.; GADELHA, D. Gestão e uso dos recursos hídricos e a expansão do agronegócio: água para quê e para quem? Ciência & Saúde Coletiva, v. 21, n. 3, p. 743-752, 2016. Available at: <https://doi.org/10.1590/1413-81232015213.21012015>. Accessed on: Apr. 12, 2020.
FIDELIBUS, M. D.; PULIDO-BOSCH, A. Groundwater Temperature as an Indicator of the Vulnerability of Karst Coastal Aquifers.
Geosciences, v. 9, n. 1, p. 23-45, 2019. Available at: <https://doi.org/10.3390/geosciences9010023>. Accessed on: Aug. 30, 2019.
FRANÇA, L. C. de J.; SILVA, J. B. L.; LISBOA, G. S.; LIMA, T. P.; FERRAZ, F. T. Elaboração de Carta de Risco de Contaminação por Agrotóxicos para a Bacia do Riacho da Estiva, Brasil. Floresta e Ambiente, v. 23, n. 4, p. 463-474, 2016. Available at: <https://doi.org/10.1590/2179-8087.141415>. Accessed on: Feb. 12, 2020.
FRANCO, G. B.; SILVA, D. D.; MARQUES, E. A. G.; CHAGAS, C. S.; GOMES, R. L. Análise da Vulnerabilidade à Contaminação do Aquífero Freático e da Taxa de Infiltração do Solo da Bacia do Rio Almada e Área Costeira Adjacente – BA. Revista
Brasileira de Geografia Física, v. 8, n. 3, p. 705-720, dez. 2015. Available at: <https://periodicos.ufpe.br/revistas/rbgfe/
FREITAS, B. M. C. Marcas da modernização da agricultura no território do Perímetro Irrigado Jaguaribe-Apodi: uma
face da atual reestruturação socioespacial do Ceará. 176f. Dissertation (Mestrado em Geografia) – Centro de Ciências
e Tecnologia, Universidade Estadual do Ceará, Fortaleza, 2010.
FUNDAÇÃO CEARENSE DE METEOROLOGIA E RECURSOS HÍDRICOS (FUNCEME). Levantamento de reconhecimento de
média intensidade dos solos - Mesorregião do Sul Cearense. Fortaleza: Fundação Cearense de Meteorologia e Recursos
Hídricos, 2012. 280 p.
FUNDAÇÃO CEARENSE DE METEOROLOGIA E RECURSOS HÍDRICOS (FUNCEME). Sistema de Informação. FUNCEME. Available at: <http://www.funceme.br>. Accessed on: May 15, 2019.
GIMSING, A. L.; AGERT, J.; BARAN, N.; BOIVIN, A.; FERRARI, F.; GIBSON, R.; HAMMOND, L.; HEGLER, F.; JONES, R. L.; KÖNIG, W.; KREUGER, J.; VAN DER LINDEN, T.; LISS, D.; LOISEAU, L.; MASSEY, A.; MILES, B.; MONZORIES, L.; NEWCOMBE, A.; POOT, A.; REEVES, G. L.; REICHENBERGER, S.; ROSENBOM, A. E.; STAUDENMAIER, H.; SUR, R.; SCHWEN, A.; STEMMER, M.; TÜTING, W.; ULRICH, U. Conducting groundwater monitoring studies in Europe for pesticide active substances and their metabolites in the context of Regulation (EC) 1107/2009. Journal of Consumer Protection and Food Safety, v. 14, p. 1-93, 2019. Available at: <https://doi.org/10.1007/s00003-019-01211-x>. Accessed on: Aug. 30, 2019.
GOBIRA, A. K. M. Simulação hidrológica utilizando o método rain shower (SCS-CN) para a Bacia do Açude Edson Queiroz.
Santa Quitéria, Ceará. 59f. Trabalho de Conclusão de Curso (Graduação) – Curso de Agronomia, Centro de Ciências
Agrárias, Universidade Federal do Ceará Fortaleza, 2017.
GONÇALVES, R. M.; SALEEM, A.; QUEIROZ, H. A. A.; AWANGE, J. L. A fuzzy model integrating shoreline changes. NDVI and settlement influences for coastal zone human impact classification. Applied Geography, v. 113, p. 102093, 2019. Available at: <https://doi.org/10.1016/j.apgeog.2019.102093>. Accessed on: Feb. 12, 2020.
GUNDA, T.; HESS, H. D.; HORNBERGER, G. M.; WORLAND, S. Water security in practice: The quantity-quality-society nexus. Water Security, v. 6, 100022, 2019. Available at: <https://doi.org/10.1016/j.wasec.2018.100022>. Accessed on: July 20, 2019.
HE, B.; HE, J.; WANG, L.; ZHANG, X.; BI, E. Effect of hydrogeological conditions and surface loads on shallow groundwater nitrate pollution in the Shaying River Basin: Based on least squares surface fitting model. Water Research, v. 163, p. 114880, 2019. Available at: <https://doi.org/10.1016/j.watres.2019.114880>. Accessed on: Aug. 30, 2019.
INSTITUTO DE PESQUISA E ESTRATÉGIA ECONÔMICA DO CEARÁ (IPECE). Ceará em Mapas. IPECE, 2020. Available at: <http://www2.ipece.ce.gov.br/atlas/>. Accessed on: Feb. 6, 2020.
INSTITUTO NACIONAL DE PESQUISAS ESPACIAIS (INPE). Topodata: banco de dados geomorfométricos. INPE, 2009. Available at: <http://www.dsr.inpe.br/topodata/documentos.php>. Accessed on: June 6, 2019.
ISMAEL, L. L.; ROCHA, E. M. R. Estimate of the contamination of groundwater and surface water due to agrochemicals in the sugar-alcohol area. Santa Rita, State of Paraíba, Brazil. Ciência e Saúde Coletiva, v. 24, n. 12, p. 4665-4676, 2019. Available at: <http://www.scielo.br/scielo.php?script=sci_arttext&pid=S1413-81232019001204665&lng=en&nrm=iso &tlng=en>. Accessed on: Feb. 6, 2019. http://dx.doi.org/10.1590/1413-812320182412.27762017
KADAOUI, M.; BOUALI, A.; ARABI, M. Assessment of physicochemical and bacteriological groundwater quality in irrigated Triffa Plain. North-East of Morocco. Journal of Water and Land Development, v. 42, n. 1, p. 100-109, 2019. Available at: <https://doi.org/10.2478/jwld-2019-0050>. Accessed on: Aug. 30, 2019.
LACERDA, L.; MARINS, R.; VAISMAN, A.; MAIA, S. R. R.; AGUIAR, J. E.; DIAS, F. J. S. Contaminação por metais pesados e
pesticidas nas bacias inferiores dos Rios Curimataú e Açu (RN) e Rio Jaguaribe (CE). 2004. Available at: <https://abccam.
LIN, W. Y.; YAYA, S. The antipollution evaluation of phreatic water by comprehensive index evaluation model based on the Bayes. Earth and Environmental Science, v. 199, 022032, 2018. Available at: <https://doi.org/10.1088/1755-1315/199/2/022032>. Accessed on: Aug. 30, 2019.
MARCON, A. E.; MARTIN, C. A.; STEIN, P. Análise das Águas do Aquífero Jandaíra em Apoio ao Programa Água Doce no Rio Grande do Norte (PAD/RN). In: SIMPÓSIO DE RECURSOS HÍDRICOS DO NORDESTE, 12., 2014. Natal, 2014. Available at: <http://eventos.abrh.org.br/xiisrhn/anais/papers/PAP018185.pdf>. Accessed on: Feb. 4, 2020.
MARTINI, L. F. D.; CALDAS, S. S.; BOLZAN, C. M.; BUNDT, A. C.; PRIMEL, E. G.; AVILA, L. A. Risco de contaminação das águas de superfície e subterrâneas por agrotóxicos recomendados para a cultura do arroz irrigado. Ciência Rural, v. 42, n. 10, p. 1715-1721, 2012. Available at: <https://doi.org/10.1590/s0103-84782012001000001>. Accessed on: Feb. 10, 2020. MILHOME, M. A. L. Influência do uso de agrotóxicos na qualidade dos recursos hídricos da região do perímetro irrigado Jaguaribe-Apodi/CE. 148f. Thesis (Doutorado) – Programa de Pós-Graduação em Engenharia Civil: Saneamento Ambiental, Centro de Tecnologia, Universidade Federal do Ceará, Fortaleza, 2011. Available at: <http://www.repositorio. ufc.br/handle/riufc/17218>. Accessed on: June 27, 2019.
MILHOME, M. A. L.; SOUSA, D. O. B.; LIMA, F. A. F.; NASCIMENTO, R. F. Assessment of surface and groundwater potential contamination by agricultural pesticides applied in the region of Baixo Jaguaribe. CE. Brazil. Engenharia Sanitária e
Ambiental, v. 14, n. 3, p. 363-372, jul./set. 2009. Available at: <http://dx.doi.org/10.1590/S1413-41522009000300010>.
Accessed on: July 15, 2019.
MOMEJIAN, N.; ABOU NAJM, M.; ALAMEDDINE, I.; EL-FADEL, M. Can groundwater vulnerability models assess seawater intrusion? Environmental Impact Assessment Review, v. 75, p. 13-26, 2019. Available at: <https://doi.org/10.1016/j. eiar.2018.10.003>. Accessed on: July 15, 2019.
MOUSTAFA, M. Assessing perched aquifer vulnerability using modified DRASTIC: a case study of colliery waste in north-east England (UK). Hydrogeology Journal, v. 27, p. 1837-1850, 2019. Available at: <https://doi.org/10.1007/s10040-019-01932-1>. Accessed on: Aug. 29, 2019.
NADIRI, A. A.; NOROUZI, H.; KHATIBI, R.; GHAREKHANI, M. Groundwater DRASTIC Vulnerability Mapping by Unsupervised and Supervised Techniques Using a Modelling Strategy in Two Levels. Journal of Hydrology, v. 574, p. 744-759, 2019. Available at: <https://doi.org/10.1016/j.jhydrol.2019.04.039>. Accessed on: June 29, 2019.
NEVES, M. C.; GOMES, M. A.; LUIZ, A. J. B.; SPADOTTO, C. A. Sistema de Informação Geográfica na avaliação de impacto ambiental por agroquímicos. In: SISTEMA DE INFORMAÇÕES GEOGRÁFICAS: Aplicação na Agricultura. 2. ed. Brasília: Embrapa/CPAC, 1998. 434 p.
NISTOR, M.-M. Groundwater vulnerability in Europe under climate change. Quaternary International, v. 547, p. 185-196, 2020. Available at: <https://doi.org/10.1016/j.quaint.2019.04.012>. Accessed on: Aug. 29, 2019.
NOBRE, R. C. M.; ROTUNNO FILHO, O. C.; MANSUR, W. J.; NOBRE, M. M. M.; COSENZA, C. A. N. Groundwater vulnerability and risk mapping using GIS. modeling and a fuzzy logic tool. Journal of Contaminant Hydrology, v. 94, n. 3-4, p. 277-292, 2007. Available at: <https://doi.org/10.1016/j.jconhyd.2007.07.008>. Accessed on: Feb. 12, 2020.
NOVOA, V.; AHUMADA-RUDOLPH, R.; ROJAS, O.; SÁEZ, K.; BARRERA, F.; ARUMÍ, J. L. Understanding agricultural water footprint variability to improve water management in Chile. Science of the Total Environment, v. 670, p. 188-199, 2019. Available at: <https://doi.org/10.1016/j.scitotenv.2019.03.127>. Accessed on: Aug. 23, 2019.
OKADERA, T.; WANG, Q-X; DENI, E; NAKAYAMA, T. Groundwater monitoring for evaluating the pasture carrying capacity and its vulnerability in arid and semi-arid regions: A case study of urban and mining areas in Mongolia. Earth and Environmental
This is an open access article distributed under the terms of the Creative Commons license.
OLIVEIRA, A. H. B. de. Avaliação Ambiental e Forma de Transporte de Agrotóxicos Organoclorados no Rio Jaguaribe-CE. 102f. Dissertation (Mestrado) – Programa de Pós-Graduação em Ciências Marinhas Tropicais do Instituto de Ciências do Mar, Universidade Federal do Ceará, Fortaleza, 2012.
RESHMA, R.; SINDHU, G. Assessment of groundwater vulnerability to contamination: a case study. Environmental Monitoring
and Assessment, v. 191, n. 6, 356, 2019. Available at: <https://doi.org/10.1007/s10661-019-7493-1>. Accessed on: Aug. 30, 2019.
SAKALA, E.; FOURIE, F.; GOMO, M.; COETZEE, H. GIS-based groundwater vulnerability modelling: A Case Study of the Witbank. Ermelo and Highveld Coalfields in South Africa. Journal of African Earth Sciences, v. 137, p. 46-60, 2018. Available at: <https://dx.doi.org/10.1016/j.jafrearsci.2017.09.012>. Accessed on: July 15, 2019.
SANTOS, T. L.; NUNES, A. B. A.; GIONGO, V.; BARROS, V. S.; FIGUEIRÊDO, M. C. B. de. Cleaner fruit production with green manure: the case of Brazilian melos. Journal of Cleaner Production, v. 181, p. 260-270, 2018. Available at: <https://doi. org/10.1016/j.jclepro.2017.12.266>. Accessed on: July 15, 2019.
SECRON, M. B.; MONTAÑO, M.; MIGUEZ, M. G.; JONOSKI, A.; AZEVEDO, J. P. S.; POPESCU, I.; ROSMAN, P. C. C. Proposal of a hydric index to support industrial site location decision-making applying a fuzzy multi-attribute methodology. Ecological Indicators, v. 83, p. 427-440, 2017. Available at: <http://dx.doi.org/10.1016/j.ecolind.2017.08.002>. Accessed on: June 29, 2019.
SIQUEIRA, T. Emprego de Sources de contaminação de diferentes geometrias nas estimativas do risco à saúde humana devido à ingestão de água subterrânea contaminada. Revista Brasileira de Ciências Ambientais (Online), n. 43, p. 85-100, 2017. Available at: <https://doi.org/10.5327/Z2176-947820170113>. Accessed on: July 1, 2020.
SORANDO, R.; COMÍN, F. A.; JIMÉNEZ, J. J.; SÁNCHEZ-PÉREZ, J. M.; SAUVAGE, S. Water resources and nitrate discharges in relation to agricultural land uses in an intensively irrigated watershed. Science of The Total Environment, v. 659, p. 1293-1306, 2019. Available at: <https://doi.org/10.1016/j.scitotenv.2018.12.023>. Accessed on: Aug. 23, 2019. SOTO, M.; KIANG, C. Avaliação da condutividade hidráulica em dois usos do solo na região central do Brasil. Revista
Brasileira de Ciências Ambientais (Online), n. 47, p. 1-11, 2018. Available at:
<https://doi.org/10.5327/Z2176-947820180169>. Accessed on: July 1, 2020.
STADDON, C.; SCOTT, C. A. Putting water security to work: addressing global challenges. Water International, v. 43, n. 8, p. 1017-1025, 2018. Available at: <https://doi.org/10.1080/02508060.2018.1550353>. Accessed on: June 27, 2019. TEIXEIRA, Z. A. Processos determinantes da qualidade das águas subterrâneas da Formação Jandaíra na Chapada do
Apodi/CE. 144f. Thesis (Doutorado) – Departamento de Geologia, Programa de Pós-Graduação em Geologia, Centro de
Ciências, Universidade Federal do Ceará, Fortaleza, 2015.
TIBEBE, D.; KASSA, Y.; MELAKU, A.; LAKEW, S. Investigation of spatio-temporal variations of selected water quality parameters and trophic status of Lake Tana for sustainable management. Ethiopia. Microchemical Journal, v. 148, p. 374-384, 2019. Available at: <https://doi.org/10.1016/j.microc.2019.04.085>. Accessed on: Aug. 23, 2019.
USSAMI, K. A.; GUILHOTO, J. J. M. Economic and water dependence among regions: The case of Alto Tiete. Sao Paulo State. Brazil. Economia, v. 19, n. 3, p. 350-376, Sept./Dec. 2018. Available at: <https://doi.org/10.1016/j.econ.2018.06.001>. Accessed on: Aug. 23, 2019.
WEIHS, M.; SAYAGO, D.; TOURRAND, J.-F. Dinâmica da fronteira agrícola do Mato Grosso e implicações para a saúde.
Estudos Avançados, v. 31, n. 89, p. 323-338, 2017. Available at: <https://doi.org/10.1590/s0103-40142017.31890024>.
Accessed on: Feb. 6, 2020.
ZHAN, X.; HUANG, M.-L. ArcCN-Runoff: an ArcGIS tool for generating curve number and runoff maps. Environmental
Modelling & Software, v. 19, n. 10, p. 875-879, 2004. Available at: <https://doi.org/10.1016/j.envsoft.2004.03.001>.