people with Interaction Flows
DOI: 10.1590/1809-5844201825
Fernanda Chocron Miranda1
http://orcid.org/0000-0002-1774-6402
David Geerts2
https://orcid.org/0000-0003-3933-9266
1(Universidade Federal do Rio Grande do Sul, Faculdade de Biblioteconomia e Comunicação, Programa de Pós-Graduação em Comunicação. Porto Alegre – RS, Brasil)
2(Katholieke Universiteit Leuven, imec, Meaningful Interactions Lab. Leuven, Bélgica)
Abstract
This text presents the results of a diary study (based on a deck of cards) conducted for two weeks, followed by semi-structured interviews with ten female participants who live in a mid-sized student town in Belgium. The findings reveal the diversity of current video watching practices prevalent in this era of media convergence and how they are the result of pluri-dimensional combinations that these young people construct based on different genres and types of content, providers and screens used in different locations and temporalities. As results, we present four types of interaction flows, each centred on one fixed element: favourite content, a certain provider, a specific time or location. These flows illustrate how new video watching practices coexist with traditional habits, and that they are the result of the reshaping of behaviour described in previous studies.
Keywords: Video consumption. Interaction flows. Diary study. Young people. Belgium.
Introduction
Television is currently in a strong technological transition as a variety of providers, platforms and technologies enable different ways of watching videos. Given this context, the new generations of young people demand special attention considering that they are
often the first ones to adopt new technologies. As Martín-Barbero (2014) described, this
group has a preference for audio-visual and digital resources. Those are the languages through which they establish sociocultural practices and bond with their peers. Because these trends are evolving so fast that it is hard for research to keep up, this study wants to give some insights into the current consumption practices among this group.
Our main focus is to identify the practices of watching TV and to create typologies
based on the interaction flows assembled by young people. In our understanding, interaction
viewers, in which different kinds of content (genre/format and live, recorded and/or on demand), providers (broadcast and/or online platforms), and multiple screens (synchronized or not) used in different locations and temporalities are involved.
Defining interaction flows means to characterize the associations of those watching
components performed by young people. For that, we set up a study in October and November 2017, in a mid-sized student town in Belgium, with ten female participants (18-23 years old), all university students1.
The study employed a card-based diary, composed by a stack of 93 cards, stored in a plastic box. Instead of a traditional diary as commonly applied in the Human-Computer Interaction domain – based on a linear structure to be completed – the idea was to provide something non-linear, portable and easy to be handled by the participants everywhere they could be possibly watching videos. This format was also convenient and fruitful for facilitating the data analysis process, allowing us to cluster the cards (individually per participant and in groups), to verify patterns and to identify the different associations/ combinations made by the participants with the resources that they have available in their media consumption contexts.
This paper presents significant findings regarding video watching practices among
young female students. Its main contribution is the characterization of four types of interaction
flows based on the viewing behaviour of our participants. It demonstrates the diversity of
watching practices that manifests itself in the current context of media convergence and how new behaviours based on technological possibilities coexist with traditional habits. Finally, it presents an approach that can allow other researchers to characterize similar
interaction flows for other target groups.
Related work
Understanding new practices of TV consumption has challenged many researchers and practitioners in the last years. According to Courtois et al (2012), given the current context of media convergence, there is a tension between the domestic practices of watching, related to the micro context, and broader social watching practices, which makes TV consumption
much more fluid and spread over time and several screens. They argue that we have to take into account different social spatial configurations, moving from private to public spaces.
In one of the earliest attempts to make sense of these changes, Barkhuus & Brown (2009) described how the introduction of new technologies to record and download TV
1 This study is part of a doctoral research in progress at UFRGS and KU Leuven and was developed during a study mission at Mintlab (KU Leuven), funded by the Brazilian development agency CAPES (Coordenação de Aperfeiçoamento de Pessoal de Nível Superior), via scholarship of the ‘Comparative matrix of qualitative research with digital technology users’ Project, an international cooperation initiative between UFPA, KU Leuven and UFRGS, which was approved on the 2nd Call of the International Cooperation Program (Programa Geral
shows, such as personal video recorders (PVRs) and computers, reconfigured the daily
practices of watching television at home. Through the use of PVRs, DVD players and the internet, video content is more and more being watched in a time-shifted way.
Based on in-depth interviews with users of those technologies in the United Kingdom, Barkhuus & Brown (2009, p.20) reported how these new possibilities affect ‘the broad spectrum around watching’, considering that now people can choose what to watch, when, where and with whom. Therefore, in this new context it is crucial to understand how people organize their watching practices based on different levels of enjoyment and pleasure and how those technologies facilitate a more selective behaviour.
In an earlier publication regarding the same study, Brown & Barkhuus (2006) proposed the notion of the ‘TV lifecycle’ which goes from searching information about
a show, selecting and recording or downloading the content and defining when and with
whom to watch, before actually sitting down and watching it. The authors showed that even
though it changed the rhythm of TV consumption (not anymore guided by the linear flow),
these new possibilities increased the engagement to TV content among their participants.
This resonates with what Orozco Gómez (2014) say regarding the specific grammar of TV
content. Independently of the technology used for accessing video content (live, recorded or on demand), we have learnt to watch it on the TV set and have established a sensorial
and emotional relationship with content with specific paces and familiar narratives and with
which we are already engaged.
Around the same period, Rudström et al (2009) described how the respondents of a questionnaire in Sweden were using and appropriating on demand content, at that moment available mostly on computers. The study revealed that even though the users were interested in time-shifted video and were not dependent of TV schedules anymore, they kept watching
specific content (news, sports, others) directly on TV and launched in a linear grid.
More recently, Vanattenhoven & Geerts (2015), based on in-home interviews with households in Belgium, described how the traditional broadcast model and the possibilities of on demand watching are still organized around daily household routines. On the other hand, different ways of watching demand different levels of attention to the content. They concluded that ‘the current situation of several fragmented services (...) can make it quite hard for the end users to watch TV the way they would like’, showing that just having access to these new possibilities does not automatically lead to a smooth viewing experience (VANATTENHOVEN; GEERTS, 2015, p.81).
In an even more recent study, Shokrpour & Darnell (2017) did naturalistic observations at home (using portable cameras) in the United States, followed by in-home visits and
interviews. They recognized several practices of multitasking and identified four levels
long time, and guided by the linear programming logic of TV. She identifies ‘the regime of
contemplating’ and ‘the regime of peeking’. In the former, the viewer has the habit of turning
the TV on for its content, something specific that he/she likes and requires attention. The
latter is about turning on the TV as background for a number of other activities, including watching audio-visual content through other screens.
Through ethnography at homes in the United Kingdom, Rigby et al (2017) observed
how people build a multi-flow of content with different devices used simultaneously. They
found that their participants still value the social aspect of sitting together to watch something in the living room, while at the same time everybody is also viewing random videos in parallel on other screens, related or not to the content of the TV set. It reveals that television still works as a meeting point, even though it now includes the use of other devices.
These studies indicate how the process of consuming television content makes space for new ways of ‘watching TV’. That is why, for Scolari (2014) a proper description of
daily practices needs to go beyond following a programming-oriented flow and include watching a video on YouTube, illegally downloading a movie or watching it on streaming
platforms, among other possibilities.
While the studies mentioned above involve a wide range of viewers, we focus on
female university students, as a specific group of viewers viewing video content using the
newest technologies and services. Similar to our target group, Barkhuus (2009) performed semi-structured interviews with college students (19-23 years old) from California (United States), who lived part-time with their parents. She showed how the video watching practices among young people were taking place more frequently on computer screens than on a traditional TV set. However, instead of being a negative experience, it increased their engagement with TV content and allowed new forms of socializing around content, both face-to-face and through online platforms. Even though the participants tended to personalize their viewing practices, TV still played an important role in the social experience ‘not as communal watching, but instead through communication around television programs’ (BARKHUUS, 2009, p.2479).
In addition, while most studies focus on the living room or the home as location for watching TV or online videos, we aim to cover a broad range of locations, as well as viewing times and video services. Using a diary method followed by an in-depth interview performed with participants from the United States, McNally & Harrington (2017) showed how millennials view mobile video, what their motivations are, and how they access this content.
Our study aims to build on and add to existing research efforts, by offering a structured approach to characterize emerging viewing behaviours, using the concept of interaction
flows. Through four examples, based on a very specific target group, we show how we
show how viewers combine these new technologies and services to build new situations of watching, which sometimes have the same motivations as and coexist with traditional viewing habits.
Methodology
We conducted a card-based diary study from 7 to 21 November 2017, followed by individual semi-structured interviews, held between 21 and 24 November 2017. The diary cards were delivered to and completed by ten female participants (18-23 years old), being
eight Belgian and two Dutch. They filled in cards reporting every time they watched TV
and online video during that period, at any location and with any video service. As a result,
each card represents a specific configuration of watching TV or online video. Afterwards,
each participant was interviewed based on the input they wrote on their cards.
We recruited the participants through an announcement on our research group’s social media account (Facebook and Twitter) and asked colleagues to share it in order to reach a wider group of people. In the announcement, the research schedule was mentioned (with dates and the place for interviews and diary delivery) as well as that there would be a small reward for the participants (a gift voucher for a VoD platform or the cinema). The invitation for the study was also placed on the notice board of one of the larger students’ houses of the university and announced in the classroom of an HCI course. In the announcement, there was a link to a short questionnaire to be completed by the people who were interested. Between 23 October and 7 November 2017, ten female participants signed up.
Often qualitative studies are criticized for their impossibility to generalize results. However, the aim of qualitative research is providing in-depth insights about micro
processes of a non-representative sample, which have the same scientific value as the
macro analysis performed via quantitative studies (HAGUETTE, 1987; OROZCO GÓMEZ; GONZÁLEZ, 2011).
The focus on a very specific group (ten female young participants, from a specific region in Europe and with a high education profile) added value for this study. Although this
precludes us from making general statements about a wider population, it was a productive experience of mapping and analyzing qualitative data and it enabled us to explore the
analytical potential of the interaction flows.
As we will present in this section, the combination of diary study and interview
provided us with a significant amount of structured data from each participant. This
demanded two levels of analysis: one by each participant and one grouped. Based on this dual approach, we were able to identify the interaction flows that reveal how the participants make their decisions, what the motivations of their video watching practices are and how
those situations are fluid and related to very specific preferences, which go beyond the
Participants Profile
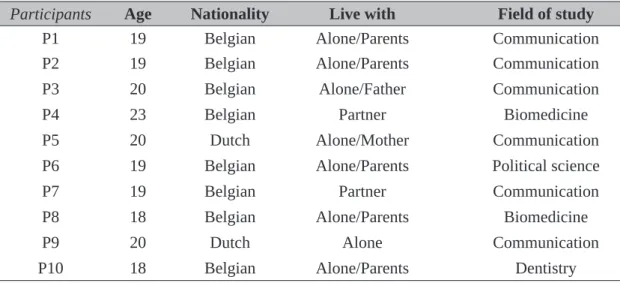
Except for P4 who is a master’s student, the other nine participants are bachelor students. Because of their studies, eight out of ten live alone in a student house in the city where they study. Seven of them only during weekdays, spending the weekends at their parents’ house, and one lives permanently (P9) in the student town. Two participants (P4
and P7) live with their partners. The profiles are summarized in Table 1:
Table 1 -Participants profile
Participants Age Nationality Live with Field of study
P1 19 Belgian Alone/Parents Communication
P2 19 Belgian Alone/Parents Communication
P3 20 Belgian Alone/Father Communication
P4 23 Belgian Partner Biomedicine
P5 20 Dutch Alone/Mother Communication
P6 19 Belgian Alone/Parents Political science
P7 19 Belgian Partner Communication
P8 18 Belgian Alone/Parents Biomedicine
P9 20 Dutch Alone Communication
P10 18 Belgian Alone/Parents Dentistry
Source: Created by the authors.
Three participants work regularly in addition to their studies: P2 works every day at a bakery; P4 is responsible resident at a students’ house and works part-time at the laboratory coordinated by her supervisor; P6 works every Saturday in a department store in the city where her parents live. In addition, P1 mentioned that sometimes she babysits and P3 would like to start working voluntarily in a cinema.
Regarding technology possession and media consumption practices, every one of them stated having one smartphone and one laptop as their personal devices. P3 also has a tablet, which is used regularly only by her. P4, P7 and P9 have their own television at home (two living with their partners and one alone) and the others have a TV set at their parents’ house, being two TV sets in case of P2 and P6. P6 and P8 also have Smart TV at their parents’ house and P7 and P10 regularly connect the laptop and the TV in the living room.
All participants have access to Wi-Fi at home (parents/partners and students’ house) and also count on the availability of an internet signal in all the spaces of the university. Three participants do not have mobile data on their smartphones (P4, P8 and P10), as they do not want to be connected all the time. The other participants have the service but never
when they are outside and there is no Wi-Fi connection. On the cards, only P9 reported situations where she used mobile data for watching something. According to her, this is because the Wi-Fi connection is not that good at her students’ house. The participants’ parents in general pay for this service, except in the case of P9.
Except for P7, P9 and P10, all participants have a Netflix subscription. In the case of
P6 this is a family account but she is not allowed by her mother to use that in her student’s town, because she has to be focused on her studies. P3 has a subscription of her own, and
the other five participants have a shared subscription with family and friends.
Diary study material
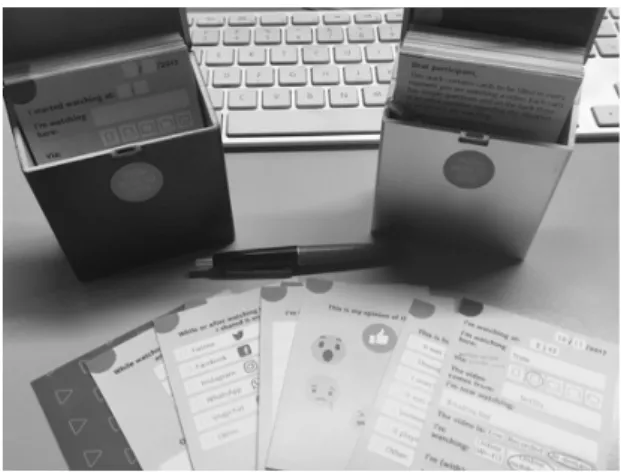
On 7, 8, and 9 November 2017 we handed the diaries over to the participants, along with the consent form, and briefed them about the material and how they should use it. The diary consisted of a small plastic box (see Figure 1), including a small-sized pen, in which there were 93 cards:
• 80 pocket-sized cards with ten sections to be completed characterizing a specific moment of video watching: the time and where they were watching, the title of the content, info about screen, provider, type of content and internet connection and if the experience was alone or with someone. On the back of each card there was an extra question, randomly distributed from eight different questions regarding the use of second screen, practices of commenting/sharing content on social media, opinion/mood about the watched content, how they ended up on the content and possible multitasking while watching;
• 12 darker coloured cards with questions about the participants’ profile (personal data and information about possession and use of technology);
• One instruction card and an example of how to fill-in the form in the cards;
Figure 1 - Diary material and example of cards
The goal of this diary format was to develop a portable solution to gather information in a wide variety of watching practices. It was easy to handle during daily activities and it was useful for collecting data over a two weeks period. This allowed us to cover possible ‘gaps’ that we would have missed with direct observation and/or working with structured procedures like questionnaires.
Interviews
From 21 to 24 November 2017, ten semi-structured interviews were carried out with the participants, with an average duration of 49 minutes, totalling eight hours and 15 minutes of audio and video recordings. Each interview was divided in three stages.
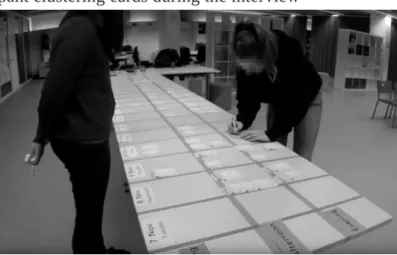
In the first, we worked with the participants on assembling a video watching calendar, in
which they had to distribute their cards per day and time and afterwards cluster them by provider and screen with the use of post-its (Figure 2). They then quickly read the cards and
identified them with coloured stickers to indicate when they watched online (versus offline)
and alone (versus in company). During this process, which lasted for about 25 minutes (the timing varied based on the amount of cards), we interviewed the participants about the cards placed on the table or about the lack of cards in a certain period.
Figure 2 - Participant clustering cards during the interview
Source: Research archives.
In a second stage, we discussed the profile of the participants based on the darker coloured cards that they completed. As a final stage, we asked more general questions about
their watching habits as written on the cards and if they were the same in the past, especially when they still lived in their parents’ house full-time.
in the QSR Nvivo 10 and placed each single input element from the cards in a previously prepared list of nodes, according to date, time, type of internet connection, type of content,
content watched, provider, location, others. Based on this data, we generated codification
matrixes in order to cross the data of the nodes according to the analysis interests.
Results
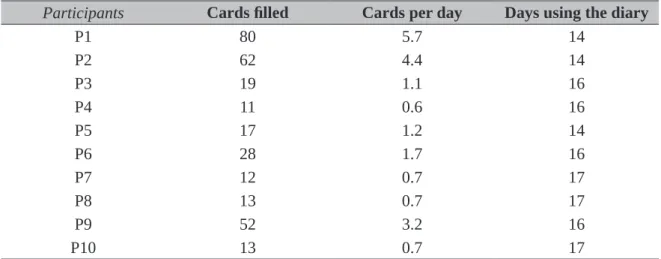
All participants taken together completed a total of 307 cards. The number of cards per participant was quite varied (see Table 2). The average number of cards per participant was 30,7 (sd=24,8). P1, P2 and P9 delivered an above average number of cards, respectively 80, 62 and 52. Other participants were below average, varying between 11 (P4) and 28 (P6) cards.
Table 2 - Amount of filled-in cards per participant
Participants Cards filled Cards per day Days using the diary
P1 80 5.7 14
P2 62 4.4 14
P3 19 1.1 16
P4 11 0.6 16
P5 17 1.2 14
P6 28 1.7 16
P7 12 0.7 17
P8 13 0.7 17
P9 52 3.2 16
P10 13 0.7 17
Source: Created by the authors.
Although there was a slight variation in the amount of days the participants had the diaries in their possession (between 14 and 17 days), this was not clearly correlated with the number of cards that were completed. On the contrary: P1 had her box for 14 days and
filled in all 80 cards available, while the participants with the least cards (P4 and P7), had
the diary for 16 and 17 days respectively. Checking the average number of cards per day, we can see that six out of ten participants had an average of more than one card per day (P1,
P2, P9, P6, P5 and P3), with P1 the most prolific one reaching the mark of almost six cards
Time of day & Location
We organised the cards with the participants by ‘morning’ (05h to 11h59), ‘afternoon’ (12h to 17h59) ‘evening’ (18h to 23h59) and ‘late night’ (00h to 04h59). For doing so, we used the time registered by the participants on their cards.
Looking at all participants’ data, the period when most videos were watched was the evening, with 44.6% of the total of 307 cards, followed by the afternoon with 33.5%. Only P2 and P9 had more cards with video watching moments on afternoons than any other moment, being 29 and 22 cards, respectively 46.7% and 44% of what each of them watched during the period of using the diary. Four participants didn’t watch any video in the late night period (P3, P4, P8 and P10). Three of them didn’t register any video-watching on mornings (P4, P7 and P8), which they described during interviews as the moment to study
and/or work. For five of the participants, more than 50% of everything that was watched
occurred during the evening, being almost 80% in the case of P3.
The location where most of the video watching took place was the students’ house (58.9% of the cards), notably their private room (47.8%). This was a place in which nine out of ten participants stated they watched videos during the study. The only participant that registered watching only at home was P7 as she shares a house with her partner, where most of her video watching occurred. In a second place comes the parents’ house (15.6%), where seven participants regularly go to on weekends/holidays, especially in the living
room (10.4%). Following closely we identified several places around the university campus
(8.4%) and a friends’ or neighbours’ house (8.1%) as places for watching TV/online videos. In both places, the majority of the watching practices were collective but with mixed motivations: from planned leisure time with friends (P1, P2, P3, P5 and P9), to the need of entertaining someone while babysitting (P1).
In the few cases in which video watching occurred in a university classroom/
auditorium, five cards (1.6%) were reporting video content shown by professors (P1 and
P2) and 5 other cards were related with a moment of drawing attention away from the classes to check and watch “random” stories or content available on their timelines of
Instagram and Facebook, in all the cases using the smartphone (P1, P2, P5 and P7).
An interesting aspect is that some cards were completed in the bathroom. Although there are not many given the total corpus (only eight cards from four participants, 2.6%), it reveals the level of penetration reached by this format of diary, in comparison with other
studies that limit their data collection to specific places in the participants’ houses (see e.g.
Shokrpour; Darnell, 2017).
Regarding evenings, the interviews showed that even for the students that are living outside of their parent’s house during the week, in the evening the routine is similar to what
they had in the past. For instance, P4 commented that when she first left her parents’ house
for studying and she didn’t have a TV set at her student room, her practices of watching were concentrated on the laptop screen and almost everything was online and on demand. Nowadays, living with her partner where there is a Smart TV in the living room, she still watches online but feels that now her practices are more or less the same as what she had in the past, especially combining TV watching with other activities. This, according to her, was impossible when watching on a laptop, because it demands full attention.
Even among the participants that watched more on their laptop, the cards reveal certain video watching habits that could be seen as ‘traditional’ in this period, directly linked to sitting/lying in the living room or bed, or preparing and eating meals followed by relaxing while watching favourite content on a regular basis (P1, P2, P3, P4, P5, P7 and P8).
On afternoons the watching practices vary. Most frequent among the participants are the ones that take place in the breaks between studying activities (P1, P2, P3, P6 and P9), household chores in general such as ironing, cooking, dishing and others (P1, P2, P5 and P6), physical exercises (P4 and P8), weekend relaxing (P1, P3, P4, P5, P9) or while waiting (P2 and P9). During household chores, in most of the situations the TV content was in the background.
Watching alone
versus
in company
We identified a concentration of watching moments in friends’ or neighbours’
houses in the afternoons and evenings, notably on Thursdays, Fridays and Saturdays. With the exception of three cards (0.9%) in which P1 was babysitting in the mornings, every
other situation reported by five participants (P1, P2, P3, P5 and P9) is linked to planned
moments of collectively watching content of common interest, often being medium-length
and long videos, from series episodes, reality show finales, to movies. We highlight the
shared watching situations between P1 and P2, who are childhood friends and when they are in the town where they study and live in the same building, they gather together at evening-time to watch series and soap operas during meals. Similarly, sisters P2 and P8 also both live outside their hometown to study and often get together during the week at evenings to watch something.
We also identified collective watching practices linked to the participants’ family,
such as P4 and P7, who regularly watch with their partners they live with, as well as P3, P5, P6 and P10 who, when at home with their parents and siblings, follow the ritual of sitting on the couch and watching something after dinner. These practices are directly linked to more
together. There is even specific content that is watched by the family of P10 on Saturdays
(the human interesting ‘Iedereen beroemd’ from één2), the family of P7 on Sundays (the
talk show ‘Zondag met Lubach’ from NPO3) and the family of P6 on Fridays and Sundays:
‘On Friday evening, like, everybody is home, eats pizza together and watches TV. (...) And Sunday night was [before going to university] traditionally the moment to see a quiz program and something about a police series or so on één’ (Interview with P6).
During the interview, P6 explained that with the Netflix subscription of her mother,
the watching practices changed a little in her house, but she and the family attempt to keep
the habit of collectively watching in order to have an “official” moment to gather everyone
together. TV, which is now fuelled by on demand content, is still a meeting point and to exemplify that, there is one of the cards of P6, in which she registered that she watched
episodes of the ‘Sherlock’ series (Season 4), available on Netflix, on the Smart TV in the
living room of her parent’s house along with her family and her boyfriend.
P4 also mentioned what for her makes the difference to watch together, especially when she lived in her parents’ house:
‘I think when I was still living at home I watched more, like, action movies and action TV shows, because I was with my father. So, I was always, like, also looking for the TV shows, because I wanted him to sit next to me and watch together. But now I’m not really into action anymore, because I’m alone and really, like, choosing my thing’ (Interview with P4).
Although we identified several collective practices in the diaries of the ten participants,
it is important to mention that the moments they are watching content on their own occurred slightly more (55.7%) than the ones in which the participants were in company (44.3%). For some participants, this difference is more outspoken. Five out of ten participants have more than 60% of their cards showing they were watching alone, up to 92% in the case of P6 and 84% of P10, even though they both stated the importance of watching TV with family. Only P2, P7 and P9 have most of their cards linked to collective watching (51%, 75% and 68% respectively).
Providers
Based on the content of all 307 cards, 13 different categories of providers were
identified (see Table 3). The most cited providers on the cards were Netflix (28.6%),
YouTube (23.7%), Facebook (11.7%) and the channel één of the Belgian Public Broadcaster
VRT (6.5%). There are also 12 cards (3.9%) with content from Popcorn Time (a program for downloading and watching movies and series for free) and another 12 (3.9%) from
Instagram. Eight out of ten participants reported watching content from Netflix. Next comes Facebook (seven participants), YouTube and één (six each) and Popcorn Time (three).
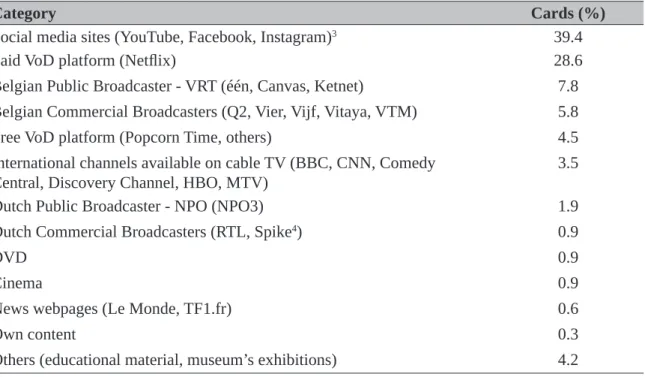
Table 3 - Percentage of cards per category of provider
Category Cards (%)
Social media sites (YouTube, Facebook, Instagram)3 39.4
Paid VoD platform (Netflix) 28.6
Belgian Public Broadcaster - VRT (één, Canvas, Ketnet) 7.8
Belgian Commercial Broadcasters (Q2, Vier, Vijf, Vitaya, VTM) 5.8
Free VoD platform (Popcorn Time, others) 4.5
International channels available on cable TV (BBC, CNN, Comedy Central, Discovery Channel, HBO, MTV)
3.5
Dutch Public Broadcaster - NPO (NPO3) 1.9
Dutch Commercial Broadcasters (RTL, Spike4) 0.9
DVD 0.9
Cinema 0.9
News webpages (Le Monde, TF1.fr) 0.6
Own content 0.3
Others (educational material, museum’s exhibitions) 4.2
Source: Created by the authors.
Crossing the data of providers with the type of content, classified by live, recorded
(on the set-top-box, without using an internet connection) and on demand (which needs the device to be connected to the internet), we saw that just 6.1% of the total of 307 cards reported live content (5.2% on TV and 0.9% on the laptop) and 7.4% were recorded and watched on the TV set. Even content produced by traditional media companies, which are primarily broadcast live, were watched predominantly online and on demand.
From the 50 cards (16.2%) that mention programs of broadcasters of the Netherlands and Belgium, 5.8% were on demand, 5.8% were recorded and only 4.5% were live. Among that amount, 7.8% refers to content produced by VRT, 6.5% of channel één. However, 3.9% out of this total were watched on the online platform één.be (2.9% on demand and 0.9% live)
3 We adopt the definition of social media sites proposed by Recuero (2017).
and 2.6% via the TV set tuned to één (1.6% live and 0.9% recorded). From the six participants that cited these providers in their diaries, four of them watched programs only on the TV set, one on één’s online platform on a laptop, and one who watched both on TV and online.
Different screens and diversity of content
From the total of collected cards in the study, 52.1% cited laptop as the viewing screen, 19.8% smartphone and 20.1% TV (being 13.3% the traditional set, 4.2% Smart TV and 2.6% connection between TV and laptop)5.
When we look at the use of screens per participant, the laptop appears as the most
used for five out of ten participants, reaching 83.7% of the cards of P1. For P6, 92% of
her watching was on the smartphone where she mostly watched shorter online videos. P3, on the other hand, watched 47.3% of the content registered in her diary using a tablet and 31.5% on the TV screen in her father’s house. P4 and P7 mainly registered situations on the TV screen: 91.6% in the case of P7 (being 33% connected to a laptop) and 84.8% in the case of P4, on a Smart TV.
The participant that proportionally watched more content on TV itself without a connection with the internet or another device was P7 (26.3%), followed by P9 (23.1%) and P3 (22.5%). The other ones had between 85-90% of their watching on portable screens connected to the internet or Smart TV, with emphasis on the use of Wi-Fi. As explained earlier, only P2 and P9 registered that they sometimes use mobile data to connect their devices. In only one of the cards, P2 registered that she watched, for some minutes, stories on Instagram in a waiting
room. And P9 mentioned in 36.5% of her cards both the use of Facebook and YouTube to
watch short clips while she was outside (e.g. train station), as well as longer videos, including
watching movies and series via Popcorn Time and Netflix at home.
Regarding the genre of the content watched by the participants, the preference for online content, like series, movies, vlogs and short clips on social media is clear. The most
cited content was online series, especially available at Netflix, being almost 30% of 307
cards, from nine participants. Among them, 8.1% of the cards were related to ‘Breaking Bad’ (P1 and P2); and 5.8% ‘Stranger Things’ (P1, P3, P4, P7 and P9), that was watched through
Netflix but also Popcorn Time. After this comes 9.7% of the cards from seven participants
(P1, P2, P5, P6, P8, P9 and P10) regarding short clips or videos on the timelines of social
media sites (especially Facebook, YouTube and Instagram) and 8.1% of cards that mention
vlogs (P1, P2, P3, P9 and P10).
As we can see, among the most watched content that was identified on the diaries,
there are no programs produced by national broadcasters, nor in the mother tongue of
5 This does not include the use of the laptop, smartphone or tablet as second screen, although most participants, except P10, confirmed
the participants. Even though Dutch-speaking youtubers were reported, most youtubers
watched are American, as clarified during the interviews. When asked about this watching profile, many participants expressed surprise because before, due to the presence of a TV
in their parents’ house, they used to watch more locally produced contents. For P5, this is interesting because it is a way to practice English, but P1 lamented the fact of having less national content in her cards.
In general, most of the content watched by the participants, with the exception of movies and series episodes, is short and watching usually happens in sequence with other videos. The amount of short videos watched is regulated by the time available, either between study breaks, during meals, as procrastination and/or as relaxing moments or even in planned moments in the weekends. Because of the fact that they are shorter, they are more frequent and spread over different times of the day, even though the consumption practices are similar, as is presented in the next section.
Interaction Flows
Given the plurality of content available on different platforms, accurately assessing on which screen the audience is watching is practically impossible nowadays. According to Orozco Gómez (2010, 2011), we are facing the “transit of audiences”, which means that TV and its content is in every place and thus viewers move around different digital
environments and screens, complementing and reshaping the flow of watching TV content.
The current context requires creative forms of observations and analysis.
That is why, in addition to identifying watching practices and their frequency, our focus was to map the interaction flows established by the participants based on the combination of different elements (time, location, genre, screen, provider, type of content, connection).
In order to achieve this in a structured way, we based ourselves on the timetables
assembled with the participants’ cards, and identified four common types of interaction flows, each of which has a specific element as a central part of the experience.
Flow 1 – My favourite content, no matter where
In the diaries of P1 and P2 we noticed a recurring program: the soap opera ‘Thuis’. Among the 20 cards (6.5%) that referred to the channel één, 4.2% mention this content. The set of cards referring to that program allows us to observe a clear example of the multiple watching possibilities available today.
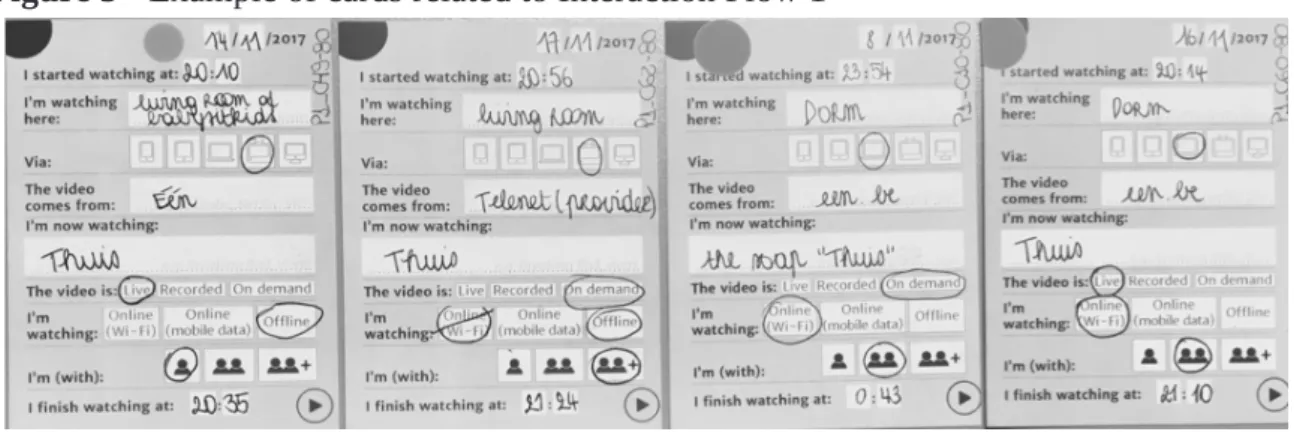
In Figure 3, we can see how one specific program, daily followed by P1, guides
Figure 3 - Example of cards related to Interaction Flow 1
Source: Research archives.
The first card illustrates a more traditional way of watching, which is the program
being broadcast live on the TV, with no need for an internet connection, watched in the living room at her parents house. In the second card, although it is still done in the living room and on the TV screen, the provider changes, since it is a video available via the cable provider (Telenet), which offers on demand content from channel één through its own platform. In the third case, the location is P1’s bedroom in her students’ house, and because there is no TV there, the watching happens on één’s VoD platform, on a laptop screen that was connected to Wi-Fi. Lastly, we have the fourth card shaped similarly to the third, using a laptop and watching online in the student’s house, but the content accessed on the provider’s platform is live, which allows simultaneous interactions with other viewers that follow the content via TV or other online devices, as P1 does.
The element time of the day never varies and all the cards reported watching moments in the evenings and lasted around 30 minutes (each episode lasts 25 minutes). In the most part of the cards where P1 watched ‘Thuis’, she was in company.
The recurrence of watching practices via devices connected to the internet identified
Flow 2 – Relaxing in the living room at night
6This flow was identified in several diaries (P3, P4, P5, P7, P8, P10 and one card of
P6) and is characterized by the time that our participants want to relax in the living room by watching something on the TV screen, which could be a normal TV set, a Smart TV or a connection between TV and laptop. In general, the TV is the screen to dedicate attention to, but depending on the content it can also serve as a meeting point (P3, P4, P5, P6, P7, P9 and P10) or as background content while doing some other activity (P3, P4, P7 and P10). As in Flow 1, the watching situations happened mostly in company (parents, partner, friends). Most of them were during evenings or late night periods, especially on weekends (including Friday evenings).
Even though the screen and the place are the same (as in the past), the content varies a lot, going from informative videos such as documentaries, to entertainment such as episodes of series, movies, live shows and reality or talent shows.
The content varied not only in genre but also in type. The most part of the cards refers to on demand (P4, P5, P6 and P7) and recorded (P4, P8 and P9) content. Live content was mentioned by P3, P5, P7, P8, P9 and P10. It is interesting to point out that the only 2 cards reporting news content (P9 watched CNN and P3 ‘Het journaal’ on channel één)
relates to this flow, the first being live and the second recorded. In 75% of P7’s cards, the
situations were in the living room, using the laptop connected by cable to the TV screen and by air to Wi-Fi. The content was on demand provided by Popcorn Time. This was similar to P4, who had 54% of her cards reporting that she watched on demand content in the living
room, in her case from Netflix using a Smart TV connected to Wi-Fi.
Our participants sometimes plan and book time to watch something that is live on TV, other times they pick a movie or series on demand, they just watch what is passing on TV, or they select something they recorded earlier. The criteria to select the content depends on if they are alone or not, always with the focus to chill and to relax. This evidence refers to what Barkhuus & Brown (2009, p.12) calls “TV as the default evening entertainment”. On the other hand, as indicated by Abreu et al (2017), one of the biggest challenges for the on-demand platforms was if people would engage themselves and invest time seeking for something to watch, instead of just turning on the TV and seeing what is available, as happens with linear TV.
On the cards that match with this flow, we noticed that our young participants easily
deal with both possibilities. They do not mind managing the resources that the selected content demands (provider and connection), but are also still zapping (P3) or just watching something that was on TV (P3, P4, P5, P7, P8, P9 and P10). In any case, the most important is being together to watch something focused, or just “ambient watching” (BARKHUUS; BROWN, 2009, p.14).
6 This is not a new category to classify time. It includes ‘evening’ and ‘late night’, in which the most part of the situations reported in
Flow 3 – Anything from Netflix when I’m free
As in Flow 1 the content was central, and in Flow 2 the location and time, in Flow 3 the provider is the element that guides the watching situations. Based on the number of
cards, we can say that this was the most common flow, identified in all the diaries, except by P7 and P10 who do not have Netflix subscription. Both are used to watch more on free services like Popcorn Time and YouTube.
For this flow, time of the day always varies considering that the most important for the participants is to take advantage of some free time to watch something from Netflix. This is similar to what Mcnally & Harrington (2017) identified as “downtime” and “taking a break” scenarios. The motivations seem to be: fill time, let the mind rest, relieve stress, avoid boredom or just relax. In contrast with the previous flows, here the practices are mostly alone, but we also identified cards where the participants were with friends or colleagues.
In those situations, there is no time to look and select something new. The focus is to quickly occupy some free time, which is the easiest by following some known content
until the end of an episode, a season or a series. In this flow, the content is in majority series from different genres and themes but always from Netflix and in the most part related to fictional narratives.
This flow usually happens on weekdays and during breaks of classrooms/studying moments or after finishing activities at the end of the day. We also identified a case of ‘binge watching’ by P1 on the weekends related with this flow.
The screen usually is the one that the participants also use for work or study situations and which they have easily available at that time, such as the laptop or tablet. On the other hand, the location must be where the participant can concentrate and pay full attention to the content, such as their student room but also their room at their parent’s home. Only in
the case of P2, we found cards reporting the kitchen as a location for this flow. She is one of the participants with the most cards filled and her watching situations – not only related with Netflix – occurred in many locations.
The most common combination of elements was: the participants watching series on demand on Netflix, via a laptop connected to Wi-Fi, at the student room, mainly alone. It represents 58.8% of P5’s cards, 42.1% of P3, 38.1% of P8, 30.6% of P2, 25% of P1 and 16% of P7.
Flow 4 – Passing time watching videos on Social Media
In this flow the situations are always online because all of them are based on content watched through social media sites, especially YouTube, Facebook and Instagram. Despite
the fact that each platform allows different types of interactions and ways to view and share
content, including live streaming and self-produced content, we identified in our study
material, music clips, animal clips, recipe clips, cartoons, memes, gifs, content produced by friends, others), launched on the timeline of social media sites.
Those cases were apparent in the cards of seven participants (P1, P2, P5, P6, P8, P9 and P10). It happens mostly during afternoons and evenings and it is also related with the
scenarios of ‘taking a break’, ‘first thing in the morning’ and ‘just before going to sleep’ (McNALLY; HARRINGTON, 2017). Those are shorter occasions than what characterizes
Flow 3 and they are related to non-interrupted viewing and procrastination. The focus is passing time, checking for updates and being informed, or just relaxing.
It can be everywhere and during any activity. We identified cards from participants
watching random videos during class, while chatting or studying in the university’s restaurant, in the kitchen while cooking and/or eating something, in the doctor’s waiting room, in the bus, in the train station, while watching something else on TV, during studying breaks, in the bedroom just lying on the bed/couch or in the bathroom. The screen also varies a bit between smartphone and laptop, especially regarding content from YouTube. In the case of Facebook and Instagram all participants were using the smartphone.
This flow represents a significant part of the cards collected, being 92.8% of P6’s
cards, 61.5% of P10, 51.6% of P2, 48% of P9 and 41.2% of P1. It is important to remember that in this Flow we are talking about free content, making it more accessible for P10 who
does not have a Netflix subscription and to P6 who is not allowed to use the account of her
mother on weekdays.
As TV used to work as a background for other activities and played the role of a companion before sleeping and when waking up, we note that this practice has been reshaped recently by the use of portable screens, especially the smartphone, as it is now
often the first screen to see when waking up and the last one before sleeping. Similar to
zapping from channel to channel on TV, we open social media sites, scroll for interesting content and keep looking for something to watch quickly, for a short or a longer time,
it does not matter what. We understand that this flow could be considered a new way of
zapping through on demand content, in contrast to the TV flow.
Final considerations
This paper reported the results of a qualitative study of TV and video viewing practices performed with female young participants who live in a mid-sized student town in Belgium. We found that although the video watching practices are clearly more dispersed and occurring in different places using portable and connected screens, it was mainly a domestic and private habit for most participants.
it a pluri-dimensional practice through the association of different dimensions (content, providers, and screens used in different places and times).
By clustering the results by location, content, screen, provider and time of viewing,
the interaction flows provide insights into the watching practices of the participants, how they
combine different resources and what their motivations are for these practices. As presented,
flow 1 highlights situations in which the content is the most important factor, whereas on the flow 3 the provider is the central element. The flow 2 underlines the importance of social viewing and the flow 4 addresses the idea of passing time, all while taking into account which providers
give access to the content and what the social context of these practices is. By presenting the
results of our study using four interaction flows, we offered a structured way of looking at and
understanding the combination of both new and more traditional video watching practices.
While it is difficult to speculate how the results would be different when male
participants would have been involved, the participation of only female young people showed how video watching practices are motivated by a range of reasons that go beyond content preferences, which are often related to gender or age.
Although the results obtained in this study are linked to one particular gender, we do not
think that this was the determining factor of the identified practices. The possibilities of watching videos nowadays are so diverse that content preferences are one of the defining elements, but not
necessarily the principal one. Moreover, as we do not make any claims regarding generalizability, our results show how current viewing practices can be analysed and described using interaction
flows, whether by men or women, or even by people in other age groups.
This paper also shows the potential of using a card-based diary to investigate young people’s habits. The proposal of a portable, easy-to-handle and printed diary attracted the
curiosity of the participants and engaged them in filling it in. In addition to being a different
and intriguing material to carry with them, it did not distract the attention of the participants from the screens where they mostly watch videos, instead of when using an online tool, commonly adopted nowadays for data gathering. Because of that we believe that the card-based diary used in this study is a fruitful way for making the diary-keeping more interesting to the young participants. Moreover, its format, for being structured and attractive, has been adopted for mapping and analyzing data from two case studies in Brazil.
Finally, this study reveals that, more than a resource for collecting data about viewing
behaviour, the card-based diary associated with the interviews offer a flexible approach to
map and analyse the diverse practices of media consumption in contemporary society.
References
BARKHUUS, L. Television on the Internet: new practices, new viewers. CHI ‘09 Extended Abstracts on Human Factors in Computing Systems (CHI EA ‘09). ACM, Nova York, US, 2009, p.2479-2488. Available
at: https://doi.org/10.1145/1520340.1520351. Acesso em: 25 may 2018.
BARKHUUS, L.; BROWN, B. Unpacking the television: User practices around a changing technology. ACM Transactions on Computer-Human Interaction, v.16, n.3, Article 15, sep. 2009. Available at: http://dx.doi. org/10.1145/1592440.1592444. Acesso em: 25 may 2018.
BROWN, B.; BARKHUUS, L. The television will be revolutionized: effects of PVRs and filesharing on television
watching. Proceedings of the SIGCHI Conference on Human Factors in Computing Systems (CHI ‘06).
ACM, Nova York, US, 2006, p.663-666. Available at: http://dx.doi.org/10.1145/1124772.1124870. Acesso em:
25 may 2018.
COURTOIS, C.; VERDEGEM, P.; DE MAREZ, L. The Triple Articulation of Media Technologies in Audiovisual Media Consumption. Television & New Media, v.14, n.5, 2012, p.421-439. Available at: https:// dx.doi.org/10.1177/1527476412439106. Acesso em: 25 may 2018.
FECHINE, Y. Elogio à programação: repensando a televisão que não desapareceu. In: CARLÓN, M.,
FECHINE, Y. (Eds.). O fim da televisão. Brasil: Confraria do Vento, 2014, p.114-131.
HAGUETTE, T. M. F. Metodologias Qualitativas na Sociologia. Petrópolis: Vozes, 1987. MARTÍN-BARBERO, Jesús. A comunicação na educação. Contexto, 2014.
McNALLY, J.; HARRINGTON, B. How Millennials and Teens Consume Mobile Video. Proceedings of the ACM
International Conference on Interactive Experiences for TV and Online Video (TVX ‘17). ACM, Nova York,
US, 2017, p.31-39. Available at: http://dx.doi.org/10.1145/3077548.3077555. Acesso em: 25 may 2018.
OROZCO GÓMEZ, G. Hacia una cultura de participación televisiva de las audiencias. Ideas para su fortalecimiento. Comunicação, Mídia e Consumo, v.7, n.19, jul. 2010, p.13-31. Available at: http://dx.doi. org/10.18568/cmc.v7i19.192. Acesso em: 25 may 2018.
______. La condición comunicacional contemporânea. Desafios latino-americanos de la investigación de las
interaciones en la sociedade red. In: JACKS, N. (Ed.). Analisis de recepción em América Latina: um recuento histórico con perspectivas al futuro (1ª ed). CIESPAL, Ecuador, 2011, p.377-408.
______. Televisão: causa e efeito em si mesma. In: CARLÓN, M.; FECHINE, Y. (Eds.). O fim da televisão.
Brazil: Confraria do Vento, 2014, p.96-113.
OROZCO GÓMEZ, G.; GONZÁLEZ, R. Una coartada metodológica: abordajes cualitativos en la investigación en comunicación, medios y audiencias. Mexico, D.F.: Productora de Contenidos Culturales, 2011.
RECUERO, R. Introdução à análise de redes sociais. Salvador: EDUFBA, 2017.
RIGBY, J. M.; BRUMBY, D. P.; GOULD, S. J. J.; COX, A. L. Media Multitasking at Home: A Video
Observation Study of Concurrent TV and Mobile Device Usage. Proceedings of the ACM International Conference on Interactive Experiences for TV and Online Video (TVX ‘17). ACM, Nova York, US, 2017,
p.2-10. Available at: http://dx.doi.org/10.1145/3077548.3077560. Acesso em: 25 may 2018.
RUDSTRÖM, Å.; SJÖLINDER, M.; NYLANDER, S. How to choose and how to watch – An on-demand
perspective on current TV practices. SICS Technical Report T2010:03. Stockholm, Sweden: Swedish Institute of Computer Science, 2009.
SHOKRPOUR, A.; DARNELL, M. J. How People Multitask While Watching TV. Proceedings of the ACM International Conference on Interactive Experiences for TV and Online Video (TVX ‘17). ACM, Nova
York, US, 2017, p.11-19. Available at: http://dx.doi.org/10.1145/3077548.3077558. Acesso em: 25 may 2018.
VANATTENHOVEN, J.; GEERTS D. Broadcast, Video-on-Demand, and Other Ways to Watch Television Content: a Household Perspective. Proceedings of the ACM International Conference on Interactive Experiences for TV and Online Video (TVX ‘15). ACM, Nova York, US, 2015, p.73-82. Available at: https:// dx.doi.org/10.1145/2745197.2745208. Accessed on: 25 may 2018.
Fernanda Chocron Miranda
PhD student in Communication and Information, pursuing a joint doctorate at the Federal University of Rio Grande do Sul (UFRGS - Brazil) and KU Leuven (Belgium). She has a Master in Communication, Culture and Amazon from Federal University of Pará (UFPA) and a Bachelor Social Communication also from UFPA. Since 2009, she acts as researcher at the Laboratory for Research and Experiment on Multimedia of the Centre of Innovation and Applied Technologies for Teaching and Outreach (NITAE2) of UFPA. She was a visiting researcher at Meaningful Interactions Lab (Mintlab-KU Leuven) from December 2016 to May 2018, via a scholarship of the ‘Comparative matrix of qualitative research with digital technology users’ Project, an international cooperation initiative between UFPA, Mintlab and UFRGS, funded by the Brazilian development agency CAPES. Her research interests include: digital TV, multimedia, media consumption, communication of science, distance education, qualitative methodologies. E-mail: nandachocron@gmail.com.
David Geerts
PhD in Social Sciences at KU Leuven. He has a master in Communication Sciences at KU Leuven and a Master in Culture and Communication at KU Brussel. Since 2011, acts as Research Manager of the Meaningful Interactions Lab (Mintlab) of KU Leuven and imec at the Faculty of Social Sciences. He is specialized in human-centered design of social interactive television, and worked on and supervised several local and EU projects on this topic. He is member of the IFIP TC14 WG6 on Entertainment Computing, was general chair of the ACM international conference on interactive experience for television and online video (ACM TVX2015) and is currently chair of the TVX steering committee. He has published more than 100 publications in various international conferences and journals, and regularly gives presentations, tutorials and guest lectures on topics related to Human-Computer Interaction. E-mail: david.geerts@kuleuven.be.
Received on: 05.25.2018 Accepted on: 10.30.2018