Normal nutrient ranges and nutritional monitoring of 'Pêra' orange
trees based on the CND method in different fruiting stages
Jairo Rafael Machado Dias(1), Paulo Guilherme Salvador Wadt(2), Fábio Luiz Partelli(3),
Marcelo Curitiba Espindula(2), Daniel Vidal Perez(4), Fábio Régis Souza(1),
Anderson Cristian Bergamin(1) and Elaine Almeida Delarmelinda(1)
(1)Universidade Federal de Rondônia, Departamento de Agronomia, Avenida Norte-Sul, no 7.300, Nova Morada, CEP 76940-000 Rolim de Moura, RO, Brazil. E-mail: jairorafaelmdias@unir.br, fabio.souza@unir.br, anderson.bergamin@unir.br, elainealmeida@unir.br (2)Embrapa Rondônia, BR-364, Km 5,5, Zona Rural, CEP 76815-800 Porto Velho, RO, Brazil. E-mail: wadt@dris.com.br, marcelo.espindula@embrapa.br (3)Universidade Federal do Espírito Santo, Rodovia BR 101 Norte, Km 60, Litorâneo, CEP 29932-540 São Mateus, ES, Brazil. E-mail: partelli@yahoo.com.br (4)Embrapa Solos, Rua Jardim Botânico, no 1.024, Jardim Botânico, CEP 22460-000 Rio de Janeiro, RJ, Brazil. E-mail: daniel.perez@embrapa.br
Abstract – The objective of this work was to determine reference values for evaluating the nutritional status of 'Pêra' orange (Citrus sinensis) trees in different fruiting stages, using the compositional nutrient diagnosis
(CND) method. The study used 243 leaf samples from 81 plots, with samplings performed in plants bearing fruits with three and six months of age, and also in the main harvest (nine months). Plots with productivity higher than 30 Mg ha-1 were selected for the establishment of reference standards. Three normal ranges were evaluated for each nutrient in the reference population, comprehended by the confidence interval (CI) of the foliar content averages, by the mean±standard deviation (±SD), and by the mean±⅔SD. Regardless of the normal range of nutrients used, the leaf sampling periods interfered with the nutritional status of 'Pêra' orange tree. The normal ranges obtained from the criteria CI and ±⅔SD of the nutrient contents observed in the reference population frequently provided similar nutritional diagnoses. Zn, Ca, and Fe are the elements that most often limit the production of 'Pêra' orange in the state of Amazonas, Brazil.
Index terms: Citrus limonia, Citrus sinensis, DRIS, leaf sampling, nutritional balance index, reference population.
Faixas normais de nutrientes e monitoramento nutricional de laranjeiras
'Pêra' com uso do método CND em diferentes estádios de frutificação
Resumo – O objetivo deste trabalho foi determinar valores de referência para avaliação do estado nutricional de laranjeiras 'Pêra' (Citrus sinensis) em diferentes estádios de frutificação, com uso do método de diagnose
da composição nutricional (CND). Foram utilizadas 243 amostras foliares, provenientes de 81 glebas, com coletas em plantas com frutos de três e seis meses de idade e, também, na colheita principal (nove meses). Glebas com produtividade superior a 30 Mg ha-1 foram selecionadas para o estabelecimento dos padrões de referência. Foram avaliadas três faixas normais para cada nutriente, na população de referência, abrangidas entre o intervalo de confiança (IC) das médias dos teores foliares, a média±desvio-padrão (±DP) e a média±⅔DP. Independentemente da faixa normal de nutrientes utilizada, a época de amostragem foliar interferiu no estado nutricional da laranjeira 'Pêra'. As faixas normais obtidas a partir dos critérios IC e ±⅔DP dos teores nutricionais observados na população de referência proporcionaram diagnósticos nutricionais frequentemente semelhantes. Zn, Ca e Fe são os elementos que mais frequentemente limitam a produção da laranja 'Pêra' no Amazonas.
Termos para indexação: Citrus limonia, Citrus sinensis, DRIS, amostragem foliar, índice de balanço nutricional,
população de referência.
Introduction
The citrus sector of Brazil contributes substantially to the economy of the country and is the largest exporter of concentrated orange juice in the world (Perez & Santos, 2014). The state of São Paulo is the greatest orange producer in the country, with a harvested area
of 46,043 ha, while the state of Amazonas ranks 11th, with a harvested area of 2,651 ha (IBGE, 2014).
In Amazonas, orange production is concentrated in the municipality of Rio Preto da Eva, which accounts for more than 70% of the state production. The orange variety 'Pêra' [Citrus sinensis (L.) Osbeck] is the most
the regional soil-climatic conditions (IBGE, 2014). However, information on the nutritional status of fruit trees in the region is scarce, and nutritional standards established in other states are still commonly used (Fernandes et al., 2010). However, this procedure can affect the efficiency of nutritional assessment due to variations, mainly, in non-nutritional factors (Jarrel & Beverly, 1981).
The sufficiency range (SR) and critical level (CL) are the most widely used methods for interpretation of leaf analysis. These reference values are traditionally obtained in calibration tests in which the nutrient rates are varied and all the other production factors are maintained constant (Kurihara et al., 2005). However, the long time and high costs required to establish the standard values are the main drawbacks of these methods, besides the limitations arising from the requirement that the cultivation conditions of the plants to be diagnosed must be similar to those of the plants used to obtain the calibration curve (Fageria et al., 2009).
Alternatively, the use of SR derived from the diagnosis and recommendation integrated system (DRIS) applied directly to commercial plantations has been proposed in the literature, requiring no experimentation, with a significant reduction in cost and time demand necessary to establish the standards. This possibility has stimulated more and more research on fruit trees such as: banana tree (Teixeira et al., 2007), coconut tree (Santos et al., 2004), guava tree (Souza et al., 2013), mango tree (Politi et al., 2013), and mandarin (Srivastava & Singh, 2008). For orange trees, SRs have been proposed for the state of São Paulo (Camacho et al., 2012) and Central Amazon (Dias et al., 2013).
The application of orange tree fertilization in Brazil is best done at the beginning of fruiting (Mourão Filho, 2005; Santana et al., 2007; Fernandes et al., 2010). However, the crop leaf sampling period proposed in the literature prevents the nutritional diagnosis from being timely made for use in fertilization recommendation in the same year, since leaf sampling is only recommended when the fruits are six months old (Quaggio et al., 2005). This limitation has made nutritional diagnosis little widespread as a tool for the management of orange tree fertilization (Mourão Filho, 2005; Camacho et al., 2012; Dias et al., 2013).
The DRIS method varies according to the nutritional relationships used, which can be bi- or multivariate.
As an approach to a distinct diagnostic system, Parent & Dafir (1992) proposed DRIS based on multivariate relationships, called compositional nutrient diagnosis (CND). The CND corresponds to the natural logarithm of the relationship between the evaluated nutrient and the geometric mean of the nutritional composition in the leaf sample (Parent, 2011). Therefore, unlike the original DRIS method (Beaufils, 1973), CND does not consider the relationship between the contents of two discretionary nutrients.
The establishment of normal nutrient ranges for different fruiting stages of orange tree is essential so that the foliar analysis can be used as a decision tool in the management of the crop’s main fertilization.
The objective of this work was to determine reference values for evaluating the nutritional status of 'Pêra' orange trees in different fruiting stages, using the compositional nutrient diagnosis (CND) method.
Materials and Methods
The study was carried out in the municipality of Rio Preto da Eva (02°41'56"S, 59°42'00"W), in the state of Amazonas, Brazil, using 243 leaf samples of 'Pêra' orange tree [Citrus sinensis (L.) Osbeck]. The trees
were grafted on 'Cravo' lemon (Citrus limonia Osbeck)
tree and sampled in the 2011/2012 growing season, in three fruiting stages. The samples were collected from 27 representative commercial orchards of this orange-producing region.
Each orchard was divided into three plots, representing the different micro soil-climatic conditions within the orchard, in order to maintain visual uniformity within the areas, with four orange trees per plot, to ensure representativeness. Therefore, 81 plots were monitored. The evaluated orchards were between 5 and 15 years old, producing yields between 10.9 and 55.8 Mg ha-1. The orchards were planted at a spacing of 7x4 m, with a total of 357 plants per hectare, and at 8.5x5 m, with 236 plants per hectare. The evaluated orchards were cultivated in a dry system, and the main harvest occurred in June, while untimely fruits were harvested in September and October.
rainfalls concentrated in the first quarter of the year, and the warmest period lasts from August to October. Latossolos Amarelos distróficos (Xanthic Oxisols) are predominant in the region (IBGE, 2010).
Sampling periods for nutritional diagnosis were selected to identify the ideal fruiting stage to evaluate possible nutritional imbalances. In the first period, leaf sampling was carried out when the plants showed three-month-old fruits (marble-sized fruit, corresponding to stage 6), in December 2011. In the second period, sampling was performed in March 2012, when the fruits were six months old (final size fruit, green, stage 8), according to Quaggio et al. (2005). In the third sampling period, the leaves were taken at the time of the main harvest (green to yellow fruit, stage 9), in June 2012. Each sample was composed of 100 freshly ripened leaves taken from four trees (25 leaves per plant), selected at random within the field. The leaves were removed from the third node from the apex of fruiting branches.
The collection was rigorously standardized, since the leaf patterns differ according to the type of the leaf samples (Kurihara et al., 2013). The samplings were performed on the sides of the trees facing the four cardinal points, and always at medium plant height, as recommended by Quaggio et al. (2005). The collected plant material was packed in paper bags and transported to the laboratory. For the analyses, the samples were washed in running water, dried in a forced air circulation oven at 60°C, ground in a Willey mill, and the total nutrient contents were determined.
To analyze the P, K, Ca, Mg, B, Cu, Fe, Mn, and Zn contents, the samples were solubilized in
nitric-perchloric solution (65% nitric acid and 70% perchloric acid), while nitrogen was subjected to sulfuric solubilization and determined by the semi-micro Kjeldahl method (Carmo et al., 2000).
In 51 of the 81 plots monitored, the fruit yields exceeded 30 Mg ha-1 in the main harvest (June 2012). These 51 plots were considered as the reference population to determine the nutritional standards. The other 30 plots had low yields and were used to perform the nutritional diagnoses. The yield of 30 Mg ha-1 was used as a cutoff criterion for being more than 50% higher than the mean yield of orange trees in the state of Amazonas, in 2012 (IBGE, 2014).
In the plots of the reference population, the following mean values were found in the soil chemical analyses (0.0–0.20 m layer): pH in CaCl2 5.7; P (Mehlich-1) 5.6 mg dm-3; Ca, Mg, K, and potential acidity of 2.3, 1.2, 0.2, and 2.9 cmolc dm-3, respectively; oxidizable organic carbon of 3.0 dag kg-1; and clay content of 59.3 dag kg-1. In the low-yield plots (≤30 Mg ha-1), the results of the soil analysis were: pH in CaCl2 of 5.4; P of 1.2 mg dm-3; Ca, Mg, K, and potential acidity of 1.7, 1.1, 0.2, and 4.5 cmolc dm-3, respectively; oxidizable organic carbon of 3.2 dag kg-1; and clay content of 492 g kg-1. The analyses were performed as proposed by Donagema et al. (2011).
Once the reference population was defined, the CND method (Parent, 2011) was used to identify the leaf nutrient concentrations in the samples that were sufficiently high, for each fruiting stage. To this end, the leaf concentration of nutrients in all plots, regardless of the sampling time, was adjusted to a same measure unit (dag kg-1).
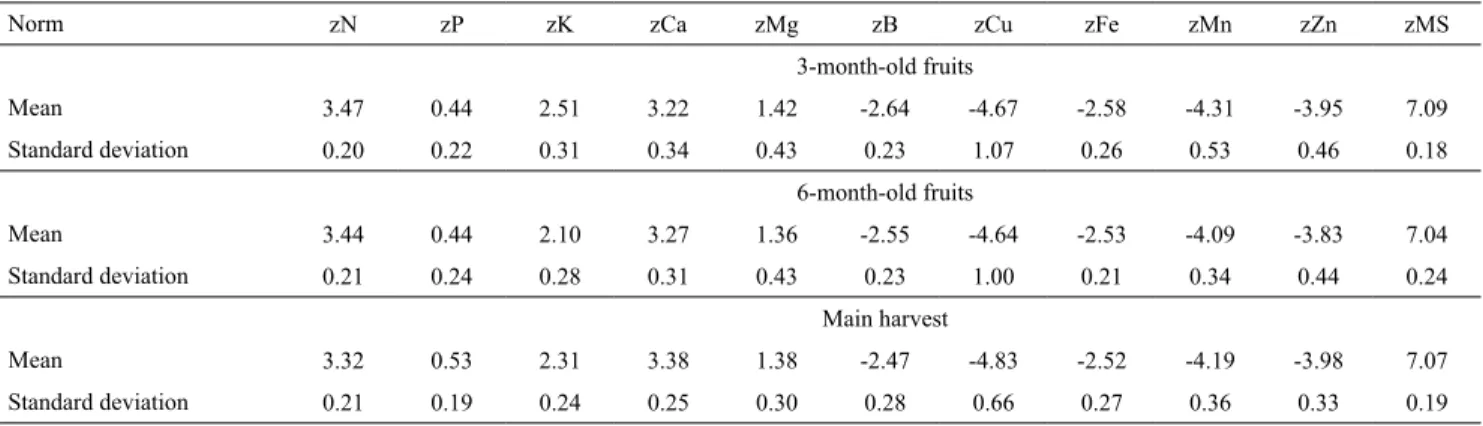
Table 1. Mean and standard deviation from the nutritional standards used for the compositional nutrient diagnosis of 'Pêra' orange (Citrus sinensis) trees in different fruiting stages.
Norm zN zP zK zCa zMg zB zCu zFe zMn zZn zMS
3-month-old fruits
Mean 3.47 0.44 2.51 3.22 1.42 -2.64 -4.67 -2.58 -4.31 -3.95 7.09
Standard deviation 0.20 0.22 0.31 0.34 0.43 0.23 1.07 0.26 0.53 0.46 0.18
6-month-old fruits
Mean 3.44 0.44 2.10 3.27 1.36 -2.55 -4.64 -2.53 -4.09 -3.83 7.04
Standard deviation 0.21 0.24 0.28 0.31 0.43 0.23 1.00 0.21 0.34 0.44 0.24
Main harvest
Mean 3.32 0.53 2.31 3.38 1.38 -2.47 -4.83 -2.52 -4.19 -3.98 7.07
The supplementary nutrient value for the total leaf biomass (R value) was calculated according to the expression: R = 100 - (vN + vP + vK + vCa + vMg + vB + vCu + vFe + vMn + vZn), in which R is the complementary value for 100 dag kg-1 dry matter, in relation to the sum of nutrient contents vi (i = N, ..., Zn), in dag kg-1. From the geometric mean (mGeo) calculated for the values of each sample, the multinutrient variable (zX) was computed by the expression: zX = ln (vX/mGeo), where zX represents the value of the multivariate relation of each one of the evaluated nutrients (vX). With the zX values of each reference plot, the descriptive parameters – arithmetic mean (mX) and standard deviation (sX) – and the CND standards were calculated for each fruiting stage (Table 1).
From the standards, the CND indices were calculated by the log-centered multivariate correlation (Parent, 2011), for each of the evaluated nutrients: I_X=(zX-mX)/sX; in which I_X represents the CND index; mX is the mean norm; and sX is the standard deviation norm.
For the interpretation of the CND indices, the DRIS dry matter method (M-DRIS) was used (Hallmark et al., 1987), and each nutrient was classified into two categories – deficiency and sufficiency – based on the comparison of the value of the CND index of each nutrient (In) with the CND dry matter index (DMI), where deficiency occurs when In < 0 and In < DMI; and sufficiency when In > 0 or In > DMI.
The normal range for each nutrient, irrespective of the fruiting stage, was estimated from the mean nutritional contents in the monitored plots with nutritional sufficiency, for each element analyzed, according to the thresholds: limits of the confidence interval (CI); of the standard deviation (±SD); and of ±⅔SD. The CI was computed as: CI = mX ± tα·smX; where: mX and smX represent the mean content and standard deviation for the nutrients evaluated in the nutritionally balanced plots, and tα is the value of bilateral t, at 1% probability, with n-1 degrees of freedom, where n refers to the total number of data.
The SD was obtained by the expression: SD = [∑(yX - mX)2]0.5/n; where: y and m represent the content of each sample and mean value, respectively; and n, the total number of samples.
The amplitude of the CI, SD and ⅔SD, expressed in grams per kilogram (g kg-1) for macronutrients, and in
milligrams per kilogram (mg kg-1) for micronutrients, were considered as the normal range. Values below and above the lower and upper limits of CI, SD and ⅔SD were considered as deficient and excessive nutritional contents (luxury consumption or toxicity), respectively.
In the low-yield plots, the nutritional diagnoses, carried out in the three fruiting stages, were compared with each other, and the concordance cases were computed for each leaf and nutrient sample. Therefore, concordant diagnoses were the cases in which the normal ranges – obtained with the different criteria at each fruiting stage – provided the same nutritional diagnosis of the samples (deficiency, balance and excess). The obtained results were expressed in percentage of agreement.
The norms, the CND indices, the M-DRIS, and the chi-square test (p≤0.01) were calculated in a spreadsheet. The descriptive statistics and Tukey’s test, at 5% probability, were processed with the statistical software Assistat, version 6.2 (Silva & Azevedo, 2002).
Results and Discussion
Of the 81 commercial 'Pêra' orange plots monitored in the different fruiting stages, nutritional sufficiency was confirmed in the plots 45, 41, 50, 38, 49, 38, 38, 43, 40, and 32 for N, P, K, Ca, Mg, B, Cu, Fe, Mn and Zn, respectively, in evaluations when the trees had three-month-old fruits. Similar results were found for the plots 60, 44, 59, 35, 50, 34, 33, 38, 31, and 27, when the fruits were six months old, and for the plots 51, 45, 53, 36, 58, 42, 37, 41, 33, and 28 in the main harvest. Regardless of the fruiting stage evaluated, the N, P, K, and Mg contents were found to have an adequate nutritional sufficiency in most of the monitored plots. However, in more than 60% of the plots, Zn was the most yield-limiting element (Table 2).
The distributions of the frequencies at which the plots were classified as nutrient-deficient and sufficient were similar for all nutrients, regardless of the fruiting stage (Table 2). This similarity in distribution can be explained by the low variations in the nutritional status between plots during fruiting.
Thus, the nutritional content in leaf tissues of the plots with sufficiency for each of the nutrients was used to establish the optimum concentration in the different fruiting stages of 'Pêra' orange tree.
In the 81 plots, the mean levels of P, Mg, B, Fe, and Zn were considered adequate; those of K, Ca and Mn were low; and those of N and Cu were excessive for orange trees with 6-month-old fruits (Quaggio et al., 2005) (Table 3). However, in contrast to the normal nutrient range proposed by Camacho et al. (2012), with the use of CND in 'Pêra' orange trees cultivated in municipality of Bebedouro, state of São Paulo, Brazil, the mean K and Fe levels were considered adequate; those of Ca, Mg and Mn were low; and those of N, P, B, Cu, and Zn were excessive, also for plants with 6-month-old fruits.
For the elements evaluated in the stage of fruit establishment (after three months), the leaf concentrations of N, K and Cu were higher than those after six months, while those of Mg and Zn remained stable, and those of P, Ca, B, Fe, and Mn were lower. In 'Hamlin' orange trees, Mattos Junior et al. (2003) also observed a decrease in the N and K leaf concentrations as the fruiting satages advanced. These results can be explained by the fact that N and K are, in this order, the elements removed at highest levels in orange fruits (Boaretto et al., 2007). Thus, since the reproductive organs are preferential drains, these elements tend to Table 2. Frequency at which a state of nutritional sufficiency
and insufficiency was diagnosed in the 81 commercial 'Pêra' orange (Citrus sinensis) orchards, in the fruiting stages,
evaluated by the method of compositional nutrient diagnosis(1).
Class
3-month-old fruits
6-month-old fruits
Main harvest
Expected fre-quency (%)
Nitrogen
Sufficient 56 74 63 64
Insufficient 44 26 37 36
Chi-square 3.25 4.24 0.07
-Phosphorus
Sufficient 51 54 56 53
Insufficient 49 46 44 47
Chi-square 0.33 0.03 0.17
-Potassium
Sufficient 62 73 65 67
Insufficient 38 27 35 33
Chi-square 1.10 1.71 0.07
-Calcium
Sufficient 47 43 44 45
Insufficient 53 57 56 55
Chi-square 0.17 0.11 0.01
-Magnesium
Sufficient 60 62 72 65
Insufficient 40 38 28 35
Chi-square 0.74 0.36 2.14
-Boron
Sufficient 47 42 52 47
Insufficient 53 58 48 53
Chi-square 0.00 0.98 0.98
-Copper
Sufficient 47 41 46 44
Insufficient 53 59 54 56
Chi-square 0.25 0.56 0.06
-Iron
Sufficient 53 47 51 50
Insufficient 47 53 49 50
Chi-square 0.33 0.43 0.01
-Manganese
Sufficient 49 38 41 43
Insufficient 51 62 59 57
Chi-square 1.77 0.84 0.17
-Zinc
Sufficient 39 33 35 36
Insufficient 61 67 65 64
Chi-square 0.60 0.27 0.07
-(1)None of the chi-square values was considered significant at 5%
probability.
Table 3. Leaf contents in 'Pêra' orange (Citrus sinensis) trees
in orchards with nutrient sufficiency (reference population), in samples taken at different fruiting stages(1).
Nutrients Sampling time Coefficient
of variation (%)
3-month-old fruits
6-month-old fruits
Main harvest
N (g kg-1) 31.27a 28.46b 27.66b 10.3
P (g kg-1) 1.35b 1.38b 1.47a 7.7
K (g kg-1) 12.53a 8.48c 10.13b 18.5
Ca (g kg-1) 20.77c 23.23b 24.71a 10.3
Mg (g kg-1) 3.73a 4.03a 3.73a 16.8
B (mg kg-1) 64.02b 78.63a 84.85a 16.5
Cu (mg kg-1) 33.74a 43.58a 19.50b 64.8
Fe (mg kg-1) 70.85b 77.19ab 80.98a 18.9
Mn (mg kg-1) 19.45b 26.31a 26.34a 43.2
Zn (mg kg-1) 29.46b 46.51a 37.70ab 52.5
(1)Means followed by equal letters, in the columns, do not differ by Tukey’s
be transferred from the leaf to the fruits. In the case of Ca, due to its restricted mobility in the phloem, accumulation of the nutrient occurs in the leaf tissue throughout plant development.
Since the value of the standard deviation (SD) defines the amplitude of the normal nutrient range, it is expected that the greater the dispersion of nutritional contents in the set of plants of the reference population, the lower the sensitivity of the method to detect nutritional imbalances (Table 4). The amplitude of the CI corresponds to an estimated range, in which the probability that the leaf concentrations of the reference population are included in this range is 99% (p≤0.01) (Coutinho & Cunha, 2005). Therefore, the normal nutrient range estimated from the CI usually provides a small amplitude, and is very rigorous in the nutritional diagnosis, as already pointed out for coffee trees (Farnezi et al., 2010) and orange trees (Dias et al., 2013).
In contrast, optimum nutrient contents corresponding to ±SD and ±⅔SD of the nutritional indices of the nutritionally balanced population, using DRIS and CND, have already been estimated for mango trees (Politi et al., 2013), cotton plants (Serra et al., 2010; Kurihara et al., 2013), coffee trees (Partelli et al., 2007), and guava plants (Souza et al., 2013), with higher amplitudes than those estimated by CI, but lower amplitudes than the sufficiency ranges (SR) proposed in traditional calibration tests (Quaggio et al., 2005).
In the nutritional diagnosis, the use of small-amplitude SR increases the capacity of the method to identify plants in situations of nutritional imbalance, compared to the use of large-amplitude SR (Partelli et al., 2007). On the other hand, possible minor nutritional variations in the leaf tissue, due to non-nutritional factors, may be interpreted inappropriately (e.g., as nutritional deficiency or excess) when very narrow ranges are used (Jarrel & Beverly, 1981).
Regardless of the criteria used to establish the normal nutrient ranges in this study, the ranges obtained for N, P, B, Cu, and Zn exceeded the threshold established by Camacho et al. (2012) for 6-month-old fruits in São Paulo orange orchards; while those of Ca and Mn were below the threshold, and that of Fe was contained in the range proposed by the authors. However, the critical level established in 'Pêra' orange orchards in the same region of Central Amazônia, with low technological
Table 4. Normal nutrient ranges in 'Pêra' orange (Citrus sinensis) leaves, in three fruiting stages, calculated by the
compositional nutrient diagnosis method based on different criteria.
Criterion(1) 3-month-old
fruits
6-month-old fruits
Main harvest
Nitrogen (g kg-1)
Standard deviation 28–35 26–31 25–30
⅔ of the standard deviation 29–34 27–30 26–29
Confidence interval 30–33 28–29 27–29 Phosphorus (g kg-1)
Standard deviation 1.2–1.5 1.3–1.5 1.4–1.5
⅔ of the standard deviation 1.3–1.4 1.3–1.4 1.4–1.5
Confidence interval 1.3–1.4 1.3–1.4 1.4–1.5 Potassium (g kg-1)
Standard deviation 10–15 7–10 9–12
⅔ of the standard deviation 11–14 8–9 9–11
Confidence interval 12–13 8–9 10–11 Calcium (g kg-1)
Standard deviation 18–24 22–25 23–26
⅔ of the standard deviation 19–23 22–24 24–25
Confidence interval 19–22 22–24 24–25 Magnesium (g kg-1)
Standard deviation 2.8–4.7 1.1–7.0 3.1–4.4
⅔ of the standard deviation 3.1–4.4 2.1–6.0 3.3–4.2
Confidence interval 3.4–4.1 3.0–5.0 3.5–3.9 Boron (mg kg-1)
Standard deviation 57–71 67–92 68–97
⅔ of the standard deviation 59–69 71–88 73–93
Confidence interval 61–67 74–85 77–89 Copper (mg kg-1)
Standard deviation 15–53 16–71 7–32
⅔ of the standard deviation 21–47 25–62 11–28
Confidence interval 26–42 31–56 14–25 Iron (mg kg-1)
Standard deviation 56–86 68–86 64–98
⅔of the standard deviation 61–81 71–83 70–92
Confidence interval 65–77 73–81 74–88 Manganese (mg kg-1)
Standard deviation 10–29 19–33 13–39
⅔ of the standard deviation 13–26 22–31 18–35
Confidence interval 15–23 23–30 20–32 Zinc (mg kg-1)
Standard deviation 14–45 27–66 14–62
⅔ of the standard deviation 19–40 34–59 22–54
Confidence interval 23–36 37–56 26–49
(1)Criteria underlying the normal range: CI, confidence interval of nutritional
contents in leaves of plants of the reference population; SD, range between ± the standard deviation of the nutritional contents in the reference population;
and ±⅔SD, range between ±⅔ of the standard deviation of the nutritional
level and fruits of the same age (Dias et al., 2013), was higher than the normal ranges established here for P, Ca, and Fe; below those for K, B, Cu, and Zn; and within the ranges for N, Mg and Mn, in most cases.
The distribution frequencies of the nutritional classes of deficiency, balance and excess, observed in low-yield plots, were close to the expected frequencies for most of the nutrients, and random in the case of N using the normal range based on the criteria CI and ±SD, and in the case of K using the ±SD criterion (Table 5).
All normal ranges indicated Zn, Ca and Fe as the elements that most frequently limit yields of 'Pêra' orange in the Amazonas region, and in more than 65% of the monitored plots, at least one of these nutrients was deficient. Nonetheless, Mg most often fitted within the established normal nutrient ranges, in more than 92% of the diagnosed plots (Table 5).
The degree of agreement in the diagnoses based on normal ranges and the criteria CI and ±⅔SD in the different fruiting stages was higher than 79% for most nutrients and reached 100% for P and Ca (Table 6). However, the degree of agreement at different sampling times, regardless of the criterion adopted to establish the normal range, was less than 65% for most nutrients.
The variation in leaf nutrient contents according to the fruiting stage may be associated with several factors
Table 5. Frequency at which nutritional deficiency, balance
and nutritional excess were detected in 30 plots with low yields, according to the Compositional nutrient diagnosis method using different criteria to establish the normal range, in 'Pêra' orange (Citrus sinensis) trees evaluated in three-month-old
fruits.
Criterion(1) Deficiency Equilibrum Excess Chi-square
Nitrogen
Standard deviation 4 24 2 **
⅔ of the SD 7 17 6 ns
Confidence interval 10 4 16 **
Expected frequency 7.0 15.0 8.0
-Phosphorus
Standard deviation 12 16 2 ns
⅔ of the SD 12 8 10 ns
Confidence interval 12 8 10 ns
Expected frequency 12.0 10.7 7.3
-Continuation...
Continuation...
Potassium
Standard deviation 4 21 5 **
⅔ of the SD 10 8 12 ns
Confidence interval 10 8 12 ns
Expected frequency 8.0 12.3 9.7
-Calcium
Standard deviation 22 7 1 ns
⅔ of the SD 23 4 3 ns
Confidence interval 23 4 3 ns
Expected frequency 22.7 5.0 2.3
-Magnesium
Standard deviation 1 28 1 ns
⅔ of the SD 1 28 1 ns
Confidence interval 8 21 1 ns
Expected frequency 3.3 25.3 1.0
-Boron
Standard deviation 20 4 6 ns
⅔ of the SD 21 1 8 ns
Confidence interval 21 1 8 ns
Expected frequency 20.7 2.0 7.3
-Copper
Standard deviation 18 9 3 ns
⅔ of the SD 22 5 3 ns
Confidence interval 24 3 3 ns
Expected frequency 21.3 5.7 3.0
-Iron
Standard deviation 20 9 1 ns
⅔ of the SD 22 7 1 ns
Confidence interval 23 6 1 ns
Expected frequency 21.7 7.3 1.0
-Manganese
Standard deviation 21 7 2 ns
⅔ of the SD 21 5 4 ns
Confidence interval 22 3 5 ns
Expected frequency 21.3 5.0 3.7
-Zinc
Standard deviation 21 7 2 ns
⅔ of the SD 24 1 5 ns
Confidence interval 24 1 5 ns
Expected frequency 23.0 3.0 4.0
-(1)Criteria underlying the normal range: CI, confidence interval of nutritional
contents in leaves of plants of the reference population; SD, range between ± the standard deviation of the nutritional contents in the reference population;
and ±⅔SD, range between ±⅔ of the standard deviation of the nutritional
contents in the reference population. nsNonsignificant. **Significant by the
related to plant physiology, e.g., nutritional demands resulting from fruiting and the development of vegetative and reproductive branches. In addition, this variation may also be related to meteorological variables, which interfere with plant development (Fageria et al., 2009).
Conclusions
1. The nutritional status of 'Pêra' orange (Citrus
sinensis) trees cultivated in Amazonas varies according
to the season of leaf sampling, regardless of the normal nutrient range underlying the diagnosis.
2. Normal nutrient ranges obtained from the criteria of the confidence interval and ±⅔ of the standard
deviation of the nutritional levels observed in the reference population often provided similar nutritional diagnoses.
3. The Zn, Ca, and Fe are the elements that most often limit the yield in the production of 'Pêra' orange in the state of Amazonas, Brazil.
References
BEAUFILS, E.R. Diagnosis and recommendation integrated
system (DRIS): a general scheme for experimentation and
calibration based on principles develop from research in plant nutrition. Pietermaritzburg: University of Natal, 1973. 132p. Table 6. Degree of agreement (%) between diagnoses based on normal ranges obtained from different criteria, of 'Pêra' orange (Citrus sinensis) trees sampled at different fruiting stages.
Diagnosis(1) N P K Ca Mg B Cu Fe Mn Zn
---(%)---Three-month-old fruits (Frt3)
SD vs. ⅔SD 83 77 73 83 77 90 50 83 87 93
SD vs. CI 63 77 47 83 47 77 57 63 77 90
⅔SD vs. CI 80 100 73 100 70 87 80 80 90 97
Six-month-old fruits (Frt6)
SD vs. ⅔SD 77 73 57 90 100 90 87 93 93 80
SD vs. CI 33 73 57 90 70 90 80 90 87 80
⅔ SD vs. CI 57 100 100 100 70 100 93 97 93 100
Main harvest (MH)
SD vs. ⅔SD 87 100 83 93 73 87 67 67 97 93
SD vs. CI 80 100 60 93 57 63 57 53 97 93
⅔ SD vs. CI 93 100 77 100 83 77 90 87 100 100
Standard deviation (SD)
Frt3 vs. Frt6 37 43 60 67 80 47 60 33 77 77
Frt3 vs. MH 57 47 53 73 63 60 60 57 83 90
Frt6 vs. MH 57 57 63 80 57 60 57 27 83 87
⅔ of the standard deviation (⅔SD)
Frt3 vs. Frt6 37 43 40 67 57 50 50 40 80 73
Frt3 vs. MH 47 60 37 77 47 53 53 63 90 90
Frt6 vs. MH 43 57 47 77 30 63 73 40 87 77
Confidence interval (CI)
Frt3 vs. Frt6 27 43 47 67 53 53 57 57 73 77
Frt3 vs. MH 50 60 30 77 60 67 57 60 80 93
Frt6 vs. MH 20 57 43 77 43 80 80 53 90 77
(1)Criteria underlying the normal range: CI, confidence interval of the nutritional contents in leaves of plants of the reference population; SD, range between ±
standard deviation of nutritional contents in the reference population; and ±⅔SD, range between ±⅔ of the standard deviation of the nutritional contents in the
BOARETTO, R.M.; MATTOS JUNIOR, D.; TRIVELIN, P.C.O.; MURAOKA, T.; BOARETTO, A.E. Acúmulo de nutrientes
e destino do nitrogênio (15N) aplicado em pomar jovem de
laranjeira. Revista Brasileira de Fruticultura, v.29, p.600-605, 2007. DOI: 10.1590/S0100-29452007000300035.
CAMACHO, M.A.; SILVEIRA, M.V. da; CAMARGO, R.A.; NATALE, W. Faixas normais de nutrientes pelos métodos ChM, DRIS e CND e nível crítico pelo método de distribuição
normal reduzida para laranjeira-pera. Revista Brasileira de
Ciência do Solo, v.36, p.193-200, 2012. DOI:
10.1590/S0100-06832012000100020.
CARMO, C.A.F. de S. do; ARAÚJO, W.S. de; BERNARDI, A.C.
de C.; SALDANHA, M.F.C. Métodos de análise de tecidos
vegetais utilizados pela Embrapa Solos. Rio de Janeiro:
Embrapa Solos, 2000. 41p.
COUTINHO, E.S.F.; CUNHA, G.M. da. Conceitos básicos de epidemiologia e estatística para leitura de ensaios clínicos controlados. Revista Brasileira de Psiquiatria,v.27, p.145-151, 2005. DOI: 10.1590/S1516-44462005000200015.
DIAS, J.R.M.; TUCCI, C.A.F.; WADT, P.G.S.; SILVA, A.M. da; SANTOS, J.Z.L. Níveis críticos e faixas de suficiência nutricional em laranjeira-pêra na Amazônia Central obtidas pelo método
DRIS. Acta Amazonica, v.43, p.239-249, 2013. DOI: 10.1590/
S0044-59672013000300001.
DONAGEMA, G.K.; CAMPOS, D.V.B. de; CALDERANO, S.B.;
TEIXEIRA, W.G.; VIANA, J.H.M. (Org.). Manual de métodos
de análise de solo. 2.ed. rev. Rio de Janeiro: Embrapa Solos, 2011.
230p. (Embrapa Solos. Documentos, 132).
FAGERIA, N.K.; BARBOSA FILHO, M.P.; MOREIRA, A.; GUIMARÃES, C.M. Foliar fertilization of crop plants.
Journal of Plant Nutrition, v.32, p.1044-1064, 2009. DOI:
10.1080/01904160902872826.
FARNEZI, M.M. de M.; SILVA, E. de B.; GUIMARÃOES, P.T.G. Diagnose nutricional de cafeeiros da região do alto Jequitinhonha
(MG): normas DRIS e faixas críticas de nutrientes. Revista
Brasileira de Ciência do Solo, v.33, p.969-978, 2009. DOI:
10.1590/S0100-06832009000400021.
FERNANDES, A.R.; REIS, I.N.R.S.; NORONHA, N.C. Estado
nutricional de pomares de laranjeira submetidos a diferentes manejos do solo. Revista de Ciências Agrárias, v.53, p.52-58, 2010. DOI: 10.4322/rca.2011.007.
HALLMARK, W.B.; WALWORTH, J.L.; SUMNER, M.E.; DE
MOOY, C.J.; PESEK, J.; SHAO, K.P. Separating limiting from non-limiting nutrients. Journal of Plant Nutrition, v.10, p.1381-1390, 1987.
IBGE. Instituto Brasileiro de Geografia e Estatística. Mapas:
Amazonas. 2010. Available at: <ftp://geoftp.ibge.gov.br/
i nfor macoes _ ambient ais/pedologia /mapas/u n id ades _d a _
federacao/am_pedologia.pdf>. Accessed on: July 1 2016.
IBGE. Instituto Brasileiro de Geografia e Estatística. Produção
agrícola estadual:lavoura permanente 2012. Available at: <http://
www.ibge.gov.br/estadosat>. Accessed on: Jan. 10 2014.
JARREL, W.M.; BEVERLY, R.B. The dilution effect in plant
nutrition studies. Advances in Agronomy, v.34, p.197-224, 1981. DOI: 10.1016/S0065-2113(08)60887-1.
KURIHARA, C.H.; MAEDA, S.; ALVAREZ V., V.H.
Interpretação de resultados de análise foliar. Dourados:
Embrapa Agropecuária Oeste; Colombo: Embrapa Floresta, 2005. 42 p. (Embrapa Agropecuária Oeste. Documentos, 74).
KURIHARA, C.H.; VENEGAS, V.H.A.; NEVES, J.C.L.; NOVAIS, R.F. de; STAUT, L.A. Faixas de suficiência para teores foliares de nutrientes em algodão e em soja, definidas em função
de índices DRIS. Revista Ceres, v.60, p.412-419, 2013. DOI:
10.1590/S0034-737X2013000300015.
MATTOS JUNIOR, D.; QUAGGIO, J.A.; CANTARELLA, H.;
ALVA, A.K. Nutrient content of biomass components of Hamlin sweet orange trees. Scientia Agricola, v.60, p.155-160, 2003. DOI: 10.1590/S0103-90162003000100023.
MOURÃO FILHO, F. de A.A. DRIS and sufficient range
approaches in nutritional diagnosis of “Valencia” sweet orange on three rootstocks. Journal of Plant Nutrition, v.28, p.691-705, 2005. DOI: 10.1081/PLN-200052645.
PARENT, L.-É. Diagnosis of the nutrient compositional space of
fruit crops. Revista Brasileira de Fruticultura, v.33, p.321-334, 2011. DOI: 10.1590/S0100-29452011000100041.
PARENT, L.E.; DAFIR, M. A theoretical concept of
compositional nutrient diagnosis. Journal of American Society
of Horticultural Science, v.117, p.239-242, 1992.
PARTELLI, F.L.; VIERA, H.D.; CARVALHO, V.B. de; MOURÃO FILHO, F. de A.A. Diagnosis and recommendation integrated system norms, sufficiency range, and nutritional
evaluation of Arabian coffee in two sampling periods.
Journal of Plant Nutrition, v.30, p.1651-1667, 2007. DOI:
10.1080/01904160701615525.
PEREZ, O.C.; SANTOS, V.H.A. dos. Exportação de suco de
laranja brasileiro. Revista de Administração da FATEA, v.9, p.101-109, 2014.
POLITI, L.S.; FLORES, R.A.; SILVA, J.A.S. da; WADT, P.G.S.;
PINTO, P.A. da C.; PRADO, R. de M. Estado nutricional de
mangueiras determinado pelos métodos DRIS e CND. Revista
Brasileira de Engenharia Agrícola e Ambiental, v.17, p.11-18,
2013. DOI: 10.1590/S1415-43662013000100002.
QUAGGIO, J.A.; MATTOS JUNIOR, D.; CANTARELLA,
H. Manejo da fertilidade do solo na citricultura. In: MATTOS
JUNIOR, D. de; DE NEGRI, J.D.; PIO, R.M.; POMPEU JUNIOR,
J. (Ed.). Citrus.Campinas: Instituto Agronômico de Campinas, 2005. p.483-507.
SANTANA, J. das G.; LEANDRO, W.M.; NAVES, R.V.; CUNHA, P.P. da; ROCHA, A.C. Estado nutricional da laranja Pêra na região
central do estado de Goiás avaliada pelas análises foliar e do solo.
Bioscience Journal,v.23, p.40-49, 2007.
SANTOS, A.L. dos; MONNERAT, P.H.; CARVALHO, A.J.C. de. Estabelecimento de normas DRIS para o diagnóstico do
coqueiro-anão verde na região Norte Fluminense. Revista Brasileira
de Fruticultura, v.26, p.330-334, 2004. DOI:
SERRA, A.P.; MARCHETTI, M.E.; VITORINO, A.C.T.; NOVELINO, J.O.; CAMACHO, M.A. Determinação de faixas normais de nutrientes no algodoeiro pelos métodos ChM, CND
e DRIS. Revista Brasileira de Ciência do Solo, v.34, p.97-104,
2010. DOI: 10.1590/S0100-06832010000100010.
SILVA, F. de A.S. e; AZEVEDO, C.A.V. de. Versão do programa
computacional Assistat para o sistema operacional Windows.
Revista Brasileira de Produtos Agroindustriais, v.4, p.71-78,
2002. DOI: 10.15871/1517-8595/rbpa.v4n1p71-78.
SOUZA, H.A. de; ROZANE, D.E.; AMORIM, D.A. de; NATALE, W. Normas preliminares DRIS e faixas de suficiência
para goiabeira 'Paluma'. Revista Brasileira de Fruticultura, v.35, p.282-291, 2013. DOI: 10.1590/S0100-29452013000100033.
SRIVASTAVA, A.K.; SINGH, S. DRIS norms and their field
validation in Nagpur mandarin. Journal of Plant Nutrition, v.31, p.1091-1107, 2008. DOI: 10.1080/01904160802115359.
TEIXEIRA, L.A.J.; ZAMBROSI, F.C.B.; BETTIOL NETO, J.E. Avaliação do estado nutricional de bananeiras do subgrupo Cavendish no estado de São Paulo: normas DRIS e níveis
críticos de nutrientes. Revista Brasileira de Fruticultura, v.29, p.613-620, 2007. DOI: 10.1590/S0100-29452007000300037.