Cátia Marisa Pereira Marques
Licenciatura em Biologia
Concentration of Beverages by Osmotic
Evaporation: Effect on Organoleptic
Properties and Antioxidant Activity
Dissertação para obtenção do Grau de Mestre em
Biotecnologia
Orientador: Isabel Maria Rôla Coelhoso, Prof. Auxiliar,
FCT/UNL
Co-orientador: Vítor Manuel Delgado Alves, Prof.
Auxiliar, ISA/ULisboa
Júri:
Presidente: Prof. Doutora Ana Cecília Afonso Roque
Arguente: Prof. Doutora Carla Maria Carvalho Gil Brazinha de Barros Ferreira Vogal: Prof. Doutora Isabel maria Rôla Coelhoso
V
Concentration of Beverages by Osmotic Evaporation: Effect on Organoleptic
Proprieties and Antioxidant Activity
Copyright © 2014 – Cátia Marisa Pereira Marques, Faculdade de Ciências e Tecnologia,
Universidade Nova de Lisboa
VI
VII
IX
That which is impenetrable to us really exists. Behind the secrets of nature remains something subtle, intangible, and inexplicable. Veneration for this force beyond anything that we can comprehend is my religion.
XI
Agradecimentos
Este trabalho é o resultado de escolhas conscientes e espirito de descoberta e foi sem dúvida um ano de desafios, novas aprendizagens e de desenvolvimento pessoal. Atingida esta etapa não poderia deixar de agradecer às pessoas que o tornaram possível. Assim deixo o meu profundo agradecimento:
À minha Orientadora, Professora Doutora Isabel Coelhoso por me ter dado a oportunidade de realizar este trabalho. Pela disponibilidade demonstrada e confiança nas minhas capacidades, pelo empenho que demonstrou no trabalho em curso ao longo deste ano, motivando-me sempre a alargar os meus conhecimentos na área em estudo.
Ao meu Co-orientador, Professor Doutor Vítor Alves pela disponibilidade, boa disposição e clareza. Ajudando-me em todos os passos e criticando o meu trabalho nos momentos mais necessários.
À forma como Orientadora e Co-orientador funcionaram em equipa procurando sempre o melhor para este projeto. Sem eles este trabalho não seria possível e por este motivo lhes estou muito grata.
À Rita Ferreira, que foi uma pessoa fundamental para este projeto, mas acima de tudo para a forma como trabalho em laboratório e como me sinto no papel de investigadora, uma vez que me ensinou todas as ferramentas para realizar um trabalho profissional. Neste contexto agradeço também à Carla Martins, pela disponibilidade para ajudar sempre que necessário, procurando sempre ensinar-me o ensinar-melhor modo de fazer as coisas.
À Florina por acreditar tanto em mim e por estar sempre disponível para melhorar o meu dia.
A todos os colegas com os quais partilhei o laboratório, tanto na FCT como no ISA (Marta Neta, Andreia Medeiros, Carina Manjua, Hugo Andrade, Flávia Ribeiro, Patrícia Fradinho, Vanessa Batista, Daniela Silva e Daniel Duarte) que me proporcionaram bons momentos e facilitaram os momentos mais complicados.
Aos meus amigos e familiares que acompanharam a minha jornada e me incentivaram a dar sempre o melhor de mim.
XIII
Resumo
A concentração de bebidas tem grande interesse, uma vez que permite a redução dos custos de transporte, armazenamento e embalamento, da mesma forma permite o aumento do tempo de vida dos produtos, originado pela superior resistência à atividade microbiana.
Os processos com membranas têm vindo a ser propostos para a concentração de bebidas como alternativas promissoras ao processo tradicional de concentração devido às moderadas condições de operação. Neste estudo foi usado o processo de evaporação osmótica com o objetivo de concentrar três diferentes chás e sumo de laranja natural, bem como avaliar o efeito deste processo nas propriedades organoléticas e atividade antioxidante.
O processo de concentração foi levado a cabo num contactor de membrana de fibras ocas. A
bebida foi circulada na carcaça do contactor e a solução osmótica concentrada (CaCl2 5M) foi circulada
no interior das fibras. O fluxo, força motriz e coeficiente de transferência de massa foram avaliados durante o tempo do processo. Todas as bebidas foram concentradas pelo menos três vezes.
As bebidas concentradas foram analisadas em termos da sua atividade antioxidante (métodos DPPH e FRAP), conteúdo de fenólicos totais (método Folin-Ciocalteu) e cor. A concentração de ácido
ascórbico foi medida para o sumo de laranja pelo método 2,6 - diclorofenolindofenol – extração com
xileno.
Os resultados indicam que a atividade antioxidante e o conteúdo de fenólicos totais permaneceu constante durante as primeiras seis horas do processo de concentração, após as quais foi registado o seu decréscimo. Foram observadas alterações na cor das bebidas após o processo de concentração
(7,11 < ΔE*I,F < 24,32). O conteúdo de ácido ascórbico decresceu 32,7% durante o processo de
concentração. Contudo, estes resultados não são uma limitação, uma vez que este pode ser operado num menor tempo, usando contactores de membrana com maiores áreas de contacto.
Palavras-chave: evaporação osmótica; contactores de membrana; concentração de bebidas; atividade
XV
Abstract
The concentration of beverages has a great interest because it enables lowering the
transportation, storage and packaging costs, as well as the increase of product’s shelf life originated by
its higher resistance to microbial activity.
Membrane processes have been proposed for beverages’ concentration as promising alternatives to the traditional concentration processes due to the mild operating conditions. In this work, the osmotic evaporation membrane process was used in order to concentrate three different teas and fresh orange juice, as well as evaluating the effect of this process on the organoleptic properties and antioxidant activity.
The concentration process was carried out in a hollow fibre membrane contactor. The beverage
was circulated through the shell side of the contactor and a concentrated osmotic solution (CaCl2 5M)
was circulated inside the fibres. The flux, the driving force and the mass transfer coefficient were evaluated during the process time. All beverages were concentrated at least three times.
The concentrated beverages were analysed in terms of their antioxidant activity (DPPH and FRAP methods), total phenolic content (Folin-Ciocalteu method) and colour. Ascorbic acid concentration was measured for the orange juice by 2,6 - dichlorophenolindophenol - xylene extraction method.
The results indicate that the antioxidant activity and total phenolic content remains constant during the first six hours of the concentration process, after which a decrease was noticed. Alterations in the
beverages colour after the concentration process (7.11 < ΔE*I,F < 24.32) were observed. The content of
ascorbic acid decreases 32.7% during the concentration process. However, these results are not a limitation since the process can be operated in a shorter time, using membrane contactors with higher contact areas.
Keywords: osmotic evaporation; membrane contactors; beverage concentration; antioxidant activity; phenolic
XVII
Contents
Chapter 1 Thesis Introduction ... - 1 -
1.1 Background and Motivation ... 3
1.2 Objectives and Thesis outline ... 6
1.3 References ... 7
-Chapter 2 Optimization of the operating conditions in OE ... - 9 -
2.1 Introduction ... 11
2.2 Experimental ... 21
2.2.1 Osmotic Evaporation unit and procedures ... 21
2.3 Results and Discussion... 23
2.3.1 Optimization of hydrodynamic conditions on the fibres ... 23
2.3.2 Optimization of hydrodynamic conditions in the shell side of the module ... 24
2.3.3 Mass transfer correlations ... 25
2.3.3.1 Fibres mass transfer correlation ... 25
2.3.3.2 Shell side mass transfer correlation ... 26
2.4 Intercalary Remarks ... 27
2.5 References ... 28
-Chapter 3 Study of Teas Concentration Process ... - 31 -
3.1 Introduction ... 33
3.2 Experimental ... 35
3.2.1 Extraction process of teas ... 35
3.2.2 Concentration process by OE ... 35
3.2.3 Total Solids determination ... 35
3.2.4 Total phenolic content ... 36
3.2.5 Antioxidant Activity ... 36
3.2.6 Colour analysis ... 37
3.3 Results and Discussion... 38
3.3.1 Concentration process by OE ... 38
3.3.2 Evaluation of teas concentration ... 40
3.3.3 Antioxidant activity and phenolic content ... 42
3.3.3.1 Total phenolic content ... 42
3.3.3.2 Antioxidant activity ... 43
3.3.3.3 Relation between antioxidant activity and total phenol content... 44
-XVIII
3.4 Intercalary Remarks ... 47
3.5 References ... 48
-Chapter 4 Study of Orange juice Concentration Process ... - 51 -
4.1 Introduction ... 53
4.2 Experimental ... 56
4.2.1 Preparation of the orange juice ... 56
4.2.2 Concentration process by OE ... 56
4.2.3 Total phenolic and ascorbic acid content ... 57
4.2.4 Antioxidant Activity ... 57
4.2.5 Viscosity measurement ... 57
4.2.6 Colour analysis ... 57
4.3 Results and Discussion... 59
4.3.1 Evaluation of the concentration process by OE ... 59
4.3.3 Antioxidant Activity ... 62
4.3.3.1 Total phenolic content ... 62
4.3.3.2 Ascorbic acid content ... 63
4.3.3.3 Antioxidant activity ... 64
4.3.3.4 Relation between antioxidant activity and total phenolic content ... 65
4.3.4 Colour analysis ... 65
4.4 Intercalary remarks ... 67
4.5 References ... 68
-Chapter 5 Conclusions and Future Perspectives ... - 71 -
5.1 General Conclusions... 73
5.2 Suggestions for Future Research ... 75
XIX
List of figures
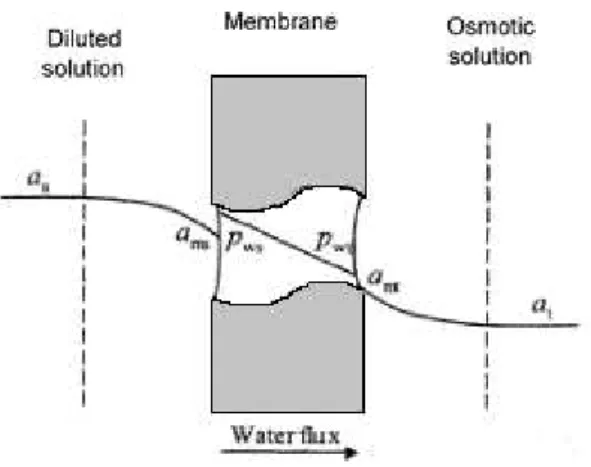
Figure 2.1. Water activity profile in the OE process (Alves, Koroknai, Bélafi-Bakó, & Coelhoso, 2004) . - 11
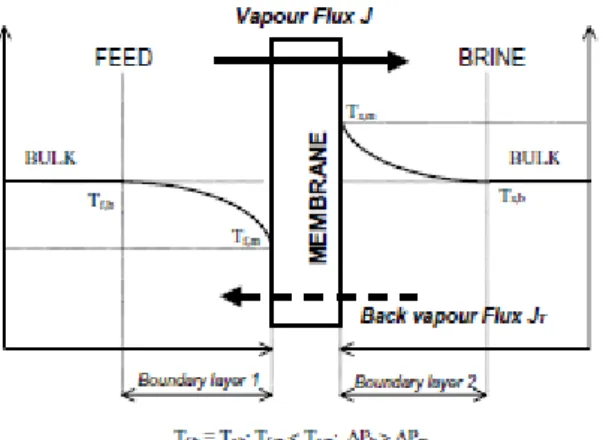
-Figure 2.2. Temperature profiles due to polarization in OE process (Bui, Nguyen, & Joachim, 2005)- 12
-Figure 2.3 Experimental setup: (1) membrane contactor; (2) calcium chloride anhydrous solution reservoir; (3) water/sucrose solution reservoir; (4) balance; (5) pump; (6) flow meter; (7) pressure gauge; (8) thermocouple. ... 21 -Figure 2.4 Relation between the calcium chloride anhydrous solution and the water flux for OE experiments. ... 23 -Figure 2.5 Overall mass transfer coefficient for the experiments carried out varying the Reynolds number
in the fibres, for different CaCl2 solutions (Shell side: deionized water, Re = 2.17). Orange line:
membrane mass transfer coefficient. ... 23 -Figure 2.6 Water flux as a function of the Reynolds number in the shell side of the module, for three
different sucrose solutions (fibres:CaCl2 (5M), Re = 0.9) ... 24
-Figure 2.7 Overall mass transfer coefficients for the experiments carried out varying the Reynolds
number in the shell side of the module, for three different sucrose solutions (fibres:CaCl2 (5M), Re = 0.9)
... 25 -Figure 2.8 Relation between experimental data (points) and the correlation obtained by Viegas et al. (Dashed Line) for the mass transfer coefficient on the fibres side of the module. Correlation with the
alteration of α parameter from 0.2 to 0.6 (Line). ... 26
-Figure 2.9 Relation between the experimental data (dots) and the correlation obtained by Yang and Cussler (Dashed Line) for the mass transfer coefficient on the shell side of the module. Correlation with
the alteration of α parameter from 1.25 to 0.7 (Line). ... 26
-Figure 3.1. Water flux as a function of the time. Green – Medicinal Rosil Nº 6 tea; Brown – Black tea;
Pink – Forest Fruit tea. ... 38
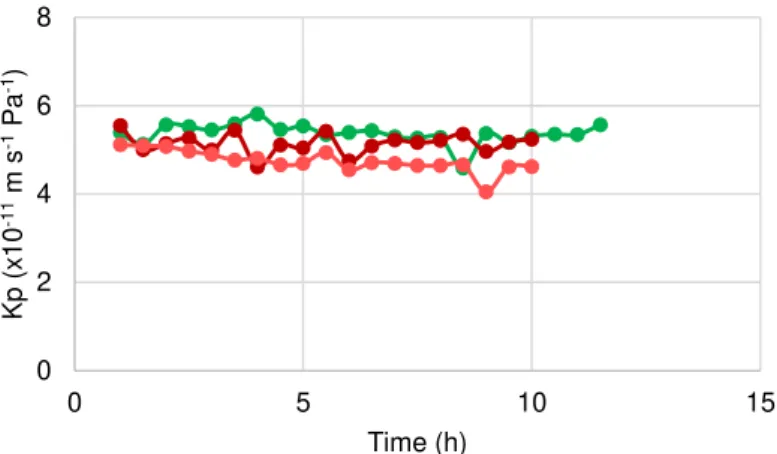
-Figure 3.2 Overall mass transfer coefficient as a function of the time. Green – Medicinal Rosil Nº 6 tea;
Brown – Black tea; Pink – Forest Fruit tea. ... 39
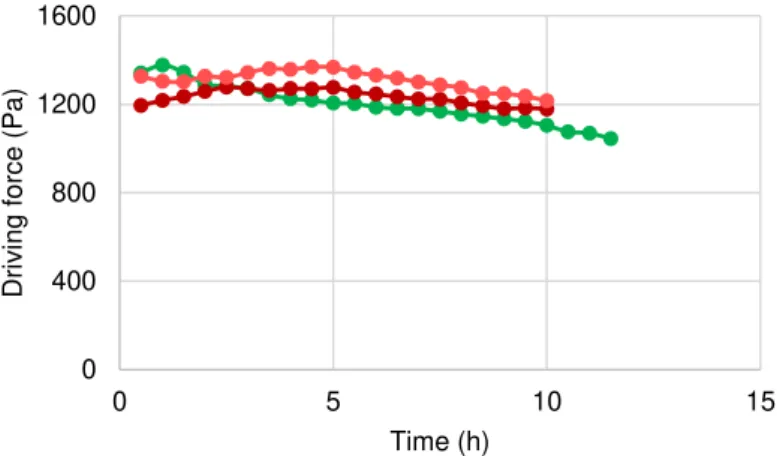
-Figure 3.3. Driving force as a function of the time. Green – Medicinal Rosil Nº 6 tea; Brown – Black tea;
Pink – Forest Fruit tea. ... 40
-Figure 3.4 Variation of the water flux and total solids content (TS) through the concentration process to
the Medicinal Rosil Nº 6 tea. Blue – Water flux. Green TS. ... 41
-Figure 3.5. Variation of the water flux and total solids content (TS) through the concentration process to
the Black tea. Blue – Water flux. Brown TS. ... 41
-Figure 3.6. Variation of the water flux and total solids content (TS) through the concentration process to
the Forest Fruit tea. Blue – Water flux. Pink TS. ... 41
-Figure 3.7 Total phenolic content through the concentration process. Brown – Black tea; Green –
-XX
Figure 3.8. Antioxidant activity through concentration process by FRAP method. Brown – Black tea; Pink
– Forest Fruit tea; Green – Medicinal Rosil Nº 6 tea. ... 43
-Figure 3.9. Antioxidant activity through concentration process by DPPH method. Brown – Black tea; Pink – Forest Fruit tea; Green – Medicinal Rosil Nº 6 tea. ... 43
-Figure 3.10 Relation between phenolic content and antioxidant activity (FRAP) to the medicinal Rosil Nº 6 tea ... 45
-Figure 3.11 Relation between phenolic content and antioxidant activity (DPPH) to the medicinal Rosil Nº 6 tea ... 45
Figure 3.12 Relation between phenolic content and antioxidant activity (FRAP) to the Black tea ... 45
Figure 3.13 Relation between phenolic content and antioxidant activity (DPPH) to the Black tea ... 45
-Figure 3.14 Relation between phenolic content and antioxidant activity (FRAP) to the Forest Fruit tea . - 45 -Figure 3.15 Relation between phenolic content and antioxidant activity (DPPH) to the Forest Fruit tea - 45 Figure 4.1 Water flux as a function of the time performed with 1.7 x 55 MiniModule. ... 59
-Figure 4.2 Concentration of Orange Juice as a function of the time using the 2.5 x 8 EXTRA-FLOW LiquiCel module. ... 60
Figure 4.3 Water flux as a function of the time using the 2.5 x 8 EXTRAFLOW LiquiCel module. 61 -Figure 4.4 Driving force as a function of the time using the 2.5 x 8 EXTRA-FLOW Liqui-Cel module. ... - 61 -Figure 4.5 Overall mass transfer coefficient as a function of the time using the 2.5 x 8 EXTRA-FLOW LiquiCel module. ... 61
Figure 4.6 Total phenolic content through the concentration process for orange juice. ... 62
Figure 4.7 Antioxidant activity through concentration process by FRAP method for orange juice ... 64
Figure 4.8 Antioxidant activity through concentration process by DPPH method for orange juice. .. 64
Figure 4.9 Relation between phenolic content and antioxidant activity (FRAP) for orange juice. .... 65
Figure 4.10 Relation between phenolic content and antioxidant activity (DPPH) for orange juice. .. 65
Figure A.1 Dimension specifications for the 1.7 x 55 MiniModule membrane contactor. ... 80
Figure A.2 Dimension specifications for the 2.5 x 8 EXTRAFLOW LiquiCel membrane contactor. 81 -Figure A.3 Temperature profile for the Medicinal Rosil Nº 6 tea concentration process. Fibres: CaCl2 5M. ... 84
-Figure A.4 Temperature profile for the Black tea concentration process. Fibres: CaCl2 5M. ... 84
-Figure A.5 Temperature profile for the Forest Fruit tea concentration process. Fibres: CaCl2 5M. .. 84
-Figure A.6 Temperature profile for the Orange juice concentration process. Fibres: CaCl2 5M. ... 84
Figure A.7 Calibration curve for FRAP method. ... 85
Figure A.8 Calibration curve for DPPH method. ... 85
Figure A.9 Calibration curve for the FolinCiocalteu method. ... 85
-XXI
List of tables
Table 2.1 Mass transfer correlations used to predict the individual mass transfer coefficients ... 16
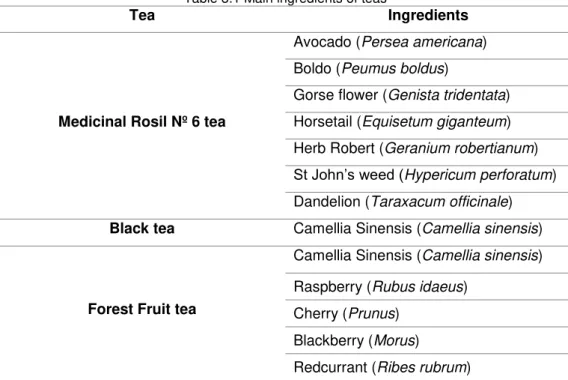
Table 3.1 Main ingredients of teas ... 34
Table.3.2 Initial and final permeate fluxes during tea concentration process ... 38
-Table 3.3 Average of the overall Mass transfer coefficients (10-11 m-1 s-1 Pa-1) for each tea during the OE process ... 39
-Table 3.4 Differences in the colour of teas before and after the concentration process. Subscripts I, F and R represents Initial juice, Final juice and Reconstituted to the initial concentration juice respectively. ... 46
-Table 4.1 Characteristics table of the two membrane contactors used in the concentration process of fresh Orange juice. ... 56
Table 4.2 Effective mass of phenolics (mg GAE) during the concentration process. ... 62
Table 4.3 Ascorbic acid content before and after the Orange juice concentration process by OE. .. 63
-Table 4.4 Differences in the colour of orange juice before and after the concentration process. Subscripts I, F and R represents Initial juice, Final juice and Reconstituted to the initial concentration juice respectively. ... 65
-Table 4.5 Whiteness index and browning index for the orange juice before and after (reconstituted for the initial concentration) the concentration process. ... 66
Table A.1 Specifications for 1.7 x 55 MiniModule. ... 79
Table A.2 Specifications for 2.5 x 8 EXTRAFLOW LiquiCel. ... 80
Table A.3 Characteristics of Celgard, X50215 Microporous Hollow Fiber Membrane... 82
-Table A.4 Calcium chloride characteristics corresponded to 25 ºC used in the hydrodynamic calculations ... 83
XXIII
List of abbreviations
Abbreviations
AACC American Association Cereal Chemistry
BI Browning index
CIE Comission Internationale de l’Eclairage (International Commission on Illumination)
DGM Dusty Gas Model
DPPH Diphenylpicrylhydrazyl
F2+TPTZ Ferrous – tripyridyltriazine
F3+TPTZ Ferric – tripyridyltriazine
FO Forward osmosis
FRAP Ferric reducing ability power
GAE Galic acid equivalents
MD Membrane distillation
OE Osmosis evaporation
PP Polypropylene
PTFE Polytetrafluoroethylene
PVDF Polyvinylidenefluoride
TE Trolox equivalentes
TEAC Trolox equivalents antioxidant activity
TS Total solids
UV/ Vis Ultraviolet – visible spectroscopy
WI Whiteness index
Variables
a Water activity (dimensionless)
A Membrane area (m2)
C* Chroma value (dimensionless)
dh Hydraulic diameter (m)
dp Membrane pore size (m)
Dw Water diffusion coefficient in the aqueous solution (m2 s-1)
hº Hue angle (dimensionless)
Jw Water flux (m3 m-2 s-1)
k Individual mass transfer coefficient (m s-1)
kmp Membrane mass transfer coefficient (m s-1 Pa-1)
Kp Overall mass transfer coefficient (m s-1 Pa-1)
XXIV
M Molality (mol L-1)
Mw Water molar mass (Kg mol-1)
P Total pressure (Pa)
P*w Pure water vapour pressure (Pa)
R Gas constant (K K-1 mol-1)
Re Reynolds number (dimensionless)
Sc Schmidt number (dimensionless)
Sh Sherwood number (dimensionless)
T Temperature (K)
v Cross flow velocity (m s-1)
Δa* Difference on red / green axis (dimensionless)
Δb* Difference on yellow / blue axis (dimensionless)
ΔE* Total colour difference value (dimensionless)
ΔL* Difference in lightness / darkness value (dimensionless)
Greek symbols
Constant (dimensionless)
Constant (dimensionless)
Membrane thickness (m)
Membrane porosity (dimensionless)
Fibre packing fraction (dimensionless)
Viscosity (Pa s)
Absolute viscosity (N s m-2)
Density (Kg m-3)
Membrane tortuosity (dimensionless)
Ẏ Shear rate (s-1)
Subscripts
lm Logarithmic mean
m Membrane
s Shell
t Tube / fibres
- 3 -
1.1 Background and Motivation
Natural beverages consumption is increasing due to their nutritional value and high levels of antioxidants, favouring health and well-being of the consumer. Teas with a global consumption of about 20% of the total consumption of beverages, and fresh juices with an annual growth of about 2% are examples of beverages which are being increasingly consumed due to their pleasant flavour and nutritional value (Neves, et al., 2010).
Tea consumption dates from the 27th century B.C. and today remains in the diet of millions of people, being one of the oldest beverages produced by biotechnological methods (Morais, Cavalcanti, Costa, & Aguiar, 2009). The interest in tea comes mainly from its aromas as well as the beneficial effect that the beverage can play in the health of consumers.
Depending on the processing used there are traditionally classified four types of tea distinguished by the degree of oxidation (Ruan, Wu, & Härdter, 1999).
White tea: Tea developed from young leaves not subjected to any oxidative process. Green tea: Developed from tea leaves that already have some oxidative process, but
which is stopped by the application of heat in the vapour form. Black tea: Tea made from leaves with a high degree of oxidation.
Oolong tea: Tea with a degree of oxidation between green teas and black teas.
Nearly half of the dry matter of teas is insoluble in water and some of its constituents are polyphenols, amino acids, caffeine, sugars and fatty acids. The most significant groups in the context of this work are polyphenols and vitamins. The polyphenols in tea represent about 25% of dry matter and belong mostly to the group of flavonoids or catechins depending on the type of tea. Regarding to vitamins present in tea the importance lies on riboflavin (vitamin B2) which remains constant during the processing of tea and ascorbic acid (vitamin C) which is completely oxidized during the oxidative process of tea (Lima, Mazzafera, Moraes, & Silva, 2009).
In the field of fruit juices, the orange juice is, according to Markestrat data consultancy, the most
consumed one, representing 32% of the consumers’ preferences (Neves, et al., 2010). Therefore,
orange juice was selected in this study, not only for its economic importance, but also because of the importance of oranges in Portugal.
Orange is one of the most consumed fruits in the world, taking up an area of 20361 hectares in Portugal. Algarve region is one of the largest producing areas, representing 69% of the total orange’s European production (Publicações: O Mercado da Laranja em Portugal, 2014).
In its nutritional composition the high level of vitamin C, folic acid and minerals stands out. The orange’s antioxidant properties are due fundamentally to beta-carotene, also responsible for the orange colour.
- 4 -
Teas are generally commercialized in the form of leaves or as liquid product. However, several recognized brands have already tried to innovate the product image through new forms of consumption, and in China are now produced each year, about fifteen thousand tons of tea concentrates (Xu, Chen, Yuan, Tang, & Yin, 2012).
The fruit juices like orange juice can currently reach the market in two general forms (Gil-Izquierdo, Gil, & Ferreres, 2002):
Fresh product, collected directly from the raw material and subjected to pasteurization; Concentrated product.
From the commercial point of view, the beverages’ concentration has a great interest due to the
decrease of transportation, storage and packaging costs, as well as the product’s shelf life increase
originated by its higher resistance to microbial activity (Álvarez, et al., 2000; Cassano, et al., 2003; Alves
& Coelhoso, 2006; Galaverna, et al., 2008). In addition, the beverages’ concentration allows assuring
the availability of seasonal products during the whole year, thus showing economic advantages and increasing the importance of agricultural products (Álvarez, et al., 2000).
During the beverages’ concentration process, water must be selectively removed, thus making it possible for the consumer, through water addition, obtain a beverage similar to the original, in terms of appearance, flavour and nutritional quality (Alves & Coelhoso, 2006).
The industrial processes used currently to concentrate beverages involve typically multi-stage vacuum evaporation (Petrotos & Lazarides, 2001). This commercial concentration process is based on a heat treatment, thereby implying alterations on the quality of the concentrated beverages, both in terms of organoleptic properties, such as colour and aroma compounds, and phenolic compounds content (Barbe, Bartley, Jacobs, & Johnson, 1998; Nii, Jebson, & Cussler, 2002).
Moreover, these industrial processes involve by high energetic costs that emphasize their disadvantages (Cassano, et al., 2003).
In order to overcome the negative aspects of the concentration process performed under high temperature, studies have emerged on alternative techniques. Freeze-concentration is a process used industrially in order to concentrate fruit juice. In this process, the water is removed in the form of crystals, allowing the flavour preservation and the maintenance of the chemical and biochemical product properties (Ramos, Delgado, Bautista, Morales, & Duque, 2005). However, this technique can only be applied to clarified liquid foods, revealing low productivity, not only because of the low degree of final concentration accomplished (40 to 55%), but also because of the significant product losses occurred (Dova, Petrotos, & Lazarides, 2007). Consequently, the disadvantages of this process are evident, especially in what regards to the high costs associated to this technique.
- 5 -
limitations of conventional evaporation process and allowing the beverages’ concentration at a higher
level, not occurring the thermal and chemical damages referred (Alves & Coelhoso, 2002; Cassano, et al., 2003). The operating pressure and temperature assure the advantage of a minor energetic cost associated, when compared to pressure driven membrane process.
Several authors have pointed out the use of integrated membrane processes as a viable alternative to currently used thermal concentration process (Álvarez, et al., 2000; Petrotos & Lazarides, 2001; Cassano, et al., 2003; Galaverna, et al., 2008).
Forward osmosis uses an osmotic solution in order to create an osmotic pressure gradient through a membrane that is permeable to water and impermeable to the solute, enabling the water removal during the concentration process. This technique allows achieving high final concentration without fouling. This technique main disadvantages are related to the membranes, namely the possibility
of some salt diffusion through the membrane, as well as the membrane’s lifetime and, inevitably, the
maintenance cost associated to the membrane replacement and reconcentration of the osmotic solution (Petrotos & Lazarides, 2001; Zhao, Zou, Tang, & Mulcahy, 2012).
Reverse osmosis can also be used, but in this case the water removal is due to the pressure gradient applied, that compared to the other membrane technologies, is higher (24 - 100 bar) (Martins, 2006). The final concentration content is limited to 20% of soluble solids (Álvarez, et al., 2000; Cassano, et al., 2003).
The membrane distillation is a technology in which two aqueous solutions are separated by a hydrophobic and microporous membrane. This process’ driving force is the water vapour pressure difference between the two solutions on the process (Cassano, et al., 2003). On an experimental situation, the two solutions are under different temperatures and this thermal gradient induces the water flux from the solution of higher temperature to the solution of lower temperature. This process, when
applied to beverages’ concentration is limited in what concerns to flux and aromas’ retention (Alves &
Coelhoso, 2006).
In the osmotic evaporation process, a hydrophobic, microporous membrane separates two solutions, one of them being a salt solution. Osmotic evaporation has advantages when compared to reverse osmosis, as it allows achieving juice concentrations similar to the industrial evaporation process because it does not show osmotic pressure limitations (Gostoli, 1999). Furthermore, osmotic evaporation overcomes membrane distillation because it allows isothermal operations, which is crucial for the concentration of a variety of beverages (Alves & Coelhoso, 2006). This process also preserve
the beverage’s aroma and nutritional value (Cassano, et al., 2003; Galaverna, et al., 2008; Cassano,
- 6 -
1.2 Objectives and Thesis outline
The aim of the present work is to study the potential of the osmotic evaporation process for the concentration of beverages (teas and orange juice), assessing its effect on the overall quality of the concentrated products obtained. The work has three specific objectives:
Evaluation of the optimal hydrodynamic conditions for the experimental setup used, in which was used an hollow fibre membrane contactor;
Study of the concentration process of four beverages (orange juice and teas) by osmotic evaporation, operating with the optimized operating conditions;
Evaluation of bioactive compounds content and antioxidant activity throughout the concentration process.
This thesis describes the study of the osmotic evaporation process applied to the concentration of orange juice and teas. It is organized in five chapters. Each one includes a short review of the state of the art, describes the materials and methods used in that chapter and presents the results discussion and the main conclusions obtained in that part of the work. A description of the chapters is presented below in more detail.
Chapter 1 consists on a general introduction of the research area in which this thesis is included, presenting the motivation and specific objectives of the work developed.
Chapter 2 is focused on to the optimization of the operating conditions of osmotic evaporation process. It includes the evaluation of the mass transfer coefficients, for the tube side and shell side, as well as the selection of the most suitable mass transfer correlations to describe mass transfer from those referred in the literature.
Chapter 3 presents the study of the osmotic evaporation process applied to the concentration of teas. This chapter analyses the process of concentration itself as well as the bioactive compounds content, antioxidant activity and colour during the concentration process.
Chapter 4 describes the osmotic evaporation process applied to the concentration of orange juice. As in chapter three, it is also focused on the evaluation of antioxidant activity, bioactive components and colour alterations of the juice during the concentration process.
- 7 - 1.3 References
AACC International. Approved Methods of Analysis, 11th Ed. Method 86-10.01. Ascorbic Acid -
Indophenol-Xylene Extraction Method. Approved November 3, 1999. AACC International, St Paul, MN, USA. http://dx.doi.org/10.1094/AACCIntMethod-86-10.01
Álvarez, S., Riera, F. A., Álvarez, R., Coca, J., Cuperus, F. P., Bouwer, S. T., Boswinkel, G., Gemert, R.W., Veldsink, J.W., Giorno, L., Donato, L., Todisco, S., Drioli, E., Olsson, J., Trägardh, G., Gaeta, S.N., Panyor, L. (2000). A new integrated membrane process for producing clarified apple juice
and apple juice aroma concentrate. Journal of Food Engineering, 46, 109-125.
Alves, V. D., & Coelhoso, I. M. (2002). Mass transfer in osmotic evaporation: effect of process
parameters. Journal of Membrane Science, 208, 171-179.
Alves, V. D., & Coelhoso, I. M. (2006). Orange juice concentration by osmotic evaporation and
membrane distillation: A comparative study. Journal of Food Engineering, 74, 125-133.
Barbe, A. M., Bartley, J. P., Jacobs, A. L., & Johnson, R. A. (1998). Retention of volatile organic
flavour/fragrance components in the concentration of liquid foods by osmotic distillation. Journal of
Membrane Science, 145, 67-75.
Cassano, A., Drioli, E., Galaverna, G., Marchelli, R., Silvestro, G. D., & Cagnasso, P. (2003).
Clarification and concentration of citrus and carrot juices by integrated membrane processes. Journal
of Food Engineering, 57, 153-163.
Cassano, A., Conidi, C., & Drioli, E. (2010). Physico-chemical parameters of cactus pear (Opuntia
ficus-indica) juice clarified by microfiltration and ultrafiltration processes. Desalination, 250, 1101-1104. Dova, M. I., Petrotos, K. B., & Lazarides, H. N. (2007). On the direct osmotic concentration of
liquid foods. part I: Impact of process parameters on process performance. Journal of Food Engineering,
78, 422-430.
Galaverna, G., Silvestro, G. D., Cassano, A., Sforza, S., Dossena, A., Drioli, E., & Marchelli, R. (2008). A new integrated membrane process for the production of concentrated blood orange juice:
Effect on bioactive compounds and antioxidant activity. Food Chemistry, 106, 1021-1030.
Gardner, P. T., White, T. A., McPhail, D. B., & Duthie, G. G. (2000). The relative contributions of
vitamin C, carotenoids and phenolics to the antioxidant potential of fruit juices. Food Chemistry, 68,
471-474.
Gil-Izquierdo, A., Gil, M. I., & Ferreres, F. (2002). Effect of Processing Techniques at Industrial
Scale on Orange Juice Antioxidant and Beneficial Health Compounds. Journal of Agricultural and Food
Chemistry, 50, 5107-5114.
Gostoli, C. (1999). Thermal effects in osmotic distillation. Journal of Membrane Science, 163,
75-91.
Lima, J. D., Mazzafera, P., Moraes, W. S., & Silva, R. B. (2009). Tea: aspects related to the quality
and prospects. Ciência Rural, 39, 1270-1278.
- 8 -
Morais, S. M., Cavalcanti, E. S. B., Costa, S. M. O., & Aguiar, L. A. (2009). Ação antioxidante de
chás e condimentos de grande consumo no Brasil. Brazilian Journal of Pharmacognosy, 19, 315-320.
Neves, M. F., Trombin, V. G., Milan, P., Lopes, F. F., Cressoni, F., & Kalaki, R. (2010). O retrato
da citricultiura brasileira. Brasil: Markestrat.
Nii, S., Jebson, R. S., & Cussler, E. L. (2002). Membrane evaporators. Journal of Membrane
Science, 201, 149-159.
Onsekizoglu, P., Bahceci, K. S., & Acar, M. J. (2010). Clarification and the concentration of apple
juice using membrane processes: A comparative quality assessment. Journal of Membrane Science,
352, 160-165.
Petrotos, K. B., & Lazarides, H. N. (2001). Osmotic concentration of liquid foods. Journal of Food
Engineering, 49, 201-206.
Publicações: O Mercado da Laranja em Portugal. (June 30, 2014). Obtained of Observatório dos
Mercados Agrícolas e das Importações Agro-Alimentares:
http://www.observatorioagricola.pt/item.asp?id_item=129
Ramos, F. A., Delgado, J. L., Bautista, E., Morales, A. L., & Duque, C. (2005). Changes in volatiles
with the application of progressive freeze-concentration to Andes berry (Rubus glaucus Benth). Journal
of Food Engineering, 69, 291-297.
Ruan, J., Wu, X., & Härdter, R. (1999). Effects of potassium and magnesium nutrition on the
quality components of different types of tea. Journal of the Science of Food and Agriculture, 79, 47-52.
Torun, M., Rácz, G., Fogarassy, E., Vatai, G., Dinçer, C., Topuz, A., & Özdemir, F. (2014).
Concentration of sage (Salvia fruticosa Miller) extract by using integrated membrane process.
Separation and Purification Technology, 132, 244-251.
Xu, Y., Chen, S., Yuan, H., Tang, P., & Yin, J. (2012). Analysis of cream formation in green tea
concentrates with different solid concentrations. Journal of Food Science and Technology, 49, 362-367.
Zhao, S., Zou, L., Tang, C. Y., & Mulcahy, D. (2012). Recent developments in forward osmosis:
- 11 -
2.1 Introduction
Nowadays, the sector of concentrated beverages faces more demanding consumers that underline the disadvantages associated with current concentration processes, which have drawbacks such as changes in the organoleptic properties and high energy costs.
The membrane process that have appeared over time enable improvements not only in the industrial component such as the efficiency and yield, but also on the quality of the beverage, improving aspects like colour, flavour and aroma, maintaining the quality of the processed beverage more close to that of the original. Thus, membrane process should be considered in the industrial aspect as promising technologies due the advantages they present.
Among membrane technologies, osmotic evaporation process emerges as a relevant process because of its advantages when compared to other membrane processes. The osmotic evaporation allows the removal of water from aqueous solutions by a driving force generated under ambient conditions of pressure and temperature. This allows obtaining concentrated beverages without thermal and mechanical damages, situation that is contrary to the industrial current process (Cassano, et al., 2003).
The process of osmotic evaporation uses a porous hydrophobic membrane that separates the solution to be concentrated from an osmotic solution, usually a salt solution, with low water activity.
Because of the hydrophobic characteristics of the membrane, and taking into account that the water’s
surface tension is higher than the surface tension of the material constituting the membrane, aqueous solutions cannot enter the pores, forming a liquid-vapour interface (Alves & Coelhoso, 2007). The water activity difference between the two solutions induces a driving force to the water flux, which is the water vapour pressures difference. At this point, the water evaporates in the solution to be concentrated and the vapour is transported through the membrane, before being condensed in the osmotic solution, aiming for the chemical potential equilibrium (figure 2.1).
- 12 -
The water flux is proportional to the water vapour pressure difference between both phases:
Jw= Kp𝛥𝑝𝑤𝑏⇔ Jw= Kp(P1− P2)
Equation 2.1
Where Kp is the overall mass transfer coefficient (m s-1 Pa-1) and P1 and P2 correspond
respectively to the water’s vapour pressure of the solutions in the sell side and in the fibres (Pa).
Concerning the water’s vapour pressure, it can be related to the water’s activity according to the equation 2.2.
Pi = aiPi∗
Equation 2.2
Where ai is the water activity in the two phases and Pi* is the pure water vapour pressure (Pa).
This way, the water saturation vapour pressure at the bulk temperature is given by the respective Antoine equation, as represented in equation 2.3 (Poling, Prausnitz, & O'Connell, 2001).
P∗= exp [23,2 − ( 3816,2
T(K) − 46,1)]
Equation 2.3
Due to the low temperatures, the water fluxes obtained are low, representing a disadvantage to the technology industrialisation. To overcome this situation and increase mass transfer rate the use of membrane contactors with high specific areas, easy scale-up and low manufacturing costs, will make this technique very promising for the concentration process at industrial scale (Alves, Koroknai, Bélafi-Bakó, & Coelhoso, 2004). The hollow fibre modules use microporous fibres that are woven into a fabric that allows more uniform fibre spacing, which in turn leads to higher mass transfer coefficients than those obtained with individual fibres (Gabelman & Hwang, 1999). In this master thesis it was used a hollow fibre module with parallel flow in the shell side.
The temperature polarization is a phenomenon observed during the process of mass transfer in osmotic evaporation technology. This phenomenon occurs due to the evaporation of water from the feed side which promotes a temperature reduction along the boundary layer and a consequent increase in the temperature of the brine side, because of the condensation of water in that side of the membrane. The temperature profiles during the process of mass transfer are shown in figure 2.2.
- 13 -
Thinner membranes with higher heat conductivity, allow a more efficient process because the thermal equilibrium is reached more quickly, minimizing the effect of temperature polarization (Kunz, Benhabiles, & Ben-Aïn, 1996). Temperature monitoring during the process of mass transfer is important in order to minimize the difference of chemical potential that can happen due to the variations related with the temperature.
Nevertheless, the temperature polarization phenomenon represents a small contribution compared to the concentration polarization phenomenon (Bui, Nguyen, & Joachim, 2005).
During the process of osmotic evaporation, water evaporates from the solution to be concentrated and the vapour is transported to the opposite side where condensation occurs, leading to dilution of the osmotic solution. The processes of evaporation and condensation on the membrane interfaces, induces the increasing of the solute concentration in the feed side and the dilution of the solute concentration on the brine side. This phenomenon is known as concentration polarization, and the concentration gradient formed is contrary to the temperature gradient observed (figure 2.1) (Bui, Nguyen, & Joachim, 2005).
As a result, due to the concentration polarization phenomena, the water activity at the membrane interface is different from the bulk water activity resulting on the establishment of two diffusional boundary layers. Consequently, the reduction of the effective driving force takes place due to the existence of three water flux resistances (Alves & Coelhoso, 2002).
Boundary layers resistance on both sides of the membrane; Membrane resistance.
In this situation, the water flux may be associated with the respective individual mass transfer coefficients by equation 2.4.
Jw= ks(as− ams) = kt(amt− a𝑡)
Equation 2.4
Where ks and kt are the individual mass transfer coefficients in the boundary layers (m s-1).
The effect of concentration polarization phenomenon is closely related to operational conditions and it is, therefore, easy to minimize by improving the hydrodynamic conditions, namely increasing the Reynolds number (Re) on both sides of the membrane (Martins, 2006).
The rate of water transport between the two phases is crucial for the design and cost of systems of osmotic evaporation (Viegas, et al., 1998). Thereby the overall mass transfer coefficient is extremely important, since it limits the rate at which the components are transferred. The overall mass transfer coefficient can be defined as:
Kp= 1
(Pws∗
ks) + ( 1kmp) + (P
wt∗
kt)
Equation 2.5
Where Kp is the overall mass transfer coefficient (m s-1 Pa-1); P*ws e P*wt are the pure water
- 14 -
The mass transfer coefficient of the membrane (kmp) is a value that varies with the partial pressure
of air in the pores of the membrane and the composition of the aqueous solutions, which in most cases
are not significant factors, causing the kmp to be assumed as constant (Alves & Coelhoso, 2002). The
membrane mass transfer coefficient (kmp) is directly proportional to pore size and porosity of the
membrane, and inversely proportional to thickness and tortuosity of the same. kmp may be described by
the Dusty Gas Model (DGM) (Alves, Koroknai, Bélafi-Bakó, & Coelhoso, 2004): .
kmp=1,8 × 20
−5
RTδ [
3τ
εdp( 8RTπM
w) 1/2+
τρair
ε P Dw−air
]
−1
Equation 2.6
Where dp is the pore size (m); ε is the porosity; pair is the air partial pressure (Pa); 𝜏 is the tortuosity;
δ is the membrane thickness (m); Dw-air the water vapour diffusion coefficient in air; Mw the water molar
weight (kg mol-1); R is the gas constant (JK-1mol-1); T the temperature (K); P the total pressure (Pa).
The overall resistance to mass transfer (1/Kp) is the sum of three resistances to the water flux:
the resistance of the boundary layer in the diluted solution side, the resistance of the membrane and the resistance of the boundary layer in the osmotic solution side.
Considering a situation where the concentration polarization is negligible, which means that resistance occurs only in the membrane, the overall mass transfer coefficient is equivalent to the membrane mass transfer coefficient. If the boundary layers cannot be neglected, the dependence of the individual mass transfer coefficient of both sides of the membrane can be correlated according to the general mass transfer correlation (Alves & Coelhoso, 2002):
Sh = αReβScγ
Equation 2.7
Where 𝛼, β e 𝛾 are constants. The dimensionless numbers are defined as follows (Bui, Nguyen,
& Joachim, 2005):
Sh𝑖=𝑘𝑖𝐷×𝑑𝑖𝑤ℎ𝑖 𝑅𝑒𝑖=𝑣𝑖×𝑑𝜇ℎ𝑖𝑖×𝜌𝑖 Sc𝑖=𝐷𝑖𝑤𝜇 ×𝜌𝑖 𝑖
Where the subscript (i) can represent either the fibre values or the shell values; dh is the hydraulic
diameter (m); ρ is the density (kg m-3); v is the cross-flow velocity (m s-1); μ is the viscosity of the liquids
(Pa.s).
The evaluation of the mass transfer coefficients is extremely important for the design of mass transfer equipment.
- 15 -
The mass transfer correlations in the fibres are generally similar and applied to a large number of cases. However, the same cannot be considered for the shell side. In this context, there are several correlations determined by different authors, but none of them is applicable to a high number of experimental conditions (Gawronski & Wrzesinska, 2000). It is still possible to conclude:
The shell side Sherwood number strongly depends on the fibre packing density; The fibre Sherwood number is independent of the module packing density; Mass transfer is influenced by the inlet ports design and module geometry.
- 16 -
Table 2.1 Mass transfer correlations used to predict the individual mass transfer coefficients
Equation Author Comment Reference
Tube side flow
Sh=2.66Re0.25 Sc0.33 (d/L) 0.33 Alves et al. Correlation valid for Reynolds between 0.5 and 45. (Alves & Coelhoso, 2007)
Sh=1.62Re0.33 Sc0.33 (d/L) 0.33 Lévèque Equation that predicts with reasonable accuracy the mass transfer
coefficients for high Graetz.
(Gawronski & Wrzesinska, 2000)
Sh=0.2Re1.01 Sc0.33 (d/L) 0.33 Viegas et al. Obtained correlation for Re < 24 e Gz < 65. (Viegas, et al., 1998)
Sh=1.5 ((d/L)ReSc)0.33 Dahuron and
Cussler Equation obtained with electrolytes and protein extraction trials.
(Gawronski & Wrzesinska, 2000)
Sh=1.64((d/L)ReSc)0.33 Yang and Cussler Obtained equation for gas absorption. (Gawronski &
Wrzesinska, 2000)
Shell side flow parallel to the fibres
Sh=15.4Re0.92 Sc0.33 (dh/L) Alves et al. Correlation valid for Reynolds between 0.5 and 45. (Alves & Coelhoso, 2007)
Sh=8.71Re0.74 Sc0.33 (dh/L) Viegas et al. Obtained correlation with solvent extraction tests, applied at low
Reynolds (0.16 < Re < 7.30) (Viegas, et al., 1998)
Sh=8.8Re Sc0.33 (dh/L) Dahuron and
Cussler
Equation obtained for extraction solvents with packing factor equal to 0.15.
(Gabelman & Hwang, 1999)
Sh=5.85Re0.6 Sc0.33 (dh/L) Prasad and Sirkar Correlation obtained for liquid-liquid extraction trials applied to
different types of solutes and solvents and Re < 500.
(Gabelman & Hwang, 1999)
Sh=0.022Re0.6 Sc0.33 Knudsen and Katz Correlation does not apply generally in membrane contactors. (Gabelman & Hwang,
1999)
Sh=1.25(Redh/L)0.93 Sc0.33 Yang and Cussler Equation obtained for high Reynolds range (0.5 < Re < 500) in
tests of stripping gas.
- 17 -
Sh=(0.53-0.58ϕ)Re0.53Sc0.33 Costello et al. Correlation obtained for the gas removal applied to Reynolds
higher than 20 (20 < Re < 300).
(Gabelman & Hwang, 1999)
Hollow fibre fabric
Sh=0.82Re0.49 Sc0.33 Wickramasinghe et
al.
Average of correlations developed using four different configurations, with 0.001 < Re < 10.
(Gabelman & Hwang, 1999)
Sh=0.18Re0.86 Sc0.33 Wang and Cussler Developed using a rectangular module. (Gabelman & Hwang,
1999)
Sh=0.46Re0.46 Sc0.33 Wang and Cussler Developed using a baffled cylindrical module, similar to other
correlations obtained with modules having uniform fibre spacing.
(Gabelman & Hwang, 1999)
Sh=0.57Re0.31 Sc0.33 Bhaumik et al. Developed using a cylindrical module with liquid flow
perpendicular to the fibres.
- 18 -
During the process of osmotic evaporation, there are several parameters that influence the process. In the following pages, the most relevant factors will be discussed in order to understand how they can affect the process.
The membrane to be used in an osmotic evaporation process should be microporous, hydrophobic and composed of a polymeric material.
The water transport through the membrane occurs in the form of vapour through the pores. Consequently, as the pore diameter increases, the molecular diffusion also increases (Alves & Coelhoso, 2004).
The membrane thickness is also important because it determines the water diffusion path, and must be low, thus minimizing the resistance of the membrane.
Therefore the ideal membranes for osmotic evaporation processes are polymeric membranes formed by materials such as polytetrafluoroethylene (PTFE), polypropylene (PP) or polyvinylidenefluoride (PVDF) with pore diameters between 0.01 to 1.0 μm, thickness from 10 to 300 m and porosity between 40 and 80% (Kunz, Benhabiles, & Ben-Aïn, 1996; Courel, Tronel-Peyroz, Rios, Dornier, & Reynes, 2001).
Another important feature with respect to the osmotic evaporation membranes is the relation between hydrophobicity and wettability. With the purpose of the occurrence of the osmotic evaporation, according to the theoretical principles that support it, is necessary to ensure the integrity of the gas phase supported by the material constituting the membrane. If membrane wetting occurs, caused by the pressure difference resulting from the movement of fluids, an additional liquid flow occurs, leading to mixing of solutions and consequently the passage of all non-volatile constituents of the solution, leading to the incorrect operability of the process (Courel, Tronel-Peyroz, Rios, Dornier, & Reynes, 2001).
The hydrodynamic conditions play a major role in the phenomenon of mass transfer. The optimum hydrodynamic conditions must be determined for each situation, but in general are associated with higher Reynolds numbers obtained with higher flow velocities.
The increased flow velocity on the osmotic solution side reduces the thickness of the boundary layer providing a superior driving force and therefore superior flux to a point where it stabilizes (Alves & Coelhoso, 2007).
Likewise increasing the velocity on the side of the solution to be concentrated reduces the effect of concentration polarization, also increasing the flux. However, the increase of the flow velocity must consider the limits of the pressure difference between the two sides of the membrane so that there does not occur penetration of liquid water into the pores (Martins, 2006).
- 19 -
The water flux increases with the temperature because: (i) with higher temperatures the diffusivity of water vapour in the pores of the membrane is facilitated leading to an increase in membrane mass transfer coefficient, (ii) the driving force increased due to the exponential relation between water vapour pressure and temperature.
The osmotic solution is typically a saline solution. The salt used should be able to reduce the difference in chemical potential between both sides of the membrane, providing the evaporation of water. It should also provide a range of high solubility for different temperatures and be stable in all analysed temperatures. It should not be volatile or react with volatile compounds, and finally must not present incompatible characteristics with the membrane or other materials that compromise the system, ie, should not be corrosive, toxic or destructive. Since the evaporation process has the ultimate goal of being implemented on industrial scale, the economic viability of the selected salt should be taken into account (Michaels, Hill & Jonson, 1998).
Studies with different osmotic agents determined that if the osmotic solutions used have the same water activity and the processes are carried out according to the same hydrodynamic conditions, similar water fluxes are obtained independently of the osmotic agent used. In any case, the choice of an osmotic agent must take into account parameters such as the water activity, viscosity and density of the osmotic solution (Alves & Coelhoso, 2002).
The osmotic solution is diluted during the mass transfer process. The lower concentration of solutes in this solution corresponds to a higher water activity, smaller density and viscosity of the solution, being the last ones responsible for the improvement of the hydrodynamic conditions. However, the increase of water activity has a greater importance than the decrease in properties of density and viscosity. Therefore, it occurs the reduction of the driving force and consequently a decrease in the permeate flux (Alves & Coelhoso, 2002).
Regarding the solution to be concentrated, the solids concentration increases during the concentration process because of the reduction of the water volume. The increased concentration of solutes promotes the increase in viscosity. Therefore it is expected the decrease of the water flux and diffusion coefficient. Despite the increasing concentration being equivalent to a reduction of water activity, this decrease is not significant as in osmotic solution, and therefore no significant changes are recorded in the permeate flux until higher concentrations of 40 % are obtained (Vaillant, et al., 2001).
To minimize the viscous effects caused by the increase of the viscosity of the beverages during the concentration process, the solution to be concentrated should circulate in the shell side of the module while the osmotic solution circulates in the lumen of the fibres.
The first papers on membranes were published in the 60’s, especially after the discovery of
asymmetric membranes technology by Loeb and Sourirajan. The interest in such studies increased with
the research on blood oxygenation in the 70’s and 80’s, and by this time were developed new
- 20 -
In 1988 Lefebvre announces the osmotic evaporation as a recent technology with eventual success in concentration of liquids such as milk, juice, coffee, tea and other non-food aqueous solutions (Lefebvre, 1988).
By the 90’s the first pilot plants to study the osmotic evaporation process begins to emerge.
Sheng, Johnson, & Lefebvre, (1991) studied the effect of operating conditions (flow rate, temperature and concentration) in the osmotic evaporation flux during concentration tests of orange,
apple and grape juices, using a PTFE membrane with pore size of 0.2 m and thickness of 100 m.
These authors found that the flux of water decreases with the increase of concentration of the juice and it is strongly dependent on the osmotic pressure difference. It also concluded that there is a relation between pore size and the obtained water flux in osmotic evaporation process.
Godino, Pena, Zarate, & Mengual, (1995) showed the influence of temperature on osmotic pressure and found that the largest fluxes obtained during osmotic evaporation are acquired with higher temperatures.
Courel, Dornier, Herry, Rios, & Reynes, (2000) determined hydrodynamic factors that can improve the process of osmotic evaporation, namely the increase in temperature. In the same year Bailey, Barbe, Hogan, Johnson, & Sheng, (2000) found that the water flux increases if a previous ultrafiltration step is carried out, because of the reduction in the viscosity of concentrated juice - membrane boundary layer, where the solute concentration is higher.
Alves & Coelhoso, (2002) analysed the importance of temperature, hydrodynamic conditions, nature and concentration of the osmotic agent applied to osmotic evaporation process. In this article, the authors describe the mass transfer model as a three resistances model.
Alves & Coelhoso, (2004) evaluated the influence of the pore diameter on the flux of water, describing it according to the following models: (i) dusty-gas; (ii) Knudsen; (iii) molecular diffusion. In addition to this publication Alves, Koroknai, Bélafi-Bakó, & Coelhoso, (2004) tested the osmotic evaporation process operating on different modules. They concluded that it is possible to operate the process so that only the membrane offers the resistance to mass transfer.
- 21 -
2.2 Experimental
2.2.1 Osmotic Evaporation unit and procedures
The experimental setup for osmotic evaporation process is presented in figure 2.3. It consists on
a hollow fibre membrane contactor (1.7 x 55 MiniModule) with an effective surface area of 0.54 m2. This
membrane contactor contains 7400 polypropylene fibres (Celgard X50-215 Microporous Hollow Fibre Membrane) with a nominal pore size of 0.04 μm, 40% porosity, 18 cm long, an internal diameter of 220 μm and a thickness of 40 μm. The description of the membrane contactor and the fibres used in this work are present in annex I.
Figure 2.3 Experimental setup: (1) membrane contactor; (2) calcium chloride anhydrous solution reservoir; (3) water/sucrose solution reservoir; (4) balance; (5) pump; (6) flow meter; (7) pressure gauge; (8) thermocouple.
The solutions were prepared with anhydrous calcium chloride (Panreac, Spain) (concentrations 2.5 - 6.7 M), deionized water and sucrose (concentrations of 10% (w/w); 20% (w/w) and 45% (w/w))
The solutions were pumped through the shell side of the module (water or sucrose solution) and lumen of the fibres (calcium chloride anhydrous solution) in a counter-current mode. The calcium chloride anhydrous solution was chosen as osmotic solution because it is non-toxicity, its availability at low cost.
The initial volume of the osmotic solution was 4000 ml in each experimental run, and the calcium chloride anhydrous solution was never substituted during the experimental time. Inlet and outlet pressures of both tube and shell sides, as well as temperature were measured during the concentration
processes. The concentration process was performed under room temperature (23 ºC ± 2 ºC) and
atmospheric pressure.
- 22 -
In a first stage the water flux was measured, keeping constant the Reynolds number on the shell
side (Reshell = 2.16), on which flows deionized water, and varying the Reynolds number on the tube side
(0.2 < Re < 2.8), for different anhydrous calcium chloride solution concentrations.
In a second stage of the experimental work, the focus was the optimization of the hydrodynamics conditions on the shell side optimization. Here the Reynolds number on the fibres side was kept constant
on a value to which the resistance to mass transfer was negligible (Refibres = 0.9) and the water flux was
measured raging the Reynolds number on the shell side (0.1 < Re < 3.8) where a sucrose solution with different concentration circulated.
The concentration of all solutions was measured with a refractometer (Pal-𝛼 pocket, Atago,
Tokyo, Japan) and the water activity was measured with a portable water activity indicator (Hygropalm aw, Rotronic). The concentration of the calcium chloride solution was always confirmed according to density tables described in the literature (annex II), as well as the viscosity and water activity of the sucrose solutions (Occidental Chemical Corporation, 2013; Bui & Nguyen, 2004; Karel, Fennema, & Lund, 1975). The measurement of the density of calcium chloride solutions was determined with a pycnometer.
- 23 -
2.3 Results and Discussion
For the concentration of beverages by the osmotic evaporation process, it is necessary to optimize the hydrodynamic conditions in which the process becomes more efficient, meaning that the contribution of the boundary layers are negligible. For this purpose a series of experiments that enable the study of mass transfer in this process were performed.
2.3.1 Optimization of hydrodynamic conditions on the fibres
The flux values obtained increased with the increase of the calcium chloride solution concentration, as shown on the figure 2.4. This happens due to the increase of the driving force; however, no relation between the flux and the Reynolds number was obtained. Nevertheless, the resistance that might occur in fibres can easily be minimized, by determining the calcium chloride solution concentration that favours that situation.
Figure 2.4 Relation between the calcium chloride anhydrous solution and the water flux for OE experiments.
The overall mass transfer coefficient was calculated using equation 2.5, assuming negligible
temperature polarization effects, which means that P*wt and P*ws were calculated using the average
temperatures of the bulk (calcium chloride solution and water).
Figure 2.5 Overall mass transfer coefficient for the experiments carried out varying the Reynolds number in the fibres, for different CaCl2 solutions (Shell side: deionized water, Re = 2.17). Orange line: membrane mass transfer
coefficient. 0 2 4 6 8 10
0.0 0.5 1.0 1.5 2.0 2.5
Kp (x 10 -11 m s -1Pa -1) Refibres 0.0 0.4 0.8 1.2 1.6 2.0
0 2 4 6 8
F lu x (x 10 -7 m 3m -2s -1)
- 24 -
The results presented in the figure 2.5 show a slight increase of the Kp with the increase of the
Reynolds number until it reaches a plateau. The value of this plateau is very similar to the estimated value of the membrane’s mass transfer coefficient (8.8 x 10⁻¹¹m s-1 Pa-1) by equation 2.6, meaning that
the resistance to the mass transfer on the boundary layers is negligible.
For the determination of the Kmp value there was a need to calculate the membrane´s tortuosity
value, this value may be calculated by (𝜏=1/ε) or (𝜏=(2-ε)2/ε) depending on whether the porous structure
of the membrane is more homogeneous or heterogeneous respectively. In this case, it was concluded
that the membrane is heterogeneous because this is the value that coincides with the Kp obtained
experimentally.
2.3.2 Optimization of hydrodynamic conditions in the shell side of the module
For the study of the more favourable hydrodynamic conditions on the shell side, it was fixed a Reynolds number equal to 0.9 for the calcium chloride solution that circulated inside the fibres value for which the resistance to the mass transfer is negligible. In this experiment, the Reynolds number on the shell side was varied (0.1 < Re < 3.8) through the flow rate variation, as well as the sucrose solution
concentration (10% (w/w); 20% (w/w); 45% (w/w)). The flux and the Kp obtained are represented in
figure 2.6 and 2.7 respectively.
Figure 2.6 Water flux as a function of the Reynolds number in the shell side of the module, for three different sucrose solutions (fibres:CaCl2 (5M), Re = 0.9)
It can be seen in figure 2.6 that exists a more pronounced variation of the flux with the Reynolds number as the sucrose concentration increased. For the 10% (w/w) sucrose solution, small variation was observed meaning that the resistance to the mass transfer on the boundary layer is practically negligible, since the water flux remains almost constant regardless of the Reynolds number value.
0 2 4 6 8 10 12
0 1 2 3 4 5
Fl ux (x 10 -8m 3m -2s -1) Reshell