QUALITY OF SURFACE WATER RELATED TO LAND USE: A
CASE STUDY IN A CATCHMENT WITH SMALL FARMS AND
INTENSIVE VEGETABLE CROP PRODUCTION IN
SOUTHERN BRAZIL
(1)Karina Hacke Ribeiro(2), Nerilde Favaretto(3), Jeferson Dieckow(3), Luiz Cláudio de Paula
Souza(3), Jean Paolo Gomes Minella(4), Luciano de Almeida(3) & Michele Ribeiro Ramos(2)
SUMMARY
Water degradation is strongly related to agricultural activity. The aim of this study was to evaluate the influence of land use and some environmental components on surface water quality in the Campestre catchment, located in Colombo, state of Parana, Brazil. Physical and chemical attributes were analyzed (total nitrogen, ammonium, nitrate, total phosphorus, electrical conductivity, pH, temperature, turbidity, total solids, biological oxygen demand, chemical oxygen demand and dissolved oxygen). Monthly samples of the river water were taken over one year at eight monitoring sites, distributed over three sub-basins. Overall, water quality was worse in the sub-basin with a higher percentage of agriculture, and was also affected by a lower percentage of native forest and permanent preservation area, and a larger drainage area. Water quality was also negatively affected by the presence of agriculture in the riparian zone. In the summer season, probably due to higher rainfall and intensive soil use, a higher concentration of total nitrogen and particulate nitrogen was observed, as well as higher electrical conductivity, pH and turbidity. All attributes, except for total phosphorus, were in compliance with Brazilian Conama Resolution Nº 357/2005 for freshwater class 1. However, it should be noted that these results referred to the base flow and did not represent a discharge condition since most of the water samples were not collected at or near the rainfall event.
Index terms: water pollution, agriculture, nutrients, micro watershed.
(1) Part of the Master's Dissertation of the first author presented to the Graduate Studies Program in Soil Science of the Federal
University of Parana - UFPR. Received for publication on June 6, 2013 and approved on November 11, 2013.
(2) Agronomist, Master's degree in Soil Science, UFPR. Rua dos Funcionários, 1540. CEP 80035-050 Curitiba (PR), Brazil. E-mail:
[email protected], [email protected]
(3) Professor, UFPR. E-mail: [email protected], [email protected], [email protected], [email protected]
(4) Professor, Federal University of Santa Maria. Av. Camobi, 1000. CEP 97105-900 Santa Maria (RS), Brazil. E-mail:
RESUMO:QUALIDADE DA ÁGUA SUPERFICIAL RELACIONADA AO USO DO SOLO: UM ESTUDO DE CASO EM UMA MICROBACIA COM PEQUENAS PROPRIEDADES E PRODUÇÃO INTENSIVA DE VEGETAIS NO SUL DO BRASIL
A degradação dos recursos hídricos está intensamente relacionada à atividade agrícola. O objetivo deste trabalho foi avaliar a influência do uso do solo e de alguns componentes ambientais na qualidade da água superficial na microbacia do rio Campestre, município de Colombo, Paraná. Foram analisados os atributos físicos e químicos (nitrogênio Kjeldahl, amônio, nitrato, fósforo total, turbidez, pH, temperatura, condutividade elétrica, sólidos totais, demanda biológica de oxigênio, demanda química de oxigênio e oxigênio dissolvido). A coleta das amostras de água foi realizada mensalmente por um ano em oito pontos, distribuídos em três sub-bacias. De modo geral, a qualidade da água foi inferior na sub-bacia com maior porcentagem de agricultura, sendo influenciada também pelas porcentagens de floresta, área de preservação permanente com agricultura e área de contribuição da sub-bacia. Na estação de verão, provavelmente em razão da maior precipitação pluvial e do uso do solo, ocorreram as maiores concentrações de N Kjeldahl e N particulado, bem como de condutividade elétrica, pH e turbidez. Todos os atributos analisados, exceto o P total, estavam de acordo com a Resolução Conama nº 357/2005, para água doce de classe 1. No entanto, cabe ressaltar que o monitoramento realizado referiu-se ao escoamento de base e não representou uma condição de descarga, já que a maioria das coletas não foi realizada durante ou próxima do evento de precipitação.
Termos de indexação: poluição da água, agricultura, nutrientes, microbacia.
INTRODUCTION
Increased agricultural production is a reflection of population growth, and this affects water availability and quality (Maxted et al., 2009). The potential of water contamination from agricultural activity is extremely high (Lal & Stewart, 1994), especially in a conventional system with excessive application of fertilizers and pesticides on high slope areas (Manosa et al., 2001; Hart et al., 2004). This potential is even higher during intense rainfall events (Takeda et al., 2009).
Soil use and management, according to their capacity, as well as the adoption of conservation techniques are fundamental for preserving water quality (Zeilhofer et al., 2006; Diebel et al., 2009). Preservation of native vegetation prevents water pollution (Yang & Zang, 2003; Mehaffey et al., 2005; Yang et al., 2007), especially in the riparian zone, which acts as a filter. Eutrophication of rivers and lakes is one of the main problems related to agricultural activity (Sharpley et al., 1994), and the use of mineral and organic fertilizers in agriculture, even though they are essential for plant growth, can become a source of water pollution (Hooda et al., 2000; Hart et al., 2004; Shigaki et al., 2006).
The quality of the water in a catchment is determined by human and environmental factors, as well as their interaction (Ngoye & Machiwa, 2004; Diebel et al., 2009; Takeda et al., 2009). In the Campestre catchment, land use in most of the agricultural areas is in conflict with land capability, mainly due to the shallow soil and steep slopes.
Moreover, almost 50 % of the riparian zone (30 m on each side of the river) is not covered by native vegetation. This environment with intensive production of vegetables under conventional tillage is a potentially significant source of water contamination from soil and water losses with their associated pollutants of nutrients and pesticides.
The aim of this study was to evaluate the influence of land use and environmental components on the quality of the surface water in a catchment with small farms and vegetable production under conventional tillage. The specific objectives were to assess the influence of land use and riparian vegetation on water quality; identify the interference of the size of the sub-basin (drainage area) on water quality; evaluate the effect of the season on water quality; and compare the physical and chemical parameters obtained in the river with Brazilian legislation, as well as with the results from a runoff study.
This research may help to design strategies for integrated planning and management of rural areas for improving and maintaining the quality of natural resources. This is important in ecologically fragile areas subject to inappropriate use.
MATERIALS AND METHODS
Characterization of the study area
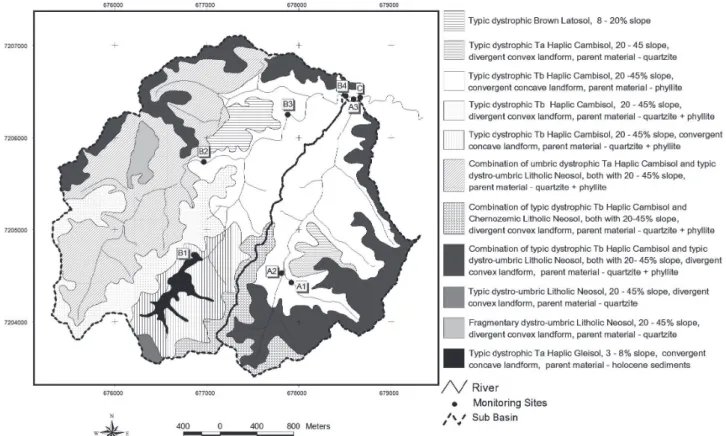
consisted of sampling and analyzing 14 soil profiles from different geographic positions, based on the soil recognition survey of the State of Parana (Embrapa, 1984), and on geology and topography. Soil classification (Embrapa, 2006) resulted in 11 soil units (Figure 1) distributed over a Cambisol (50.4 %), combination of Cambisol + Neosol (41.6 %), Neosol (4.1 %), Latosol (2.6 %) and Gleisol (1.3 %). The physical and chemical attributes of the Haplic Cambisol (two soil profiles) and Litholic Neosol (one soil profile) representing the main soil units [typic dystrophic Tb Haplic Cambisol with phyllite as parent material (34 %) and combinations of dystrophic Haplic Cambisol + typic dystro-umbric Litholic Neosol with phyllite + quartzite as parent material (42 %)] are in table 1. More details can be found in Waltrick (2011).
The climate is classified as Cfb (mesothermal humid subtropical) by Koeppen, with cool summers and no dry season. The average temperature in the coldest month is below 18 oC and in the warmest month is below 22 oC. The average annual rainfall is between 1,400 to 1,600 mm. Two rain gauges were installed near the study area, showing a total rainfall volume of 988 mm during the summer period (growing of summer crops from October 2007 to April 2008) and 180 mm during the winter period (cultivation of winter vegetables from May 2008 to September 2008). The highest rainfall volume was from November 2007 to February 2008 (806 mm).
The drainage network and monitoring sites are shown in figure 2. To determine the land use of each monitoring site (Figure 3 and Table 2), cross-tabulation (Eastman, 1999) was applied. Land use was obtained from Almeida (2003) and revised by field observation. Of the total area (1,010 ha), 44 % is covered by native vegetation (“Floresta Ombrófila Mista”), predominantly characterized by secondary forest at different stages of regeneration; 23 % with reforestation (mainly Mimosa scabrella and
Eucalyptus sp); 19 % with agriculture, predominantly of vegetables, including lettuce (Lactuca sativa L.), broccoli (Brassica oleracea var. Italica Plenck), cauliflower (Brassica oleracea var. Botrytis), squash (Cucurbita pepo L.) beetroot (Beta vulgaris L.), cucumber (Cucumis sativus L.), tomato (Solanum lycopersicum L.), pepper (Capsicum annuum L.) and green beans (Phaseolus vulgaris L.); and 14 % with grassland as pasture for animals or unused. Agriculture, as described earlier, is based on vegetable production characterized by family farming using a conventional system (plowing and harrowing), with heavy application of mineral and organic fertilizers (poultry litter). It is common to use water from streams to irrigate the vegetables. Some farms have adopted an organic system by using organic fertilizer, with tillage consisting predominantly of animal traction. For vegetable production, there is estimated application of 48 Mg ha-1 yr-1 of poultry litter (2.2, 2.4 and 1.7 % of N, P2O5 and K2O, respectively), resulting
Figure 2. Digital elevation model and monitoring sites in the Campestre catchment.
Horizon Depth Sand Silt Clay pH(CaCl2) Ca Mg K Al H+Al CEC P C
cm g kg-1 cmol
c kg
-1 mg kg-1 g kg-1
Typic dystrophic Tb Haplic Cambisol, parent material phyllite, agricultural use
A 0-45 208 380 413 7.0 8,1 4.4 0.83 0.0 1.9 15.2 35.1 40.9
B 45-100 86 802 113 6.7 6.5 3.9 0.28 0.0 1.9 12.6 15.8 21.2
Typic dystrophic Tb Haplic Cambisol, parent material phyllite + quartzite, forest use
A 0-38 197 338 465 4.6 4.0 3.1 0.16 1.0 9.7 17.0 3.2 31.8
B 38-86 223 267 510 4.0 0.6 0.2 0.04 3.8 13.1 14.4 0.7 18.2
Typic dystro-umbric Litholic Neosol, parent material quartzite + phyllite, forest use
A 0-18 273 364 362 4.4 2.4 1.9 0.25 2.4 8.4 13.0 2.4 37.4
Table 1. Particle size distribution and chemical attributes of two soil profiles (Haplic Cambisol and Litholic Neosol) representing the main soils of the Campestre catchment
in 1,056, 1,152 and 816 kg ha-1 yr-1 of N, P
2O5 and K2O by organic fertilization. In the conventional system, organic fertilizer is applied plus 4 Mg ha-1 yr-1 of mineral fertilizer (10-10-10), resulting in the addition of 400 kg ha-1 yr-1 of N, P
2O5 and K2O by mineral fertilization.
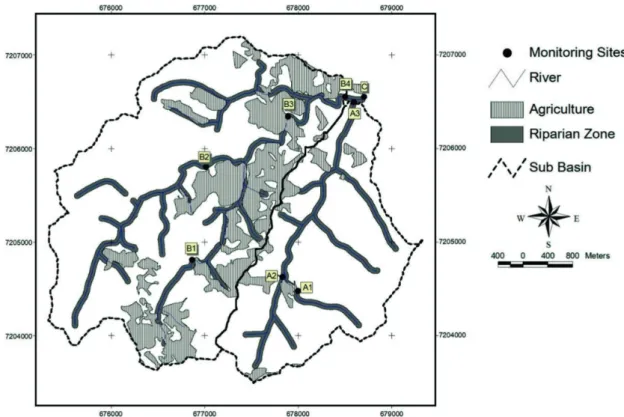
The drainage network in the Campestre catchment should have 30 m on each side covered by native forest, according to Brazilian Legislation (Brasil, 2002). To obtain this riparian zone, the buffer routine from the IDRISI 3.2 software was applied, following Eastman (1999). In the entire catchment, 135 ha should be preserved by law, with native vegetation as the riparian zone; however, 43 % was not (Table 3). Sub-basin A was most protected by riparian vegetation (60 % was covered by native forest and only 6.4 % was used for agriculture). In contrast, 19 % of the riparian vegetation of sub-basin B was used for agriculture (Table 3). Moreover, most of the agricultural production occurs very near the riparian zone (Figure 4).
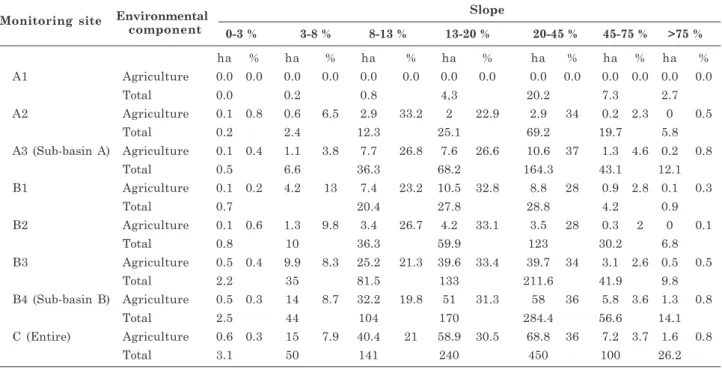
The slope was determined using topographic data (Figure 5) (1:10,000 scale, with contour lines every 5 m in digital media). The predominant slope is 20-45 %, followed by 13-20 % (representing 45 and 24 % of the entire catchment, respectively). Agricultural use in
the entire catchment occurs predominantly in areas of high slopes (41 % of the agriculture in slopes greater than 20 %) (Table 4).
Monitoring sites and sampling
Water from the river was sampled monthly from October 2007 to October 2008 (except January 2008) at eight monitoring sites distributed over the entire catchment (Figure 2). Most of the sampling days were dry days. The water samples were taken manually from the center of the river at a depth of 5 cm at the respective monitoring sites and transported in ice chests to the laboratory for further analysis. All parameters were analyzed in the laboratory except temperature, which was determined in the field.
Water sample analysis
The parameters of pH, electrical conductivity (EC) and turbidity were measured in the laboratory just after sampling. Total solids were determined by drying a 20 mL homogenized aliquot at 105 oC (Bartram & Balance, 1996). Dissolved oxygen (DO) and biological oxygen demand (BOD) were determined by the Winkler method modified by sodium azide (APHA, 1995), and chemical oxygen demand (COD) was determined by potassium dichromate according to the
Monitoring site Area Land use
Native forest Reforestation Agriculture Grassland Other
ha ha % ha % ha % ha % ha %
A1 35 26 74 4 11 0 0 6 17 0 0
A2 134 64 48 37 28 8 6 25 19 2 1.5
A3 (Sub-basin A) 331 164 50 89 27 28 8 48 15 2 0.6
B1 99 42 42 4 4 32 32 21 21 1 1
B2 267 61 23 140 52 13 5 54 20 0 0
B3 515 225 44 82 16 118 23 87 17 2 0.4
B4 (Sub-basin B) 675 274 41 144 21 163 24 90 13 5 0.7
C (Entire) 1010 440 44 234 23 192 19 138 14 6 0.6
Table 2. Land use in the Campestre catchment
Monitoring site Land use in the riparian zone
Native forest Reforestation Agriculture Grassland Other Total
ha % ha % ha % ha % ha % ha
A1 4.5 94 0.0 0 0.0 0 0.3 6 0.0 0 4.8
A2 11.5 70 0.9 6 1.1 7 2.5 15 0.4 3 16.4
A3 (Sub-basin A) 26.6 60 9.9 22 2.9 6 4.5 10 0.4 1 44.3
B1 1.7 20 0.1 0 3.7 42 3.4 39 0.0 0 8.9
B2 20.9 67 2.3 7 1.7 52 6.5 21 0.0 0 31.4
B3 35.3 55 4.2 7 11.9 19 12.73 20 0.0 0 64.1
B4 (Sub-basin B) 49.3 55 10.1 11 16.9 19 12.9 14 0.4 0 89.4
C (Entire) 76.8 57 20.2 15 19.7 15 17.5 13 0.8 1 135.0
open reflux method (APHA, 1995). For nitrogen as ammonium (NH4-N) and nitrogen as nitrate (NO3-N), the samples were filtered with a 0.45 mm ester cellulose membrane. Ammonium-N was determined by the phenol method using spectrophotometry at 640 nm (APHA, 1995), and nitrate-N was determined by
spectrophotometry at 220 nm using metallic zinc to determine the interference (Norman & Stucki, 1981). For total nitrogen (total N) and total phosphorus (total P), samples were digested via the Kjeldahl method (APHA, 1995). Total N (Kjeldahl) was determined by spectrophotometry at 640 nm following the same
method used to determine NH4-N. Total P was determined by spectrophotometry at 880 nm following the ascorbic acid method (APHA, 1995). Total N (Kjeldahl) refers to the soluble NH4-N, as well as N associated with the sediment, either organic or mineral. So, particulate N, which represents the N associated with the sediment, either organic or mineral, was determined by the difference between total N (Kjeldahl) and NH4-N. It is important to explain that NO3-N was not recovered in the total N (Kjeldahl) method (Sharpley & Menzel, 1987), so total N (Kjeldahl) represents only the organic N and the NH4-N fraction.
The results from the watershed were compared with Conama Resolution Nº 357/2005 (Brasil, 2005), Brazilian legislation which establishes the maximum pollutants permitted, taking the uses of water into consideration. Furthermore, the results from the river were compared with the results from the runoff study carried out by Ramos (2009) in the Campestre catchment in large plots.
Statistical analysis
The data were subjected to different analyses. The first analysis was the Kruskal-Wallis H test (Levin, 1999), which examines individual variables and allows us to evaluate the differences in each variable (physical and chemical parameters) between sub-basins (A and B) and seasons (summer and winter), as well as among the monitoring sites in each sub-basin. This is a non-parametric analysis of variance and was chosen because it does not require assumptions of normality and homogeneity. To find the difference between the
sub-basins (A and B), analysis was performed taking the average of the monitoring sites into consideration, as well as considering only the outlet monitoring site of the sub-basin. To check the seasonal differences, two groups were considered: summer (October 2007 to April 2008) and winter (September 2008 to May 2008) using the average of all samples collected for each seasonal period. The second analysis was the Wilks Lambda test, which belongs to multivariate analysis (Johnson & Wichern, 1998). In this case, the variables chosen in the first test were analyzed together by checking the ability of the variables in explaining the variance of the system. The third analysis was multiple regression (Hirsch et al., 1993) to evaluate the relationship between the soil use and environmental components (independent variables) and water quality parameters (dependent variables). The environmental components were the riparian zone, the size of the sub-basin and the distance from the agricultural area to the river. In this analysis, independent variables were related to each dependent variable to try to identify and quantify those that contribute to describing the variability of the dependent variable.
RESULTS AND DISCUSSION
E f f e c t o f s o i l u s e a n d e n v i r o n m e n t a l components
All the parameters, except total solids, were different between sub-basins A and B (Table 5).
Monitoring site Environmental Slope
component 0-3 % 3-8 % 8-13 % 13-20 % 20-45 % 45-75 % >75 %
ha % ha % ha % ha % ha % ha % ha %
A1 Agriculture 0.0 0.0 0.0 0.0 0.0 0.0 0.0 0.0 0.0 0.0 0.0 0.0 0.0 0.0
Total 0.0 0.2 0.8 4,3 20.2 7.3 2.7
A2 Agriculture 0.1 0.8 0.6 6.5 2.9 33.2 2 22.9 2.9 34 0.2 2.3 0 0.5
Total 0.2 2.4 12.3 25.1 69.2 19.7 5.8
A3 (Sub-basin A) Agriculture 0.1 0.4 1.1 3.8 7.7 26.8 7.6 26.6 10.6 37 1.3 4.6 0.2 0.8
Total 0.5 6.6 36.3 68.2 164.3 43.1 12.1
B1 Agriculture 0.1 0.2 4.2 13 7.4 23.2 10.5 32.8 8.8 28 0.9 2.8 0.1 0.3
Total 0.7 20.4 27.8 28.8 4.2 0.9
B2 Agriculture 0.1 0.6 1.3 9.8 3.4 26.7 4.2 33.1 3.5 28 0.3 2 0 0.1
Total 0.8 10 36.3 59.9 123 30.2 6.8
B3 Agriculture 0.5 0.4 9.9 8.3 25.2 21.3 39.6 33.4 39.7 34 3.1 2.6 0.5 0.5
Total 2.2 35 81.5 133 211.6 41.9 9.8
B4 (Sub-basin B) Agriculture 0.5 0.3 14 8.7 32.2 19.8 51 31.3 58 36 5.8 3.6 1.3 0.8
Total 2.5 44 104 170 284.4 56.6 14.1
C (Entire) Agriculture 0.6 0.3 15 7.9 40.4 21 58.9 30.5 68.8 36 7.2 3.7 1.6 0.8
Total 3.1 50 141 240 450 100 26.2
According to multiple regression analysis, the percentage of agricultural land, the percentage of forest (native + reforestation), the percentage of the riparian zone taken up by agriculture, the distance from the agricultural area to the river and the size of the sub-basin had significant effects on most of the parameters (Table 6).
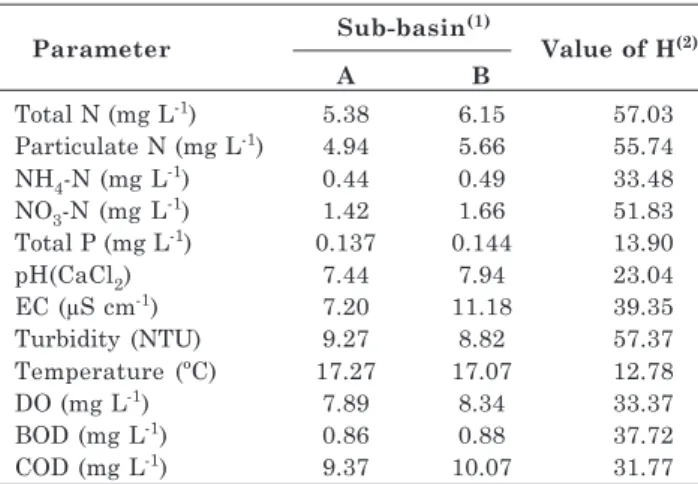
The annual mean concentration of total N (Kjeldahl), particulate N, NH4-N, NO3-N, total P, EC, DBO and COD were higher in sub-basin B (Table 7), indicating lower water quality. This can be explained by the land use components (percentage of agricultural land, percentage of forest) and environmental components (percentage of riparian zone taken up by agriculture, distance from the agricultural area to the river). The land taken up by agriculture in sub-basin B is 24 %, while in sub-sub-basin A it is only 8 % (Table 2). The vegetables are produced most through conventional tillage, adding a heavy amount of fertilizer (1,056; 1,152 and 816 kg ha-1 yr-1 of N, P
2O5 and K2O, respectively, by organic fertilization; and 400 kg ha-1 yr-1 of N, P
2O5 and K2O by mineral fertilization). Additionally, 41 % of the agriculture in sub-basin B is practiced on a slope greater than 20 % on fragile soils. Haplic Cambisol (Cambissolo Háplico) and Litholic Neosol (Neossolo Litólico) are the main soils throughout the watershed (Figure 1), as well as in the agricultural areas (Figure 6). These soils have phyllite and quartzite as parent material and a predominant slope of 20-45 %, defining the very low to moderate depth (20 cm - Litholic Neosol and 62-110 cm - Haplic Cambisol), and loam to clay texture (Table 1). Furthermore, 19 % of the riparian zone in basin B is taken up by agriculture, while in sub-basin A, only 6 % of the riparian zone is taken up by agriculture (Table 3). Moreover, most of the agricultural production occurs very near the river (Figure 4). All this indicates potential for water and
Parameter Sub-basin A × B(1) Sub-basin A × B(2) Sites A1 × A2 × A3 Sites B1 × B2 × B3 × B4
Total N (Kjeldahl) * * * *
Particulate N * * * *
NH4-N * * * *
NO3-N * * * *
Total P * * * ns
pH(CaCl2) * * * *
Total solids ns ns ns ns
EC * * * *
Turbidity * * * ns
Temperature * * ns ns
DO * * * ns
BOD * * * *
COD * * * ns
Table 5. Summary of statistical difference by the Kruskal-Wallis test (5 % probability) in sub-basins on water quality parameters in the Campestre catchment
(1) Analysis performed taking the average of the monitoring sites A1, A2 and A3 for basin A; and B1, B2, B3 and B4 for
sub-basin B; (2) Analysis performed on material from the outlet monitoring site of the sub-basin (A3 × B4). *: statistically different; ns:
not statistically different.
Parameter(1) Adjusted R2 p-level
Total N 0.82 0.025
Particulate N 0.80 0.029
NH4-N 0.68 0.074
NO3-N 0.80 0.032
pH 0.93 0.004
BOD 0.80 0.031
COD 0.62 0.104
Table 6. Summary of regression analysis between dependent variables (parameters) and all independent variables (soil use and environmental components: agricultural area, forest [native + reforestation] area, riparian zone taken up by agriculture, distance from agricultural area to river and size of the sub-basin) in the Campestre catchment
(1) Parameters with differences explained by the soil use and
environmental components at p-level of 0.1.
Parameter Sub-basin
(1)
Value of H(2)
A B
Total N (mg L-1) 5.38 6.15 57.03
Particulate N (mg L-1) 4.94 5.66 55.74
NH4-N (mg L-1) 0.44 0.49 33.48
NO3-N (mg L-1) 1.42 1.66 51.83
Total P (mg L-1) 0.137 0.144 13.90
pH(CaCl2) 7.44 7.94 23.04
EC (µS cm-1) 7.20 11.18 39.35
Turbidity (NTU) 9.27 8.82 57.37
Temperature (ºC) 17.27 17.07 12.78
DO (mg L-1) 7.89 8.34 33.37
BOD (mg L-1) 0.86 0.88 37.72
COD (mg L-1) 9.37 10.07 31.77
Table 7. Annual average concentrations of water quality parameters in the Campestre catchment
(1) Sub-basin A: average of the monitoring sites A1, A2 and A3;
soil losses, as well as associated pollutants. Yang et al. (2007) and Yang & Zhang (2003) observed that the concentration of NH4-N, NO3-N, total N, total P, soluble P and particulate P decreased exponentially with an increase in the area occupied by forest in a catchment of 407 ha monitored weekly for one year in the subtropical region of China. Mehaffey et al. (2005) observed that the percentage of agricultural use and percentage of urban area explained 25 to 75 % of the variation in total N and total P in New York City´s water supply catchments.
The annual average concentration of all parameters is shown in table 7. In it, standard deviation does not indicate a difference between sub-basins. However, comparing the values by a non-parametric analysis, which is more appropriate for the nature of the data since they do not follow a normal distribution, the difference was significant for all parameters, except for total solids (Tables 4 and 5).
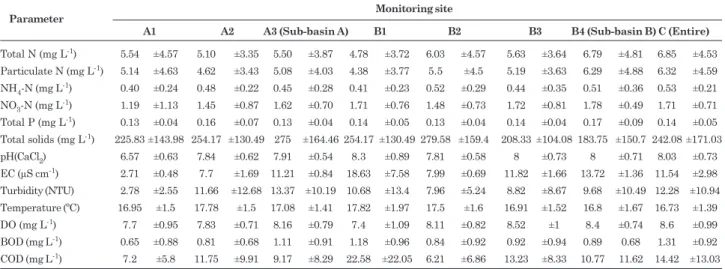
In general, higher values of total N (Kjeldahl), particulate N, NH4-N and NO3-N were observed in the river (Table 8) in monitoring sites with a higher percentage of agriculture, a lower percentage of forest, a higher percentage of the riparian zone taken up by agriculture and a larger drainage area (size of the sub-basin). The higher annual average concentrations of both particulate N and total N (Kjeldahl) were found in monitoring sites C and B4 (Table 8). Monitoring site C represents the entire catchment, and B4 represents the entire sub-basin B. These monitoring sites had the largest size, as well as the highest percentage of agriculture (19 and 24 %, respectively),
and a smaller percentage of the riparian zone occupied by native vegetation (56 and 55 %, respectively). In addition, in both, 71 % of the agricultural area is on greater than 13 % slope (Table 4). Zeilhofer et al. (2006), studying water quality in the Cuibá River Basin, central Brazil, for three years in 21 monitoring sites, observed that total N (Kjeldahl) concentration increased significantly in the sub-basin devoted to intense agricultural land use. However, the total N (Kjeldahl) mean annual concentration (1.74 mg L-1) of that study was much lower than the mean annual value from the Campestre catchment (6.85 mg L-1), which was explained by heavy N fertilization (organic and mineral fertilizers).
In a study involving runoff in large field plots (hillslope) in the Campestre catchment with different vegetable crop production systems, Ramos (2009) obtained total N weighted annual mean concentration in runoff of 30, 27, and 26 mg L-1 for organic, conventional and forest system, respectively. The annual mean concentrations of total N (Kjeldahl) in the river ranged from 4.8 to 6.8 (Table 8) and are much smaller compared to the runoff values (Ramos, 2009). However, most of the sampling days were not after an intense rainfall.
application of manure in the catchment. Furthermore, the transport of sediment to watercourses is enhanced in areas with intensive soil cultivation, especially in steep areas (Manosa et al., 2001; Hart et al., 2004). Ramos (2009), in a runoff field study in the Campestre catchment, also noted that most of total N (more than 70 %) consisted of particulate N (organic N). In contrast, Yang et al. (2007), in a catchment of 407 ha monitored weekly for one year in the subtropical region of China, observed that only 16-30 % of the total N was particulate N. Most of the total N in the study of Yang et al. (2007) consisted of NO3-N (50-60 %). In our study, NH4-N and NO3-N represented only 28 % of the total N (Table 8).
Regarding total P, the same trend as total N (Kjeldahl) was expected; however, differences occurred only between sub-basin A and B and among monitoring sites from sub-basin A (Table 5). There was no difference among the monitoring sites from sub-basin B. One factor that may have contributed to this inconsistency is the dilution effect from rainfall [total P concentrations are much smaller than total N (Kjeldahl) and, thus, more sensitive to the dilution factor]. Another possible explanation is the heavy organic (poultry manure) fertilization affecting much more N losses than P losses. Additionally, P transport from soil to water is highly related to surface runoff, and most sampling days were on dry days.
The weighted annual mean concentration of total P in runoff in the Campestre catchment (Ramos, 2009) was 9.48, 0.92 and 0.30 mg L-1 for the conventional, organic and forest systems, respectively. These values are much higher when compared with the data from the river (0.14 mg L-1 total P, the average of all monitoring sites) (Table 8). This allows us to conclude that the river water has better quality compared to the runoff water (Ramos, 2009) from the hillslope. The large percentage of the catchment occupied by forest (67 % of the catchment has native vegetation +
reforestation) (Figure 3) made a huge contribution to water quality. Again, it is important to note that river water sampling was conducted mostly on days without rainfall, and, possibly, sampling during or just after rainfall would result in higher values.
The lowest values for most of the water quality parameters (NH4-N, NO3-N, total P, EC, turbidity, temperature and BOD) were obtained in monitoring site A1 (Table 8). This is the most protected site (0 % agriculture, 74 % native vegetation and 100 % of the riparian zone preserved by native vegetation) (Figures 3 and 4). There is generally an increase in the concentration of N, P, EC, BOD and COD with an increase in agricultural area; however, this trend is most evident in electrical conductivity. The concentration of ions in water increases with an increase in the percentage of agriculture (Figure 7), characterizing the potential for nutrient transport from soil to water (Hooda et al., 2000).
Conversely, even with a smaller area dedicated to agriculture, sub-basin A showed higher values of turbidity and temperature (Table 5). Higher temperature was probably due to the fact that monitoring sites A2 and A3, though having a higher percentage of forest, were not protected by trees at the sampling point while, in sub-basin B, most of the monitoring sites were under the forest canopy. For turbidity, the major contribution was from monitoring site A2, possibly since it was near a road. However, the turbidity values at all monitoring sites are considered low (Brasil, 2005).
Dissolved oxygen was lower in sub-basin A (Table 5), which could also indicate lower quality (higher levels of organic matter in water); however, the COD and BOD do not confirm this hypothesis. The lower concentration of DO in sub-basin A is possibly due to visually lower turbulence in two of the monitoring sites.
Parameter Monitoring site
A1 A2 A3 (Sub-basin A) B1 B2 B3 B4 (Sub-basin B) C (Entire)
Total N (mg L-1) 5.54 ±4.57 5.10 ±3.35 5.50 ±3.87 4.78 ±3.72 6.03 ±4.57 5.63 ±3.64 6.79 ±4.81 6.85 ±4.53 Particulate N (mg L-1) 5.14 ±4.63 4.62 ±3.43 5.08 ±4.03 4.38 ±3.77 5.5 ±4.5 5.19 ±3.63 6.29 ±4.88 6.32 ±4.59 NH4-N (mg L-1) 0.40 ±0.24 0.48 ±0.22 0.45 ±0.28 0.41 ±0.23 0.52 ±0.29 0.44 ±0.35 0.51 ±0.36 0.53 ±0.21 NO3-N (mg L-1) 1.19 ±1.13 1.45 ±0.87 1.62 ±0.70 1.71 ±0.76 1.48 ±0.73 1.72 ±0.81 1.78 ±0.49 1.71 ±0.71 Total P (mg L-1) 0.13 ±0.04 0.16 ±0.07 0.13 ±0.04 0.14 ±0.05 0.13 ±0.04 0.14 ±0.04 0.17 ±0.09 0.14 ±0.05 Total solids (mg L-1) 225.83 ±143.98 254.17 ±130.49 275 ±164.46 254.17 ±130.49 279.58 ±159.4 208.33 ±104.08 183.75 ±150.7 242.08 ±171.03 pH(CaCl2) 6.57 ±0.63 7.84 ±0.62 7.91 ±0.54 8.3 ±0.89 7.81 ±0.58 8 ±0.73 8 ±0.71 8.03 ±0.73 EC (µS cm-1) 2.71 ±0.48 7.7 ±1.69 11.21 ±0.84 18.63 ±7.58 7.99 ±0.69 11.82 ±1.66 13.72 ±1.36 11.54 ±2.98 Turbidity (NTU) 2.78 ±2.55 11.66 ±12.68 13.37 ±10.19 10.68 ±13.4 7.96 ±5.24 8.82 ±8.67 9.68 ±10.49 12.28 ±10.94 Temperature (ºC) 16.95 ±1.5 17.78 ±1.5 17.08 ±1.41 17.82 ±1.97 17.5 ±1.6 16.91 ±1.52 16.8 ±1.67 16.73 ±1.39 DO (mg L-1) 7.7 ±0.95 7.83 ±0.71 8.16 ±0.79 7.4 ±1.09 8.11 ±0.82 8.52 ±1 8.4 ±0.74 8.6 ±0.99 BOD (mg L-1) 0.65 ±0.88 0.81 ±0.68 1.11 ±0.91 1.18 ±0.96 0.84 ±0.92 0.92 ±0.94 0.89 0.68 1.31 ±0.92 COD (mg L-1) 7.2 ±5.8 11.75 ±9.91 9.17 ±8.29 22.58 ±22.05 6.21 ±6.86 13.23 ±8.33 10.77 11.62 14.42 ±13.03 Table 8. Annual average concentrations (± standard deviation) of water quality parameters in the Campestre
0.0 5.0 10.0 15.0 20.0
0 5 10 15 20 25 30 35
Agriculture, %
EC, µS cm
-1
Figure 7. Relationship between agriculture and annual average concentration of electrical conductivity (EC) in the Campestre catchment. As previously stated, analysis of runoff samples from the Campestre catchment (Ramos, 2009) showed greater losses of water, soil and nutrients compared with the river results. Despite intensive vegetable production in 19 % of the catchment, there is also 67 % of the land covered by forest (44 % native forest and 23 % reforestation), which somewhat enhances water quality in the Campestre catchment. Moreover, the spatial distribution of areas with agriculture surrounded by forest and grassland possibly also reduces the pollution potential of intense vegetable production. Although there are areas with high pollution potential, for example, farmland near the river without riparian zone preservation, there are many other factors that diminish this effect. It is also important to point out that the monitoring in the river refers to a one-year period with only one sampling after a heavy rain.
Effect of the season (summer and winter)
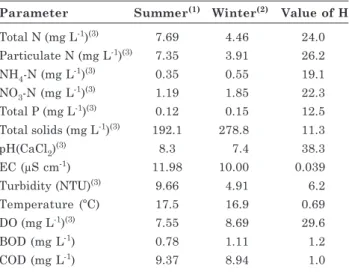
The Kruskal-Wallis test using the average of the monitoring sites showed seasonal differences for total N (Kjeldahl), particulate N, NH4-N, NO3-N, total P, pH, total solids, turbidity and DO (Table 9). Particulate N, NO3-N, total P, DO, BOD, pH, turbidity and total solids explain 76 % of seasonal variation in the catchment considering Wilk Lambda statistical analysis.
The higher concentration of total N (Kjeldahl) and particulate N in summer (Table 9) is presumably due to the increased volume of rainfall, coinciding with a period of increased agricultural land use and, consequently, greater application of organic and mineral fertilizers. Farmers also grow vegetables in the winter, but cultivation is predominant in the summer season. Higher concentrations of nutrients in surface water are usually found in the season with higher rainfall (Ngoye & Machiwa, 2004; Donadio et al., 2005; Takeda et al., 2009); however, the opposite also can be true, explained by the dilution effect from rainfall (Carvalho et al., 2000).
Lower concentration of NH4-N, NO3-N and total P in the summer period (Table 9) was not expected,
Parameter Summer(1) Winter(2) Value of H
Total N (mg L-1)(3) 7.69 4.46 24.0
Particulate N (mg L-1)(3) 7.35 3.91 26.2
NH4-N (mg L-1)(3) 0.35 0.55 19.1
NO3-N (mg L-1)(3) 1.19 1.85 22.3
Total P (mg L-1)(3) 0.12 0.15 12.5
Total solids (mg L-1)(3) 192.1 278.8 11.3
pH(CaCl2)(3) 8.3 7.4 38.3
EC (µS cm-1) 11.98 10.00 0.039
Turbidity (NTU)(3) 9.66 4.91 6.2
Temperature (ºC) 17.5 16.9 0.69
DO (mg L-1)(3) 7.55 8.69 29.6
BOD (mg L-1) 0.78 1.11 1.2
COD (mg L-1) 9.37 8.94 1.0
Table 9. Summer and winter average concentrations of water quality parameters in the Campestre catchment
(1) Summer: average of all monitoring sites from October to
April; (2) Winter: average of all monitoring sites from May to
September; (3) Significant at 5 % probability according to the
Kruskall-Wallis test.
but it may be because of the dilution effect from rainfall. Carvalho et al. (2000) also observed lower concentration of these nutrients in the winter season. As previously described, total P concentrations are much smaller compared with total N (Kjeldahl) and, therefore, dilution may be affecting the results of total P and not the results of total N. Palacio et al. (2009) observed a strong influence of seasonality on surface water quality in a catchment monitored at seven points from January to August. However, it is important to consider that, in the Campestre catchment, most of the sampling days were not after intense rainfall. The results from this study show mainly the effect of subsurface drainage. So, the seasonality effect would not have a significant influence. The study area is head drainage (Figure 2); therefore, the contribution of surface runoff on water quality occurs fundamentally during rainfall events. In a head drainage system, to check the effect of runoff on water quality parameters, water samples should be taken during the rainfall event. The EC is expected to increase in summer (Table 9), due to the increase in fertilizer applications and higher rainfall, which in fact occurred in the Campestre catchment.
Regarding the seasonal effect at each monitoring site verified by the Kruskal-Wallis test (Table 10), there is variation mainly due to the nutrients, pH and DO. According to the Wilk Lambda test (Table 10), these parameters explain more than 83 % of seasonal variation.
Brazilian legislation for quality of surface water
total P does not fit within the maximum values allowed for freshwater class 1 (water used for irrigation of vegetables which are eaten raw). The annual average concentration of total P in the Campestre catchment was 0.14 mg L-1, and the maximum allowed is 0.1 mg L-1. The other parameters (NH4-N, NO3-N, BOD, DO and turbidity) are in accordance with Brazilian legislation. The values allowed for freshwater class 1 are 2 mg L-1 NH4-N in water pH from 7.5 to 8.0, 10 mg L-1 NO3-N, 3 mg L-1 BOD, 6 mg L-1 DO and 40 NTU, and the annual average concentration in the Campestre catchment was 0.47 mg L-1, 1.58 mg L-1, 0.96 mg L-1, 8.06 mg L-1 and 9.7 NTU, respectively.
CONCLUSIONS
1. Water quality was lower in the sub-basin with a higher percentage of agriculture, a lower percentage of forest (native or reforestation), a greater size (drainage area) and a higher percentage of the riparian zone taken up by agriculture.
2. Higher concentrations of total N (Kjeldahl), particulate N, EC, pH and turbidity were obtained in the summer season, probably due to higher rainfall and intensive soil use, although lower concentrations of total P, NH4-N and NO3-N were observed, possibly due to the dilution effect from rainfall.
3. Analysis of runoff samples showed greater losses of water, soil and nutrients compared with the river results; however, it is important to point out that monitoring in the river refers to the base flow (subsurface drainage) and does not represent a condition of intense discharge since most of the sampling days were not on or near a rainfall event.
4. All parameters, except P, were in compliance with Brazilian legislation (Conama Resolution Nº 357/ 2005). The average levels of total P were associated with eutrophic environments in rivers, but excessive growth of aquatic plants was not visible in the river.
LITERATURE CITED
ALMEIDA, L. Mudanças técnicas na agricultura: perspectivas da transição agro-ambiental em Colombo - PR. Curitiba, Universidade Federal do Paraná, 2003. 305p. (Tese de Doutorado)
AMERICAN PUBLIC HEALTH ASSOCIATION - APHA. Standard methods for the examination of water and wastewater. 19.ed. Washington, 1995. 1134p.
BARTRAM, J. & BALANCE, R. Water quality monitoring - A practical guide to the design and implementation of freshwater quality studies and monitoring programs. London, E & FN Spon, 1996. 383p.
BRASIL. Conselho Nacional do Meio Ambiente. Resolução CONAMA nº. 302. Diário Oficial da União de 13/05/2002, Brasília, 2002.
BRASIL. Conselho Nacional do Meio Ambiente. Resolução CONAMA nº. 357. Diário Oficial da União de 17/03/2005. Brasília, 2005.
CARVALHO, A.R., SCHLITTER, F.H.M. & TORNISIELO, V.L. Relações da atividade agropecuária com parâmetros físico químicos da água. Quím. Nova, 23:618-622, 2000. DIEBEL, M.W., MAXTED, J.T., ROBERTSON, D.M., HAN, S.
& ZANDE, M.J.V. Environmental planning for agricultural nonpoint source pollution reduction III: Assessing phosphorus and sediment reduction potential. Environ. Manage., 43:69-83, 2009.
DONADIO, N.M.M.; GALBIATTI, J.A. & PAULA, R.C. Qualidade da água de nascentes com diferentes usos do solo na bacia hidrográfica do Córrego Rico, São Paulo, Brasil. Eng. Agric., 25:115-125, 2005.
EASTMAN, J.R. Guide to GIS and image processing. Worcester, Clark University, 1999. 161p.
EMPRESA BRASILEIRA DE PESQUISA AGROPECUÁRIA -EMBRAPA. Levantamento de reconhecimento do solo do Estado do Paraná. Londrina, 1984. 412p. (Boletim Técnico, 57)
EMPRESA BRASILEIRA DE PESQUISA AGROPECUÁRIA -EMBRAPA. Sistema brasileiro de classificação de solos. 2.ed. Rio de Janeiro, 2006. 306p.
Monitoring site Kruskall-Wallis Test Wilk Lambda Test - Significant - Significant parameter parameter and contribution
%
A1 Total P, pH and DO pH, COD, BOD and Particulate N 94
A2 NH4-N, pH and DO pH, TºC, COD, total N and Total solids 90
A3 (Sub-basin A) Total N and Particulate N Particulate N, DO, NO3-N and EC 95
B1 pH and DO DO and TºC 88
B2 NH4-N, pH and DO pH, N particulate and DO 83
B3 Total N, particulate N, Total P and pH pH, Total solids, TºC and COD 89
B4 (Sub-basin B) COD, DO and Total solids DO, NO3-N, EC, NH4-N and Particulate N 99 C (Entire) Particulate N, NO3-N and pH pH, particulate N, EC, TºC, total N Kjeldhal and Total P 100 Table 10. Seasonal difference for the Kruskall-Wallis and Wilk Lambda tests for each monitoring site in the
HART, M.H.; QUIN, B.F. & NGUYEN, M.L. Phosphorus from agricultural land and direct fertilizer effects: a review. J. Environ. Qual., 33:1954-1972, 2004.
HATCH, D.; GOULDING, K. & MURPHY, D. Nitrogen. In: HAYGARTH, P.M. & JARVIS, S.C., eds. Agriculture, hydrology and water quality. Cambridge, CABI Publishing, 2002. p.7-27.
HIRSCH, R.M.; HELSEL, D.R.; COHN, T.A. & GILROY, E.J. Statistical analysis of hydrologic data. In: MAIDMENT, D.R., ed. Handbook of hydrology. New York, McGraw-Hill, 1993. p.171-175.
HOODA, P.S.; EDWARDS, A.C.; ANDERSON, H.A. & MILLER, A. A review of water quality concerns in livestock farming areas. Sci. Total Environ., 250:143-147, 2000.
JOHNSON, R.A. & WICHERN, D.W. Applied multivariate statistical analysis. 4.ed. Upper Saddle River, Prentice-Hall, 1998. 816p.
LAL, R. &. STEWART, B.A. Soil process and water quality. In: LAL, R. & STEWART, B.A., eds. Soil processes and water quality. Boca Raton, CRC Press, 1994. p. 1-6 LEVIN, I.P. Relating statistics and experimental design.
Thousand Oaks, Sage, 1999. 90p.
MANOSA, S.; MATEO, S. & GUITAR, R. A review of the effects of agricultural and industrial contamination on the Ebro Delta biota and wildlife. Sci. Total Environ., 71:187-205, 2001.
MAXTED, J.T.; DIEBEL, M.W. & ZANDEN, M.J.V. Environmental planning for agricultural non-point source pollution reduction. II. Balancing watershed size, number of watersheds, and implementation effort. Environ. Manage., 43:60-68, 2009.
MEHAFFEY, M.H.; NASH, M.S.; WADE, T.G.; EBERT, D.W.; JONES, K.B. & RAGER, A. Linking land cover and water quality in New York City’s water supply watersheds. Environ. Monit. Assess., 107:29-44, 2005. NGOYE, E. & MACHIWA, J. The influence of land-use
patterns in the Ruvu river watershed on water quality in the river system. Phys. Chem. Earth, 29:1161-1166, 2004.
NORMAN, R.J. & STUCKI, J.W. The determination of nitrate and nitrite in soils extracts by ultraviolet spectrophotometry. Soil Sci. Soc. Am. J., 45:347-353, 1981. PALACIO, H.; ANDRADE, E.M.; LOPES, F.B.; ALEXANDER, D.M.B. & ARRAES, F.D.D. Similaridade da qualidade das águas superficiais na bacia do Curu, Ceará. Ci. Rural, 39:2494-2500, 2009.
RAMOS, M.R. Atributos físicos e perda de solo, água e nutrientes em encostas sob sistema de produção de hortaliças convencional e orgânico. Curitiba, Universidade Federal do Paraná, 2009. 78p. (Dissertação de Mestrado) SHARPLEY, A.N. & MENZEL, R.G. The impact of soil and fertilizer phosphorus on the environment. Adv. Agron., 41:297-324, 1987.
SHARPLEY, A.N.; CHAPRA, S.C.; WEDEPOHL, R.; SIMS, J.T.; DANIEL, T.C. & REDDY, K.R. Managing agricultural phosphorus for protection of surface waters: Issues and options. Environ. Qual., 23:437-451, 1994.
SHIGAKI, F.; SHARPLEY, A.N. & PROCHNOW, L.I. Animal based agriculture, phosphorus management and water quality in Brazil: Options for the future. Sci. Agric., 63:194-209, 2006.
TAKEDA, I.; FUKUSHIMA, A. & SOMURA, H. Long-term trends in water quality in an under-populated watershed and influence of precipitation. Water Environ. Technol., 7:293-306, 2009.
WALTRICK, J.C.N. Aplicação da metodologia P-index na bacia hidrográfica do campestre-Colombo, PR. Curitiba, Universidade Federal do Paraná, 2011. 97p. (Dissertação de Mestrado)
YANG, J. & ZHANG, G. Quantitative relationship between land use and phosphorus discharge in subtropical hilly regions of China. Pedosphere, 13:67-74, 2003.
YANG, J.; ZHANG, G. & ZHAO, Y. Land use impact on nitrogen discharge by stream: A case study in subtropical hilly region of China. Nutr. Cycl. Agroecosyst., 77:29-38, 2007.