Digestibility, growth, blood chemistry, and enzyme activity of juvenile
Oreochromis niloticus
fed isocaloric diets containing animal and plant
byproducts
Magnolia Montoya-Mejía1, Manuel García-Ulloa1, Alfredo Hernández-Llamas2, Hector
Nolasco-Soria2, Hervey Rodríguez-González1*
1 Instituto Politécnico Nacional, Centro Interdisciplinario de Investigación para el Desarrollo Integral Regional, Departamento de Acuacultura,
Guasave, Sinaloa, Mexico.
2 Centro de Investigaciones Biologicas del Noroeste, La Paz, Baja California Sur, Mexico.
ABSTRACT - In this work, we studied the digestibility, growth, blood chemistry, and enzyme activity of Nile tilapia (Oreochromis niloticus) juveniles (0.95±0.18 g) using different animal (fish silage meal, whey meal, bovine blood meal, and red crab meal) and plant (extruded bean, extruded chickpea meal, coconut paste, Jatropha curcas meal, and chickpea meal) dietary byproducts. Nine isocaloric diets (321.92±9.10 kcal g−1) were evaluated for 60 days. The highest digestibility of crude
protein values for animal and plant sources were obtained for the whey (93.6) and extruded bean meal (90.5) diets, respectively. The final body weight was higher for the red crab and extruded chickpea meal diets, meanwhile the fish silage and red crab byproducts obtained the highest protein efficiency ratio. Hematocrit was similar among the diets of each byproduct source and presented correlation with growth parameters. The highest glucose, cholesterol, and triglyceride values were obtained for fish silage (138.0, 260.5, and 389.0 mg dL−1, respectively) and whey meal (174.5, 242.3, and 284.0 mg dL−1, respectively) groups. A
positive correlation was found between the digestibility of crude protein of ingredients and chymotrypsin activity. Oreochromis niloticus is able to better utilize fish silage, whey, extruded bean, and extruded chickpea byproducts, adjusting its digestive physiology. Such ingredients can be used for formulating cheaper and efficient tilapia diets.
Key Words: alternative byproducts, digestive response, formulated diets, growth performance, Nile tilapia, physiology © 2017 Sociedade Brasileira de Zootecnia
ISSN 1806-9290 www.sbz.org.br
R. Bras. Zootec., 46(12):873-882, 2017
Received: August 29, 2016
Accepted: July 27, 2017
*Corresponding author: hervey23@hotmail.com http://dx.doi.org/10.1590/S1806-92902017001200001
How to cite: Montoya-Mejía, M.; García-Ulloa, M.; Hernández-Llamas, A.; Nolasco-Soria, H. and Rodríguez-González, H. 2017. Digestibility, growth, blood chemistry, and enzyme activity of juvenile Oreochromis niloticus fed isocaloric diets containing animal and plant byproducts. Revista Brasileira de Zootecnia 46(12):873-882. Copyright © 2017 Sociedade Brasileira de Zootecnia. This is an Open Access article distributed under the terms of the Creative Commons Attribution License (http://creativecommons.org/licenses/by/4.0/), which permits unrestricted use, distribution, and reproduction in any medium, provided the original work is properly cited.
Introduction
Nutritional studies on tilapia aquaculture are still needed to reduce the high costs generated by feeding and to optimize food utilization for achieving the better growth performance of fish. For the latter, parameters such as weight gain, growth, and survival (García-Ulloa et al., 2013) among others are commonly related to food source, content, biochemical composition of ingredients and diets (Job et al., 2015), and dietary energy balance, which are utilized as evaluation tools to properly interpret fish performance by a given diet or ingredient. There are other valuable biological tracers that are used to explain
the growth responses of tilapia. It is possible to argue that most reports include partial information, since only few indicators are applied when evaluating nutritional items for tilapia.
Variations in the quality and quantity of dietary nutrients influence digestibility, growth performance, body biochemical composition, hematocrit, and enzyme activity in fish (Lundstedt et al., 2004). Thus, the acquisition, digestion, and assimilation of food on growth and survival of tilapia involve digestive processes in which many components play a very important role. For instance, the configuration of the intestine provides an advantage to Nile tilapia in digestion and absorption of nutrients when a less energy-efficient herbivorous diet is used (Tengjaroenkul et al., 2000), in which enzymes, chemicals, and proximal components directly affect its growth responses. This way, the dietary inclusion of ingredients validated by the interaction of several digestive indexes may offer physiological advantage in knowing the nutritional requirements and biological responses of tilapia.
mainly dealing with tilapia growth and feed efficiency. The study of physiological and growth parameters to evaluate feed efficiency of alternative dietary ingredients represents a basis to develop feed formulation suitable for tilapia, so that cost-effectiveness can be obtained. Therefore, the objective of this study was to investigate the digestive physiology, blood chemistry, and growth responses of O. niloticus juveniles fed isocaloric diets containing different animal and vegetable byproducts.
Material and Methods
The ingredients were milled (Grindmaster™, Model 505, Louisville, KY, USA) and sieved (250 µm; no. 60, FIIC, S.A. de C.V., México) to be added to the diets.
Fish silage was prepared from tilapia (O. niloticus) byproducts. Tissues were minced (Torrey®, M-22RW),
placed in plastic bags, and frozen (at −20 °C) until use. Fish silage was prepared in 5-L plastic containers adding 1 kg of fish byproduct and 15 mL of formic acid to obtain a final pH of 3.8-4.0. Following Fagbenro and Jauncey (1993), fish silage was incubated at 29±1 °C under anaerobic conditions for seven days and dried in a draft oven at 60 °C for 24 h. Whey meal was obtained from fresh whey cow milk by boiling treatment (15 min). Centrifugation was used to remove fat and lactic acid was added to allow protein precipitation, which was recovered using cold filtration with a cotton blanket. Paste was finally dried at 60 °C for 72 h. Bovine blood meal was prepared using blood from the municipal slaughterhouse of Tangancícuaro, Michoacán. Blood was sun-dried for five days and covered with a plastic mesh. Red crab meal was obtained from fresh red crab (Pleuronectes planipes) and processed in Matancitas, Baja California Sur, Mexico.
Extruded bean meal was prepared from complete beans (Phaseolus vulgaris) that were soaked for 1 h to remove the cuticle and humidified for 24 h at 26% before extrusion. Chickpea (Cicer arietinum) was used either complete or extruded; the latest was prepared by 24-h extrusion of
humidified meal (26% humidity) (20DN extruder, CW Brabender® Instruments, Inc, NJ, USA). Jatropha curcas
meal was obtained using a mechanical press (Grima-Biodiesel™, DF, Mexico) for seed breaking (Hydraulic press Komet® DD85) and dehulling. A proportion of 1.5/10 p/v of
hexane was mixed with the meal for oil extraction, then the meal was filtered, sun-dried, and stored at 4 °C. Coconut paste was prepared with coconut fruit given by Copreros Unidos por Tabasco S. de P.R. de R.L., Mexico, then ground at 200 μm.
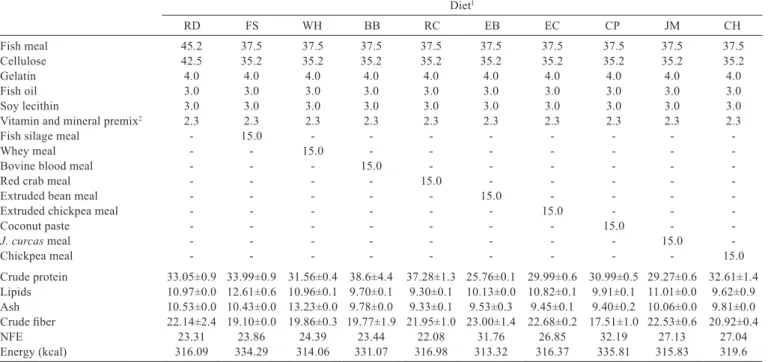
A reference diet (RD) was formulated with 316.09 kcal g−1
to meet or exceed the nutrient requirements for Nile tilapia (NRC, 1993). Nine isocaloric (321.92±9.10 kcal g−1; Shiau
and Huang, 1990) diets (fish silage, whey, bovine blood, red crab, extruded bean, extruded chickpea, coconut, Jathropa curcas, and chickpea meals) were prepared containing 85% of RD and 15% of the tested ingredient. All diets were extruded (C.W. Brabender® Instruments, Inc.) and dried at
45 °C to reduce humidity below 10%. For the digestibility assays (Cho and Slinger, 1979), 30% of each tested ingredient was included in the RD and chromic oxide (1%) was used as inert marker (Cruz-Suárez et al., 2009).
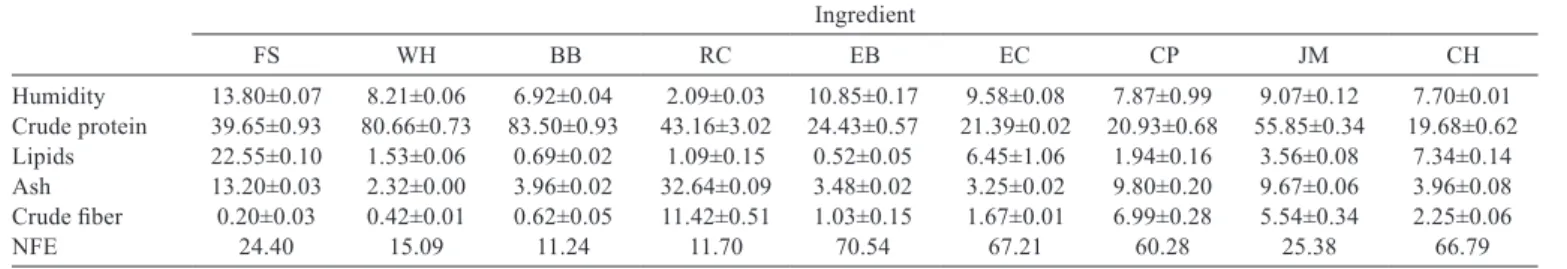
Proximate chemical composition of ingredients and diets was analyzed according to AOAC (1995) protocol (Tables 1 and 2).
In vivo digestibility assays with the experimental diets were previously practiced. Fifty 50-L plastic tanks covered with plastic mesh were used for the in vivo digestibility test. Water temperature and dissolved oxygen were maintained at 27±1 °C and >4 mg L−1, respectively. Photoperiod
was adjusted at 14 h light and 10 h darkness. Five fish (51.1±11.6 g) per diet were placed in each experimental unit to evaluate in vivo digestibility. Each diet was tested with five replicates. Experimental diets were offered for seven days before starting the assays; thereafter, fish were daily fed to apparent satiation at 08:00 and 16:00 h. Feces were manually collected from each tank 3 h after feeding using a siphon (Jones and De Silva, 1997), then washed, lyophilized, and stored at −70 °C.
Table 1 - Proximal composition (g kg−1) of ingredients used in diets for O. niloticus
Ingredient
FS WH BB RC EB EC CP JM CH
Humidity 13.80±0.07 8.21±0.06 6.92±0.04 2.09±0.03 10.85±0.17 9.58±0.08 7.87±0.99 9.07±0.12 7.70±0.01 Crude protein 39.65±0.93 80.66±0.73 83.50±0.93 43.16±3.02 24.43±0.57 21.39±0.02 20.93±0.68 55.85±0.34 19.68±0.62 Lipids 22.55±0.10 1.53±0.06 0.69±0.02 1.09±0.15 0.52±0.05 6.45±1.06 1.94±0.16 3.56±0.08 7.34±0.14 Ash 13.20±0.03 2.32±0.00 3.96±0.02 32.64±0.09 3.48±0.02 3.25±0.02 9.80±0.20 9.67±0.06 3.96±0.08 Crude fiber 0.20±0.03 0.42±0.01 0.62±0.05 11.42±0.51 1.03±0.15 1.67±0.01 6.99±0.28 5.54±0.34 2.25±0.06
NFE 24.40 15.09 11.24 11.70 70.54 67.21 60.28 25.38 66.79
Analysis of protein and chromic oxide content in feces were performed according to AOAC (1995) and Furukawa and Tsukahara (1966), respectively. The apparent digestibility coefficient for dry matter (ADCDM)
and protein (ADCCP) were calculated according to the equations described by Maynard et al. (1981). Dry matter (ADCIDM) and protein (ADCICP) digestibility of ingredients were determined according to Cho and Slinger (1979).
The growth trial was conducted in 180-L rectangular plastic tanks (80 × 58 × 58 cm) for 60 days. Five juveniles (0.98±0.3 g) per tank were stocked at 18.6 juvenile m−3
using four replicates per treatment. Fish were daily fed at 10% of total biomass divided in three rations (10:00, 14:00, and 18:00 h) and feed ration was gradually reduced to 4% of total biomass at the end of the trial. The experimental tanks were cleaned every week and 50% water was renewed. Water temperature (28±1 °C) and dissolved oxygen (≥4 mg L−1) were obtained using
an oxygen meter (YSI 55); nitrogenous compounds (ammonium = 0.044±1.2 mg L−1, nitrites = 0.022±0.004 mg L−1,
and nitrates = 0.268±0.004 mg L−1) were obtained with the
method proposed by Strickland and Parsons (1972). All parameters were monitored on a daily basis.
Body weight (BW) and total length (TL) of tilapia were measured each ten days using a ±0.01-g precision digital balance (Ohaus®, Parsippany, NJ, USA) and a vernier
caliper (0.00 mm), respectively. The specific growth rate (SGR) was calculated using:
SGR = [(In (final weight) – In (initial weight))/cultivation days] After 60 days, the totality of surviving organisms from each replicate tank was used for calculation of feed efficiency, somatic indexes, blood, and digestive enzymes analyzes, and for determination of body chemical composition.
Feed utilization was calculated using standard formulas:
Weight gain (WG) = (final weight – initial weight) Feed conversion ratio (FCR) = [feed intake (g on dry weight basis)/body weight gain (g, wet weight basis)] Feed efficiency ratio (FER) = [WG / feed intake (g on dry
weight basis)] × 100
Protein efficiency ratio (PER) = [net weight gain (g, wet weight basis)/protein fed (g, dry matter basis)]. Four fish per diet were analyzed to determine the hepatosomatic (HSI) and intestinal somatic indexes (ISI) using the following formulas:
HSI (%) = [wet weight of liver (g)/wet weight to fish (g)] × 100
ISI (%) = [wet weight of intestine (g)/wet weight to fish (g)] × 100
Table 2 - Formulation of experimental diets for O. niloticus (g kg−1 dry matter)
Diet1
RD FS WH BB RC EB EC CP JM CH
Fish meal 45.2 37.5 37.5 37.5 37.5 37.5 37.5 37.5 37.5 37.5
Cellulose 42.5 35.2 35.2 35.2 35.2 35.2 35.2 35.2 35.2 35.2
Gelatin 4.0 4.0 4.0 4.0 4.0 4.0 4.0 4.0 4.0 4.0
Fish oil 3.0 3.0 3.0 3.0 3.0 3.0 3.0 3.0 3.0 3.0
Soy lecithin 3.0 3.0 3.0 3.0 3.0 3.0 3.0 3.0 3.0 3.0
Vitamin and mineral premix2 2.3 2.3 2.3 2.3 2.3 2.3 2.3 2.3 2.3 2.3
Fish silage meal - 15.0 - - -
-Whey meal - - 15.0 - - -
-Bovine blood meal - - - 15.0 - - -
-Red crab meal - - - - 15.0 - - - -
-Extruded bean meal - - - 15.0 - - -
-Extruded chickpea meal - - - 15.0 - -
-Coconut paste - - - 15.0 -
-J.curcas meal - - - 15.0
-Chickpea meal - - - 15.0
Crude protein 33.05±0.9 33.99±0.9 31.56±0.4 38.6±4.4 37.28±1.3 25.76±0.1 29.99±0.6 30.99±0.5 29.27±0.6 32.61±1.4 Lipids 10.97±0.0 12.61±0.6 10.96±0.1 9.70±0.1 9.30±0.1 10.13±0.0 10.82±0.1 9.91±0.1 11.01±0.0 9.62±0.9 Ash 10.53±0.0 10.43±0.0 13.23±0.0 9.78±0.0 9.33±0.1 9.53±0.3 9.45±0.1 9.40±0.2 10.06±0.0 9.81±0.0 Crude fiber 22.14±2.4 19.10±0.0 19.86±0.3 19.77±1.9 21.95±1.0 23.00±1.4 22.68±0.2 17.51±1.0 22.53±0.6 20.92±0.4
NFE 23.31 23.86 24.39 23.44 22.08 31.76 26.85 32.19 27.13 27.04
Energy (kcal) 316.09 334.29 314.06 331.07 316.98 313.32 316.37 335.81 315.83 319.6
NFE - nitrogen-free extract.
1 Diets: RD - reference diet; FS - 15% of fish silage meal; WH - 15% of whey meal; BB - 15% of bovine blood meal; RC - 15% of red crab meal; EB - 15% of extruded bean meal;
EC - 15% of extruded chickpea meal; CP - 15% of coconut paste; JM - 15% of J. curcas meal; and CH - 15% of chickpea meal.
2 Vitamin and mineral premix contains (g kg−1 feed): thiamin, 0.011; folic acid, 0.005; riboflavin, 0.02; piridoxin, 0.011; colin, 0.275; pantothenic acid, 0.0035; niacin, 0.088;
Tilapia blood was collected from the caudal venous (n = 4 per diet) after 12 h of starving utilizing a 3-mL syringe and BD vacutainer® tubes with heparin
as anticoagulant. Hematocrit (HEM) was determined according to Goldenfarb et al. (1971). Glucose (GLU), total cholesterol (TCH), and triglycerides (TG) were determined in agreement with Henry et al. (1974), Ellefson and Caraway (1976), and McGowan et al. (1983), respectively.
Tilapia (n = 4 per diet) was starved for 24 h and sacrificed to obtain enzyme extracts from the intestine. Every tissue was homogenized (Potter PRO 250®) in three
mL of cold distilled water (4 °C) per g of tissue (1:3 w/v). All samples were kept in ice during the process to avoid enzyme denaturation and/or damage. The homogenate was centrifuged (Eppendorf® 5810R) twice for 10 min
at 15,294 × g and 4 °C to remove the insoluble tissue material. The floating lipid fraction was removed and the aqueous supernatant was recovered and keep at −20 °C until use. This fraction was considered a crude extract (Vega-Villasante et al., 1999). Thereafter, the supernatant was taken as enzyme crude extract (CE) and kept at −20 °C until enzyme analysis.
Alkaline protease activity of the samples was determined according to García-Carreño (1992), using azocasein (2.0% Tris-HCl 100 mM, pH 9) as substrate. For controls, the crude extract was applied after stopping the reaction with the TCA reagent. One unit of alkaline protease activity was defined as the amount of enzyme required to increase 0.01 unit Abs min−1. Trypsin activity was determined
following the method described by Erlanger et al. (1961) with slight modifications using N-α-Benzoyl-DL-arginine hydrochloride 4-nitroanilide (BAPNA) as substrate. For controls, the crude extract was inactivated (treated in water bath at 95 °C for 5 min). The absorbance (405 nm) was measured every 15 s for 30 min. One unit of trypsin activity was defined as the enzyme required to release 1 μMol of p-nitroaniline per min. Chymotrypsin activity of the samples was determined according to DelMar et al. (1979), with slight modifications as previously described for the trypsin method, using N-Succinyl-Ala-Ala-Pro-Phe p-nitroanilide (SAAPNA) as a substrate and Tris-HCl 60 mM pH 8 and CaCl2 pH 8. For control, the crude extract was inactivated (treated in water bath at 95 °C for 5 min). One unit of chymotrypsin activity was defined as the enzyme required to release 1 μMol of 4-nitroanilide per minute.
Amylase activity was determined according to Vega-Villasante et al. (1993), using starch solution (1% Tris HCl, 100 mM, pH 8) as substrate. For controls, the crude extract was applied after adding DNS reagent. One unit of amylase
activity was defined as the enzyme required for release of 1 μMol of glucose per minute.
Lipase activity was determined according to Versaw et al. (1989), with β-naphthyl caprylate as substrate (100 mM in DMSO). One unit of lipase activity was defined as the enzyme required to release 1 μMol of β-naftol per minute. The activity of proteases, amylases, and lipases are expressed as the number of units of enzyme per organism (total units, TU).
The totality of live fish was analyzed for body composition on a wet weight basis. Crude protein was determined using the Kjeldahl method, crude fiber was determined by sequential extraction of a defatted sample with 1.25% H2SO4 and 1.25% NaOH, ash was determined with a muffle furnace (AOAC, 1995), and lipid content was extracted with anhydrous ether in an extraction system (Soxtec Avanti 2050, Foss Tecator®, Copenhagen, Denmark)
(Bligh and Dyer, 1959).
Data were separately analyzed for diets containing animal or plant byproducts. Normality and homoscedasticity were analyzed using the Lilliefor’s and Bartlett’s tests (Sokal and Rohlf, 1995). One-way ANOVA and Tukey’s multiple range tests were used to detect differences in mean values among tested diets and ingredients. Regression analyzes were performed between digestive parameters and growth responses (Software Statistica 7.0, Statsoft, Tulsa, Oklahoma). Significance was set at P<0.05 for all analyzes.
Results
The mean values of ADC for dry matter and ingredients showed significant differences (P<0.05) among byproduct groups (Table 3).
In diets containing animal byproducts, the higher mean values for ADCDM and ADCCP (P<0.05) were obtained for
RD (83.7 and 93.0, respectively), being similar to those observed for fish silage (78.9 and 92.2, respectively) and whey meal (78.8 and 93.6, respectively). Likewise, fish silage and whey meal were the most digested ingredients for ADCIDM (79.7 and 80.4, respectively) and ADCICP (82.6
and 89.3, respectively). For the plant byproduct diets, the higher ADCDM and ADCCP values were also showed by the
RD group (P<0.05), being comparable with the extruded bean meal (78.9 and 90.5, respectively) diet. Coefficients of ADCIDM and ADCICP for plant byproducts were different
(P<0.05), fluctuating from 67.8, found for extruded bean meal, to 84.4, obtained for the coconut paste diet.
byproducts. The highest FBW were obtained for the red crab (23.30 g) and extruded chickpea meal (23.60 g) groups (Table 4). Protein efficiency ratio for the animal byproducts fluctuated from 1.9, for fish silage and red crab meal groups, to 1.5 found for the bovine blood meal treatment (P<0.05). The rest of growth parameters were similar among each byproduct group.
There were no significant differences (P<0.05) in mean values of HEM among all the diets, while GLU, TCH, and TG varied significantly (Table 5). For the animal
byproduct diets, concentrations of GLU and TG in blood were significantly higher for the fish silage (138.0 and 389.0 mg dL−1, respectively) and whey meal (174.5 and
284.0 mg dL−1, respectively) diets. For the plant byproducts,
GLU concentration was significantly higher when using the Jatrhopa curcas meal diet (130.3 mg dL−1). The
coconut paste diet resulted in significantly higher TCH concentration (254.0 mg dL−1) compared with the complete
chickpea diet (182.0 mg dL−1). The coconut paste diet also
registered the highest TG concentration (304.0 mg dL−1).
There were significant differences (P<0.05) in enzyme activity among all the diets (Table 6). For the animal byproducts, the fish silage group presented the highest enzyme activity (protease = 171.3 TU, trypsin = 20806.6 TU, chymotrypsin = 128509.7 TU, amylase = 116.5 TU, and lipase = 19.0 TU). In the case of the plant byproduct diets (Table 6), the coconut paste group displayed the highest values for trypsin (16381.3 TU) and lipase (32.0 TU), and extruded bean meal for protease, chymotrypsin, and amylase (146.5, 144202.8, and 131.0 TU, respectively).
Crude protein was similar (58.46±0.59 g kg−1) (P<0.05),
but lipids and carbohydrates presented significance (P<0.05) among the tested diets. The mean overall concentration of lipids (20.31 g kg−1) found for the experimental groups was
higher than that for RD (15.5 g kg−1) (Table 7).
A positive correlation was found between the ADCICP
and chymotrypsin activity (r = 0.57; P = 0.003). The activity of chymotrypsin increased when the PER was higher. The HEM presented correlations with FBW (r = 0.49; P = 0.013), TL (r = 0.58; P = 0.003), WG (r = 0.49; P = 0.013), FCR (r = 0.59; P = 0.002), FER (r = 0.59; P = 0.002), and PER (r = 0.51; P = 0.009) (Table 8).
Table 3 - Apparent digestibility coefficients of dry matter (ADCDM)
and protein (ADCCP) and ingredients of dry matter (ADCIDM) and protein (ADCICP) of experimental diets
for O. niloticus
Diet1 ADC
DM ADCIDM ADCCP ADCICP
Animal byproduct
FS 78.9±5.1ab 79.7±5.9a 92.2±1.6a 82.6±5.5a WH 78.8±6.8ab 80.4±13.4a 93.6±1.0a 89.3±2.2a BB 72.9±5.9b 50.3±17.5b 74.6±5.1c 47.1±9.4b RC 62.9±7.8c 28.7±8.6c 83.9±1.6b 25.2±4.7c
RD 83.7±3.9a 93.0±2.0a
P-value <0.001 <0.001 <0.001 <0.001 Plant byproduct
EB 78.9±4.8a 67.8±16.1a 90.5±1.7ab 69.6±8.8c EC 78.1±1.1ab 64.8±3.8a 90.5±0.8ab 92.0±4.8a CP 71.3±5.4cd 53.0±9.7ab 90.4±2.4b 84.4±14.4ab JM 73.0±1.7bc 47.9±5.6b 87.9±0.7bc 37.7±2.0d CH 66.6±4.7d 33.2±10.3c 86.9±2.3c 75.2±13.6bc
RD 83.7±3.9a 93.0±2.0a
P-value <0.001 <0.001 <0.001 <0.001 1 Diets (30% of ingredients were used in all diets): RD - reference diet; FS - fish
silage; WH - whey meal; BB - bovine blood meal; RC - red crab meal; EB - extruded bean meal; EC - extruded chickpea meal; CP - coconut paste; JM - J. curcas
meal; CH - chickpea meal.
Means in the same column with different letters are significantly different (P<0.05).
Table 4 - Growth parameters, feed efficiency, and somatic indexes of tilapia fed diets containing animal and plant byproducts
Diet IBW (g) FBW (g) TL (cm) SGR WG (g) FCR FER PER HSI ISI
Animal byproduct
FS 0.8±0.1 19.3±4.0bc 11.4±1.1 4.8±0.1 92.3±19.7 1.6±0.0 61.2±0.8 1.9±0.0a 2.4±0.2 5.4±0.5 WH 0.8±0.2 22.2±3.7ab 10.7±1.4 5.0±0.2 107.2±17.9 1.7±0.1 58.9±4.6 1.7±0.1ab 2.9±0.7 5.5±0.3 BB 1.1±0.1 19.5±3.9bc 10.5±0.8 4.3±0.4 91.9±19.4 1.9±0.1 52.2±3.6 1.5±0.1c 2.4±0.4 5.1±1.5 RC 0.9±0.3 23.3±1.1a 11.7±0.3 4.8±0.4 111.6±5.6 1.8±0.2 57.2±6.7 1.9±0.2a 2.1±0.1 4.6±0.5 RD 0.9±0.2 21.2±2.2b 10.7±0.2 4.6±0.2 89.7±10.5 1.9±0.1 51.8±3.4 1.7±0.1ab 2.1±0.4 4.4±0.6 P-value 0.364 0.510 0.415 0.184 0.354 0.097 0.084 0.031 0.192 0.377 Plant byproduct
EB 0.8±0.1 22.4±1.3a 11.4±0.1 4.9±0.4 100.2±11.3 1.8±0.2 55.2±5.2 1.9±0.2 2.5±0.1 5.5±0.4 EC 1.0±0.3 23.6±2.8a 10.8±1.1 4.7±0.2 105.5±25.2 1.8±0.2 56.6±6.9 2.0±0.2 2.6±0.3 5.0±0.8 CP 0.9±0.2 19.0±0.6b 10.3±0.6 4.5±0.1 90.4±2.1 1.9±0.2 52.2±4.0 2.0±0.1 2.1±0.3 5.1±0.7 JM 0.8±0.2 18.7±2.1b 11.4±0.9 4.6±0.2 89.4±10.4 1.7±0.1 58.1±3.7 1.9±0.1 2.5±0.7 5.1±0.6 CH 0.9±0.1 22.0±4.0a 11.5±0.6 4.5±0.3 102.4±25.0 1.9±0.4 53.0±9.1 2.3±0.4 2.9±0.9 4.8±0.7 RD 0.9±0.2 21.2±2.2a 10.7±0.2 4.6±0.3 89.7±10.5 1.9±0.1 51.8±3.4 1.7±0.1 2.1±0.4 4.4±0.6 P-value 0.733 0.167 0.249 0.311 0.709 0.733 0.701 0.174 0.327 0.495
RD - reference diet; FS - fish silage; WH - whey meal; BB - bovine blood meal; RC - red crab meal; EB - extruded bean meal; EC - extruded chickpea meal; CP - coconut paste; JM - J. curcas meal; CH - chickpea meal; IBW - initial body weight; FBW - final body weight; TL - total length; SGR - specific growth rate; WG - weight gain; FCR - feed conversion ratio; FER - feed efficiency ratio; PER - protein efficiency ratio; HIS - hepatosomatic index; ISI - intestinal somatic index.
Diet1 HEM (%) GLU (mg dL–1) TCH (mg dL–1) TG (mg dL–1) Animal byproduct
FS 27.5±5.0 138.0±11.3ab 260.5±16.3a 389.0±124.5a
WH 27.8±1.9 174.5±9.2a 242.3±24.2ab 284.0±31.1ab
BB 22.8±4.6 104.0±11.3b 174.0±17.0c 130.0±19.8b
RC 29.3±4.3 110.5±3.5b 200.7±18.8abc 179.0±14.1b
RD 31.2±3.8 105.3±11.2b 197.3±16.8bc 177.7±7.8b
P-value 0.215 0.001 0.008 0.015
Plant byproduct
EB 25.5±0.0 116.0±0.0ab 192.0±0.0ab 146.0±0.0c
EC 28.0±5.8 119.5±0.7ab 211.5±10.6ab 195.0±24.0bc
CP 27.2±8.8 98.7±7.5b 254.0±11.3a 304.0±1.4a
JM 29.8±3.1 130.3±8.4a 208.3±21.6ab 229.5±2.1b
CH 26.8±7.5 123.0±15.6ab 182.0±18.2b 157.5±9.2c
RD 31.2±3.8 105.3±11.2ab 197.3±16.8ab 177.7±7.8c
P-value 0.923 0.037 0.029 <0.001
Table 5 - Hematological, biochemical parameters (mg dL−1) of tilapia fed diets containing animal and plant byproducts.
1 RD - reference diet; FS - 15% of fish silage meal; WH - 15% of whey meal; BB - 15% of bovine blood meal; RC - 15% of red crab meal; EB - 15% of extruded bean meal;
EC - 15% of extruded chickpea meal; CP - 15% of coconut paste; JM - 15% of J. curcas meal; and CH - 15% of chickpea meal. HEM - hematocrit; GLU - glucose; TCH - total cholesterol; TG - triglyceride.
Means in the same column with different letters are significantly different (P<0.05).
Table 6 - Digestive enzyme activity (TU) of tilapia fed diets containing animal and plant byproducts
Diet1 Protease Trypsin Chymotrypsin Amylase Lipase
Animal byproduct
FS 171.3±29.4a 20806.6±2590.9a 128509.7±12372.4a 116.5±16.2a 19.0±1.4a
WH 48.4±7.9d 5007.7±1135.7d 49435.3±13014.9d 26.5±6.3d 16.7±0.8ab
BB 79.7±23.4c 10777.2±2583.9c 68964.0±3051.8c 52.1±18.3c 15.4±5.7ab
RC 129.3±8.5b 14409.6±3472.6b 67000.0±11053.3c 58.5±14.8c 16.3±1.3ab
RD 110.7±9.1b 14670.1±2410.4b 96573.2±10236.5b 97.5±13.1b 12.6±2.5b
P-value <0.001 <0.001 <0.001 <0.001 0.005
Plant byproduct
EB 146.5±9.5a 12999.7±703.5bc 144202.8±9204.5a 131.0±9.2a 15.3±2.2bc
EC 102.3±15.5c 10724.6±435.5c 123296.7±11040.4b 63.9±3.0c 29.9±3.9a
CP 142.6±14.2a 16381.3±2413.9a 132805.5±13378.0ab 127.5±17.3a 32.0±4.3a
JM 79.7±9.5d 7102.1±882.8d 55740.7±4126.3d 54.9±10.0c 14.1±1.2c
CH 125.8±23.1ab 13961.3±3312.3ab 131950.7±24011.9ab 102.2±9.6b 19.4±5.6b RD 110.7±9.1bc 14670.1±2410.4ab 96573.2±10236.5c 97.5±13.1b 12.6±2.5c
P-value <0.001 <0.001 <0.001 <0.001 <0.001
TU - total units.
1 RD - reference diet; FS - 15% of fish silage meal; WH - 15% of whey meal; BB - 15% of bovine blood meal; RC - 15% of red crab meal; EB - 15% of extruded bean meal;
EC - 15% of extruded chickpea meal; CP - 15% of coconut paste; JM - 15% of J. curcas meal; and CH - 15% of chickpea meal. Means in the same column with different letters are significantly different (P<0.05).
Table 7 - Chemical composition of fish body (g kg−1 dry weight)
Diet Crude protein Lipid Ash Crude fiber NFE
Animal byproduct
FS 59.0±1.9 18.0±0.2bc 16.4±0.9a 0.3±0.0c 6.2
WH 58.6±0.4 19.7±0.4ab 13.4±0.4b 1.2±0.1b 7.4
BB 57.3±0.9 21.3±0.7a 13.2±0.3b 2.3±0.1a 5.3
RC 59.1±0.6 20.3±1.3ab 14.9±0.1ab 1.3±0.1c 4.9
RD 60.0±0.8 15.5±0.0c 16.3±0.4a 1.4±0.1b 6.8
P-value 0.273 0.002 0.003 <0.001 0.379
Plant byproduct
EB 57.5±0.1 21.2±1.2a 14.2±0.1b 1.7±0.1b 5.4
EC 57.8±0.8 21.3±1.3a 14.1±0.1bc 0.4±0.1c 5.9
CP 58.5±1.0 17.3±0.3b 14.2±0.4b 1.3±0.1b 8.7
JM 58.6±1.0 21.6±0.4a 13.1±0.0bc 0.4±0.0c 6.1
CH 58.2±0.4 22.1±0.6a 12.9±0.5c 2.5±0.1a 4.0
RD 60.0±0.8 15.5±0.0b 16.3±0.4a 1.4±0.1b 6.8
P-value 0.078 <0.001 <0.001 <0.001 0.227
RD - reference diet; FS - fish silage; WH - whey; BB - bovine blood; RC - red crab; EB - extruded bean; EC - extruded chickpea; CP - coconut paste; JM - J. curcas meal; CH - chickpea meal; NFE - nitrogen-free extract.
Discussion
In tilapia, the combination of intestinal length together with the wide distribution of enzymes (proteases, amylases, lipases, etc.) along the digestive tube enhance the possibility to digest different dietary sources breaking down the nutrients in small particles that flow into the blood stream to build up tissues and improve overall growth responses.
In this study, the diet using fish silage showed the highest enzyme activity and ADC values, which coincide with the highest concentrations of glucose, cholesterol, and triglycerides in blood, suggesting a strong transportation of these elements into the blood stream. This can be partially explained by the chemical process (hydrolysis) of fish silage meal that produced small particles easily assimilated by tilapia, such as peptides and amino acids (Arason, 1994). According to Pérez (1995), the nutritional value of silage meals is not affected by chemical process, resulting in suitable protein sources for substituting expensive traditional feedstuffs.
In fact, the most intense enzymatic activity was also observed for the fish silage diet among the animal byproduct groups. Feeding, digestibility, and growth studies on warm water species, including the indian carp (Cirrhinus mrigala; Ali et al., 1994), tilapia [O. niloticus
(Fagbenro and Jauncey, 1993; Fagbenro, 1998) and O.aureus
(Goddard and Al-Yahyai, 2001; Goddard et al., 2003)], and pacu (Piaractus mesopotamicus;Vidoiti et al., 2002) have demonstrated that fish silage is highly digestible and effective for substituting fish meal up to 75%.
In our study, the diet containing whey meal yielded high digestibility compared with that obtained with fish silage and RD diets. Whey meal contains a rich and heterogeneous protein mixture (Swaisgood, 1996) that could increase its high digestibility. Toullec et al. (1974) obtained high digestibility (90%) for whey meal in the
intestine of small ruminants. So far, our study is the first report on the use of whey meal in fish diets.
Halver and Hardy (2002) pointed out that an essential amino acid deficiency in the diet of aquatic organisms negatively affects protein utilization, reducing fish growth and food efficiency. El-Sayed (1998) reported low growth of Nile tilapia (150 days old) when totally substituting fish meal for bovine blood meal. In this study, bovine blood meal resulted in the highest crude protein content, but in the lowest ADC for dry matter and ingredients. This could partially be a consequence of unbalances in nutritional content, such as deficiency of isoleucine and methionine in bovine blood meal (NRC, 1983; Tacon and Jackson, 1985). This would also contribute to explain the lowest PER value obtained with the bovine blood diet when compared with the rest of the diets containing animal byproducts. It is worth noting that, according to Davies et al. (1989), nutrient digestibility and absorption of bovine blood meal can be increased by adding the needed essential amino acid.
Although red crab meal has been successfully tested in crustacean diets (Casillas and Magallón, 1988; Villarreal et al.,
2006), it showed to be poorly digested by tilapia. The high content of ash found in the red crab meal is mainly attributed as a consequence of the high mineral content in chitin (Jung et al., 2006). Chitin is a complex carbohydrate that forms the structural part of the exoskeleton of crustaceans and constitutes 15-30% of their total weight (Garzón et al., 1993), most probably contributing to the low ADC for dry matter and ingredients obtained in our study. This coincides with the observations of Shiau and Yu (1999), who reported low ADCDM by tilapia when using diets with high chitin content. Yet, despite the low digestibility coefficients observed for the RC diet, the protein efficiency ratio of tilapia obtained when using this diet was high and similar to those obtained with the fish silage and whey meal diets (Table 4). This may be a consequence of the presence
Y X Regression equation r P-value
ADCICP chy y = 0.00038x + 29.636 0.57 0.003
PER chy y = 0.0000033x + 1.5901 0.46 0.019
ADCCP SGR y = 8.132x + 49.863 0.44 0.028
FBW HEM y = 0.30103x + 12.756 0.49 0.013
TL HEM y = 0.10368x + 8.2194 0.58 0.003
WG HEM y = 1.6499x + 53.756 0.49 0.013
FCR HEM y = −0.0227x + 2.4255 0.59 0.002
FER HEM y = 0.10368x + 8.2194 0.59 0.002
PER HEM y = 0.02644x + 1.1838 0.51 0.009
Table 8 - Regression equations relating response of digestibility, growth, feed, blood parameters, and enzyme performance
ADCICP - apparent digestibility coefficient of crude protein of ingredients; PER - protein efficiency ratio; ADCCP - apparent digestibility coefficient of crude protein of diet;
of insulin-like growth promotor in red crab meal (Vega-Villasante et al., 2002). It is worth noting, however, that currently, there is no commercial fishery of the red crab meal, constituting a limitation for its use in aquaculture diets.
Although tilapia are herbivorous fish that possess morphological and physiological adaptations for the utilization of diets from vegetable sources, plants contain a variety of natural substances such as antinutrients, that interfere with the use of the nutrients (Valdez-González et al., 2013). The thermic process for extrusion can reduce antinutrients from plant diets. The tested extruded diets (extruded beans and chickpea) obtained the highest ADC values. According to Frias et al. (2000), extrusion reduces antinutritional factors and decreases trypsin inhibitors, increasing diet digestibility. On the contrary, the complete chickpea, Jathropa curcas, and coconut paste diets resulted in low ADC values, reinforcing the presence of possible antinutrients such as phytic acid (Cheryan, 1980; Nestares et al., 1999; Selle et al., 2000; Vielma et al., 2000), phenolic compounds (Hahn et al., 1984), and trypsin inhibitors (Birk, 1989). The presence of phytic acid in feedstuff forms chemical complexes that alter the protein structure, diminishing its solubility, digestibility, and enzymatic activity (Spinelli et al., 1983; Richardson et al., 1985; Hossain and Jauncey 1993; Vielma et al., 2000), which could explain our results. The Jathropa curcas meal diet showed the lowest trypsin activity and ADC values reflected in the low TG content in blood. Besides, phytic acid produces abnormalities in the intestinal epithelium, which reduce nutrient and energy availability and, consequently, depress fish growth performance. Makkar and Becker (2009) and Kumar et al. (2011) reported low ADC values of J. curcas in O. niloticus. The low ADCDM
values obtained for the coconut paste diet are related to its high fiber content. Jackson et al. (1982) concluded that the dietary inclusion of coconut paste in formulated diets with 30% crude protein for O. mossambicus for seven to nine weeks can efficiently substitute fish meal without affecting fish growth. However, Thorne et al. (1990) concluded that coconut paste is deficient in lysine.
Despite the differences found in the biochemical composition of diets, tilapia growth performance, nutrient utilization, biological indexes, blood parameters, digestive enzymatic activity, and proximal composition of fish body were similar among the animal and plant byproduct groups, indicating that the dietary energy content could strongly influence the overall growth responses. The overall response of tilapia to dietary energy was in agreement with its energy requirement (NRC, 1993). It seems that
non-protein energy in diets was spared to dietary protein from energy metabolism and then increased its utilization for fish growth (Li et al., 2012). Significant correlations found between the ACDICP and chymotrypsin activity
and between hematocrit and final weight, FCR, and PER suggest that this enzyme and the blood cell content could be used to evaluate the digestive physiology of tilapia.
Conclusions
The processed and extruded byproducts (fish silage and whey, extruded bean, and extruded chickpea meal diets) present the best apparent digestibility coefficient values for protein and dry matter. Such values can be used for formulating cheaper and efficient tilapia diets. Finally,
O. niloticus is able to utilize different animal and plant byproducts by adjusting its digestive physiology.
Acknowledgments
Funding was provided by Instituto Politécnico Nacional (SIP-IPN 20120542 y 20131517) and COFAA and EDI. Montoya-Mejía M. is a recipient of a doctoral fellowship from CONACYT and Instituto Politécnico Nacional (BEIFI Grant).
References
Ali, M. Z.; Gheyasuddin, S.; Zaher, S.; Hossain, M. A. and Islam, M. N. 1994. Evaluation of fish silage from underutilised marine fishes as protein sources in the diet of major carp (Cirrhinus mrigala). Journal of Aquaculture in the Tropics 8:247-254.
Arason, S. 1994. Production of fish silage. p.244-272. In: Fisheries processing: Biotechnological applications. Martin, A. M., ed. Chapman and Hall, London.
AOAC - Association of Official Analytical Chemists. 1995. Official methods of analysis. 16th ed. AOAC International, Gaithersburg, MD.
Birk, Y. 1989. Protein protease inhibitors of plant origin and their significance in nutrition. p.83-94. In: Huisman, J.; Van der Poel, A. F. B. and Liener, I. E., eds. Recent advances of research in antinutritional factors in legume seeds. Pudoc, Wageningen, The Netherlands.
Bligh, E. G. and Dyer, W. J. 1959. A rapid method of total lipid extraction and purification. Canadian Journal of Biochemistry and Physiology 37:911-917.
Casillas, H. R. and Magallón, B. F. 1988. Substitución de insumos tradicionales en las dietas para la engorda del camarón. Informe Interno. Centro de Investigaciones Biológicas de B.C.S., México.
Cheryan, M. 1980. Phytic acid interactions in food systems. Critical Reviews in Food Science and Nutrition 13:297-335.
Cruz-Suárez, L. E.; Tapia-Salazar, M.; Villarreal-Cavazos, D.; Beltran-Rocha, J.; Nieto-López, M. G.; Lemme, A. and Ricque-Marie, D. 2009. Apparent dry matter, energy, protein and amino acid digestibility of four soybean ingredients in white shrimp
Litopenaeus vannamei juveniles. Aquaculture 292:87-94. Davies, S. J.; Williamson, J.; Robinson, M. and Bateson, R. I.
1989. Practical inclusion levels of common animal by-products in complete diets for tilapia Oreochromis mossambicus, Peters. p.325-332. In: Proceedings of the 3rd International Symposium on Feeding and Nutr. Fish. Toba, Japan.
DelMar, E. G.; Largman, C.; Brodrick, J. W. and Geokas, M. C. 1979. A sensitive new substrate for chymotrypsin. Analytical Biochemistry 99:316-320.
El-Sayed, A. F. M. 1998. Total replacement of fish meal with animal protein sources in Nile tilapia Oreochromis niloticus (L.). Feeds Aquaculture Research 29:275-280.
Ellefson, R. D. and Caraway, W. T. 1976. Fundamentals of clinical chemistry. In: Tietz, N. W., ed. Saunders W. B., Philadelphia, USA.
Erlanger, B.; Kokowsky, N. and Cohen, W. 1961. The preparation and properties of two new chromogenic substrates of trypsin. Archives of Biochemistry and Biophysics 95:271-278.
Fagbenro, O. and Jauncey, K. 1993. Chemical and nutritional quality of raw, cooked and salted fish silages. Food Chemistry 48:331-335.
Fagbenro, O. A. 1998. Apparent digestibility of various legume seed meals in Nile tilapia diets. Aquaculure International 6:83-87. Frias, J.; Vidal, C.; Sotomayor, C.; Diaz, C. and Urbano, G. 2000.
Influence of processing on available carbohydrate content and antinutrional factors of chickpeas. European Food Research and Technology 210:340-345.
Furukawa, A. and Tsukahara, H. 1966. On the acid digestion of chromic oxide as an index substance in the study of digestibility of fish feed. Bulletin of the Japanese Society for the Science of Fish 32:502-506.
García-Carreño, F. L. 1992. Protease inhibition in theory and practice. Biotechnology Education 3:145-150.
García-Ulloa, M.; Gallo-García, M. C.; Ponce-Palafox, J. T.; Rodríguez-González, H. and Góngora-Gómez, A. M. 2013. Growth and survival of Nile tilapia (Oreochromis niloticus) fry fed with a dietary inclusion of decapsulated Artemia cysts. Journal of Aquaculture in the Tropics 28:79-88.
Garzón, S. M. L.; Romero, M. A. and James, M. G. 1993. Quitina y quitosano para uso farmaceútico. Revista Mexicana de Ciencias Farmacéuticas 24:75.
Goddard, J. S. and Al-Yahyai, D. S. S. 2001. Chemical and nutritional characteristics of dried sardine silage. Journal of Aquatic Food Product Technology 10:39-50.
Goddard, J. S.; McLean, E. and Wille, K. 2003. Co-dried sardine silage as an ingredient in tilapia, Oreochromis aureus diets. Journal of Aquaculture in the Tropics 18:257-264.
Goldenfarb, P. B.; Browyer, F. P.; Hall, E. and Brousius, E. 1971. Reproducibility in the hemotology laboratory: the microhematocrit determination. American Journal of Clinical Pathology 56:59-68. Hahn, D. H.; Rooney, L. W. and Earp, C. F. 1984. Tannins and phenols
of sorghum. Cereal Food World 29:776-779.
Halver, J. E. and Hardy, R. W. 2002. Fish nutrition. 3rd ed. Academic Press, New York.
Henry, R. J.; Cannon, D. C. and Winkelman, J. W. 1974. In: Clinical chemistry: Principles and techniques. p.687-695. Harper and Row, New York.
Hossain, M. A. and Jauncey, K. 1993. The effects of varying dietary phytic acid, calcium and magnesium levels on the nutrition of common carp, Cyprinus carpio. p.705-715. In: Fish nutrition in
practice. INRA, ed. 4th International Symposium on Fish Nutrition and Feeding, Biarritz, France.
Jackson, A. J.; Capper, B. S. and Matty, A. J. 1982. Evaluation of some plant proteins in complete diets for the tilapia, Sarotherodon mossambicus. Aquaculture 27:97-109.
Job, B. E.; Antai, E. E.; Inyang-Etoh, A. P.; Otogo, G. A. and Ezekiel, H. S. 2015. Proximate composition and mineral contents of cultured and wild tilapia (Oreochromis niloticus) (Pisces: Cichlidae) (Linnaeus, 1758). Pakistan Journal of Nutrition 14:195-200. Jones, P. L. and De Silva, S. S. 1997. Influence of differential
movement of the marker chromic oxide and nutrients on digestibility estimations in the Australian freshwater crayfish Cherax destructor. Aquaculture 154:323-336.
Jung, W. J.; Jo, G. H.; Kuk, J. H. and Kim, K. Y. 2006. Extraction of chitin from red crab shell waste by cofermentation with Lactobacillus paracasei subsp. Tolerans KCTC-3074 and Serratia marcescens FS-3. Applied Microbiology and Biotechnology 71:234-237.
Kumar, V.; Makkar, H. P. S. and Becker, K. 2011. Detoxified Jatropha curcas kernel meal as a dietary protein source. Growth performance, nutrient utilization and digestive enzymes in common carp (Cyprinus carpio L.) fingerlings. Aquaculture Nutrition 17:313-326.
Li, Y.; Moreira-Bordinhon, A.; Allen-Davies, D.; Zhang, W. and Zhu, X. 2012. Protein: energy ratio in practical diets for Nile tilapia
Oreochromis niloticus. Aquaculture International 21:1109-1119. Lundstedt, L. M.; Melo, J. F. B. and Moraes, G. 2004. Digestive
enzymes and metabolic profile of Pseudoplatystoma corruscans (Teleostei: Siluriformes) in response to diet composition. Comparative Biochemistry and Physiology B 137:331-339. Makkar, H. P. S. and Becker, K. 2009. Jatropha curcas, a promising
crop for the generation of biodisel and value-added coproducts. European Journal of Lipid Science and Technology 111:773-787. Maynard, L. A.; Loosli, J. K.; Hintz, H. F. and Warner, R. G. 1981.
Animal nutrition. McGraw-Hill Book Company, New York, NY. McGowan, M. W.; Artiss, J. D.; Standbergh, D. R. and Zack, B. 1983.
A peroxidase-coupled method for colorimetric determination of serum triglycerids. Clinical Chemistry 29:538-525.
NRC - National Research Council. 1983. Underutilized resources as animal, feedstuffs. National Academy Press, Washington, D.C. NRC - National Research Council. 1993. Committee on Animal
Nutrition. Nutrient requirements of fish. National Academy Press, Washington, DC.
Nestares, T.; Barrionuevo, M.; Urbano, G. and López-Frias, M. 1999. Effect of processing methods on the calcium, phosphorus, and phytic acid contents and nutritive utilization of chickpea (Cicer arietinum L.). Journal of Agricultural and Food Chemistry 47:2807-2812.
Pérez, R. 1995. Fish silage for feeding livestock. World Animal Review 82:50-57.
Richardson, N. L.; Higgs, D. A.; Beames, R. M. and McBride, JR. 1985. Influence of dietary calcium, phosphorus, zinc and sodium phytate level on cataract incidence, growth and histopathology in juvenile chinook salmon (Oncorhynchus tshawytscha). Journal of Nutrition 115:553-567.
Selle, P. H.; Ravindran, V.; Caldwell, R. A. and Bryden, L. W. 2000. Phytate and phytase: Consequences for protein utilization. Nutrition Research Reviews 113:255-278.
Shiau, S. Y. and Huang, S. L. 1990. Influence of varying energy levels with two protein concentrations in diets for hybrid tilapia (Oreochromis niloticus × O. aureus) reared in seawater. Aquaculture 91:143-152.
Shiau, S. Y. and Yu, Y. P. 1999. Dietary supplementation of chitin and chitosan depresses growth in tilapia, Oreochromis niloticus ×
Sokal, R. R. and Rohlf, F. J. 1995. Biometry. Freeman, W. H. New York, USA.
Spinelli, J.; Houle, C. R. and Wekell, J. C. 1983. The effect of phytates on the growth of rainbow trout (Salmo gairdeneri) fed purified diets containing varying quantities of calcium and magnesium. Aquaculture 30:71-83.
Strickland, J. D. H. and Parsons, T. R. 1972. A practical handbook of seawater analysis. Fisheries Research Board of Canada, Bulletin 167. Ottawa, Canada.
Swaisgood, H. E. 1996. Characteristics of milk. p.842-878. In: Food chemistry. Fennema, O., ed. 3rd ed. Marcel Dekker, New York. Tacon, A. G. J. and Jackson, A. J. 1985. Utilization of conventional
and unconventional protein sources in practical fish feeds. p.119-145. In: Nutrition and feeding in fish. Cowey, C. B.; Mackie, A. M. and Bell, J. G., eds. Academic Press, London.
Tengjaroenkul, B.; Smith, B. J.; Caceci, T. and Smith, S. A. 2000. Distribution of intestinal enzyme activities along the intestinal tract of cultured Nile tilapia, Oreochromis niloticus L. Aquaculture 182:317-327.
Thorne, P. J.; Wiseman, J. and Cole, D. J. A. 1990. Copra meal. p.127-134. In: Non-traditional feed sources for use in swine production, butterworth. Thacker, P. A. and Kirkwood, R. N., eds. Butterworth, London.
Toullec, R.; Mathieu, C. M. and Pion, R. 1974. Utilisation des protéines du lactosérum par le veau préruminant à l’engrais. II. Digestibilité et utilisation pour la croissance. Annales de Zootechnie 23:75-87. Valdez-González, F.; Gutiérrez-Dorado, R.; García-Ulloa, M. and
Rodríguez-González, H. 2013. Revisión del efecto de los antinutrientes y la fibra de leguminosas en la alimentación para peces. Ciencia Nicolaita, Núm. 59.
Vega-Villasante, F.; Nolasco, H. and Civera, R. 1993. The digestive enzymes of the Pacific brown shrimp Panaeus californiensis: I. Properties of the amylase activity in the digestive tract. Comparative Biochemistry and Physiology B 106:547-550. Vega-Villasante, F.; Fernández, I.; Preciado, R. M.; Oliva, M.; Tovar,
D. and Nolasco, H. 1999. The activity of digestive enzymes during the molting stages of the arched swimming Callinectes arcuatus
(Ordway, 1863) (Crustaceae: Decapoda: Portunidae). Bulletin of Marine Science 65:1-9.
Vega-Villasante, F.; Nolasco, H.; Adyary, F. and Carrillo-Farnes, O. 2002. Biochemical characterization of crude extract from
Pleuroncodes planipes (Crustacaea: Galactheidae) as potential feed additive, considerations for a new fishery along the México Pacific Coast. Hidrobiológica 12(2).
Versaw, W. K.; Cuppet, S. L.; Winters, D. D. and Williams, L. E. 1989. An improved colorimetric assay for bacterial lipase in nonfat dry milk. Journal of Food Science 54:1557-1558.
Vidoiti, R. M.; Carneiro, D. and Macedo-Viegas, E. 2002. Acid and fermented silage characterization and determination of apparent digestibility coefficient of crude protein for pacu Piaractus mesopotamicus. Journal of the World Aquaculture Society 33:57-62.
Vielma, J.; Makinen, T.; Ekholm, P. and Koskela, J. 2000. Influence of dietary soy and phytase levels on performance and body composition of large rainbow trout (Oncorhynchus mykiss) and algal availability of phosphorus load. Aquaculture 183:349-362. Villarreal, H.; Civera-Cerecedo, R. and Hernández-Llamas, A. 2006.
Effect of partial and total substitution of shrimp meal, fish meal and soy meal with red crab meal Pleuroncodes planipes (Stimpson) on the growth of juvenile white shrimp Litopenaeus vannamei