Revista Brasileira de
Engenharia Agrícola e Ambiental
Campina Grande, PB, UAEA/UFCG – http://www.agriambi.com.br
v.20, n.12, p.1107-1111, 2016
Spatial and temporal distribution of weeds in no-tillage system
Eduardo L. Bottega
1, Camilo Pegoraro
2, Naiara Guerra
3,
Antonio M. de Oliveira Neto
4& Daniel M. de Queiroz
5 DOI: http://dx.doi.org/10.1590/1807-1929/agriambi.v20n12p1107-1111A B S T R A C T
Brazil is one of the largest grain producers in the world, due to its extensive arable land and favorable climate for the cultivation of any species. The production could be higher, but problems such as competition between crops and weeds reduces crop yields. This study aimed to analyze the spatial distribution of weeds, especially milkweed (Sonchus oleraceus), horse weed (Conyza spp.) and ‘maria-mole’ (Senecio brasiliensis) in an area under no-tillage system for two harvests. The work was carried out during the 2013/14 and 2014/15 crop years in an area of 22.5 ha, where soybean is grown in the summer and oat in the winter. The weeds were mapped using a sampling grid of 85 points. The number of plants present in 0.25 m2 was recorded at each sampling point. The data collected in the field composed
the information bank and were used for geostatistical analysis and production of maps. Using geostatistical analysis, it was possible to map the horseweed infestation in the studied area for the 2013/14 season. The species ‘maria-mole’ and milkweed did not show spatial dependence. During the 2014/2015 season, because of the management carried out in the off season, none of the studied species showed spatial dependence.
Distribuição espacial de plantas daninhas
em área de plantio direto
R E S U M O
O Brasil figura como um dos maiores produtores de grãos do mundo em função de suas extensas áreas agricultáveis e do clima favorável ao cultivo de grande número de espécies. A produção poderia ser maior, mas problemas como a competição das culturas com plantas daninhas reduzem a produtividade das culturas. Este trabalho teve por objetivo estudar a distribuição espacial de plantas daninhas em especial serralha (Sonchus oleraceus), buva (Conyza spp.) e maria-mole (Senecio brasiliensis) em área de plantio direto durante duas safras agrícolas. O trabalho foi realizado durante os anos agrícolas de 2013/14 e 2014/15 em uma área de 22,5 ha na qual se cultiva soja no verão e aveia no inverno. Para o mapeamento das plantas daninhas foi utilizada uma grade amostral composta por 85 pontos; em cada ponto amostral foi contabilizado o número de plantas presentes em 0,25 m2. Os dados
coletados em campo compuseram o banco de informações e foram utilizados para análise geoestatística e produção dos mapas. Utilizando análise geoestatística foi possível mapear a infestação de buva na área de estudos para a safra 2013/14. As plantas daninhas maria-mole e serralha não apresentaram dependência espacial; na safra 2014/2015, em função do manejo realizado na entressafra, nenhuma espécie estudada apresentou dependência espacial.
Key words:
precision agriculture spatial variability Sonchus oleraceus Conyza spp. Senecio brasiliensis
Palavras-chave:
agricultura de precisão variabilidade espacial Sonchus oleraceus Conyza spp. Senecio brasiliensis
1 Universidade Federal de Santa Maria. Cachoeira do Sul, RS. E-mail: [email protected] (Corresponding author) 2 Grupo Horita. Luiz Eduardo Magalhães, BA. E-mail: [email protected]
3 Universidade Federal de Santa Catarina. Curitibanos, SC. E-mail: [email protected] 4 Instituto Federal Catarinense. Rio do Sul, SC. E-mail: [email protected]
5 Universidade Federal de Viçosa/Departamento de Engenharia Agrícola. Viçosa, MG. E-mail: [email protected]
Introduction
Precision agriculture (PA) is based on the localized management of agricultural systems using resources such as mapping of production factors, tools of support to decision and localized application of inputs. In Brazil, PA techniques have been used almost exclusively in the application of fertilizers and correctives at variable rates. However, this technology is not only limited to the management of soil fertility and can be adopted, for example, in the localized control of weeds. Jaremtchuk et al. (2008) emphasize that the mapping of weed population allows the monitoring of the infestation over time, enabling the development of management strategies that minimize the effect of competition with the crop, besides the saving of resources due to the application of varying volumes according to the infestation.
Chiba et al. (2010), studying spatial and temporal variability of weeds in a Red Latosol with clayey texture under no-tillage system, observed that weeds, both magnoliopsida and liliopsida, show a defined spatial distribution structure (non-random occurrence), allowing the use of geostatistical analysis to fit theoretical models of semivariance and construction of thematic maps. These authors also pointed out that the mapping of weeds indicated an aggregated structure of occurrence (localized groups), which may favor the localized application of herbicides, corroborating with studies conducted by Wiles & Brodhal (2004), who demonstrated that the spatial distribution pattern of weeds rarely occurs at random, because it is conditioned to the specific differences of each environment. Rocha et al. (2015) successfully mapped weeds using PA techniques and observed that the species Conyza spp., Cenchrus
echinatus and Eleusine indica showed spatial dependence.
According to these authors, the maps of the spatial distribution of these weeds are an important tool for the localized control, making the use of herbicide more rational, effective and economic.
Weeds normally infest the cultivation areas in clumps. The use of geostatistics, in this context, is able to describe the spatial behavior of the infestation, contributing to its mapping. Once the clumps are mapped, it is possible to perform the localized control, since their geographic location in the agricultural area becomes known. This study aimed to use geostatistical techniques to map the weed species common sow thistle
(Sonchus oleraceus), horseweed (Conyza spp) and
‘maria-mole’ (Senecio brasiliensis), in order to study their spatial dependence in an area under no-tillage system during two agricultural seasons.
Material and Methods
The experiment was carried out in the agricultural years of 2013/14 and 2014/15 in an area located in the municipality of Brunópolis, SC, Brazil (27° 20' 35" S; 50° 52' 27" W; 927 m). The region has a humid temperate climate, with cool summer and cold winter. The mean annual rainfall is 1800 mm. The property adopts the no-tillage system and soybean is the main crop. The soil is classified as Haplic Cambisol with clayey texture (EMBRAPA, 2013).
The survey of the weeds was conducted using a regular sampling grid composed of 85 geo-spatialized points spaced by 50 m in an area of 22.5 ha. Weeds were sampled in each point using a template of 0.25 m2 (0.5 x 0.5 m), as adopted in
the study of Rocha et al. (2015). The surveys were conducted in November, in both agricultural years, at the pre-sowing of soybean.
The species with higher infestation in the area were common sow thistle (Sonchus oleraceus), horseweed (Conyza spp) and ‘maria-mole’ (Senecio brasiliensis) and because of that they were used in the study. The number of plants of these species in the template area was counted and then their density (plants m-2) was calculated. The point-to-point walk
was performed using a GPS receiver (GPSMap - Garmin®).
The collected data were analyzed through descriptive statistics based on the calculation of mean, minimum, maximum, standard deviation and coefficient of variation, for characterization. The spatial variability of the variables was analyzed using geostatistics. The spatial dependence was evaluated based on the fit of variograms assuming the stationarity of the intrinsic hypothesis, defined by Eq. 1.
( )
( )
N h( )( )
(
)
2 i 11
ˆ h Z xi Z xi h
2N h =
γ =
∑
− − where:
γ(h) - semivariance as a function of the distance (h) between pairs of points;
h - distance between pairs of points; and,
N(h) - number of pairs of experimental points separated by a distance h.
Gaussian, spherical and exponential models were tested, fitting the model the best represented the relationship between the experimental semivariance and the distance h, through the determination of the parameters: nugget effect (C0), variance
contribution (C); sill (C0 + C) and range (A). The model with
best fit was selected based on the parameters of lowest residual sum of squares (RSS) and highest coefficient of determination (R2), as well as the cross validation analysis (observed values
vs estimated values).
The maps were interpolated using the ordinary kriging technique and, for the estimates, 16 close neighbors and a search radius equal to the value of range found in the fit of the semivariogram. The geostatistical analyses were conducted using the computational program GS+, version 9. The krigged data were exported in the “.grd” format, for later construction of the thematic maps in the program Surfer, version 10.
Results and Discussion
In the survey conducted in the 2013/14 season, there was spatial dependence only for horseweed; the other weed species did not show spatial dependence, although they were present in the studied area. Table 1 shows the descriptive statistical parameters of the weeds sampled in the studied area. The weed with highest population density was horseweed, with mean of 6.59 plants m-2. This species also showed the highest coefficient
of variation, 53.73%, which is an indication of localized groups (clumps), in studies considering the spatial location of the sampled variable.
Trezzi et al. (2014) emphasize that, in no-tillage system, the chemical control of weeds before sowing is fundamental to avoid yield losses in the crops. Studies conducted by Trezzi et al. (2013) demonstrated that the presence of 13 horseweed plants m-2 was able to reduce soybean yield by 25%. Although
the mean value of horseweed plants is below 13, in some sampling points the density was 80 plants m-2, which can reduce
soybean yield to zero.
Among the species sampled in the present study, horseweed is the one with largest damage, also requiring the control in post-emergence of the crop, which is limited by the increasingly higher resistance of this weed to the use of herbicides (Trezzi et al., 2011; Lamego et al., 2013). In this context, the mapping of weeds has potential, because it is possible to increase the efficiency of the chemical control performed in pre-emergence, by knowing the geographic location of the clumps.
Table 2 showed the semivariogram fitting parameters and the parameters observed for the cross validation analysis. The model that best described the spatial variability of horseweed plants was the exponential one. In the study conducted by Rocha et al. (2015), the spherical model showed the best fit to the empirical semivariance observed for the spatial distribution of horseweed in an area under no-tillage system. The range was 128 m and the fit exhibited coefficient of determination of 0.83, and these values are higher than those found in the present study. The values of range can influence the quality of the estimates, because it determines the number of values used in the interpolation. Hence, estimates performed through ordinary kriging using higher values of range tend to be more reliable, generating maps that better represent the reality (Corá et al., 2004).
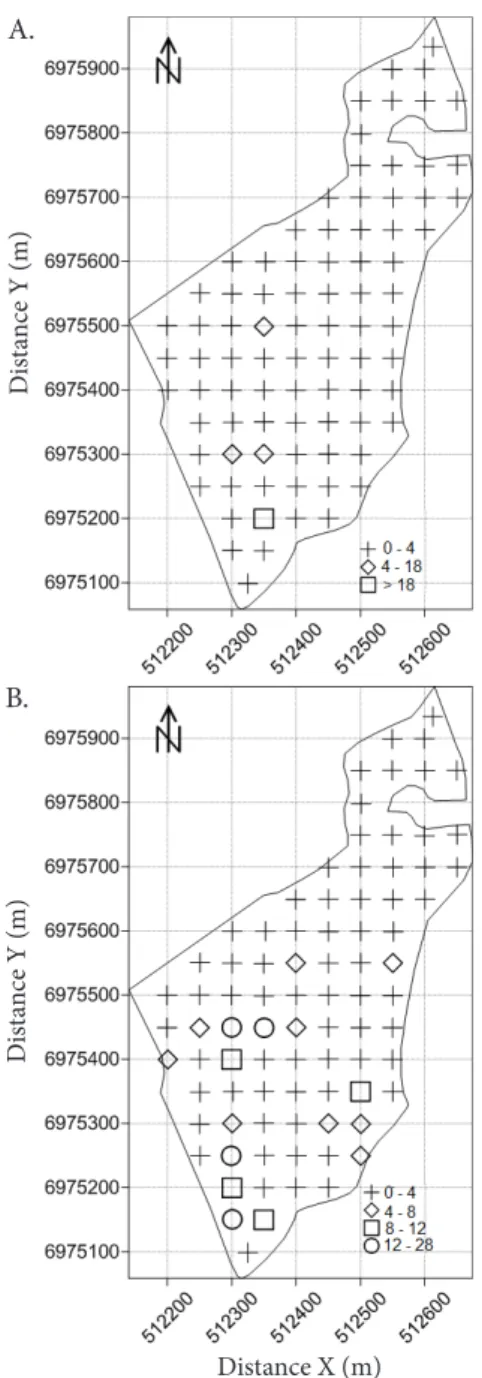
Figure 1 shows the thematic map of spatial distribution of horseweed plants (Figure 1A) and the polygon representing its occupation area (Figure 1B).
The mapping performed in the 2013/14 season detected an area of 13.2 ha with infestation of horseweed plants (Figure 1B) above the recommended level for control, representing 58.7% of the total area. Simulating herbicide application and considering that it was performed only on the delimited areas, there would be a saving of 41.3%, equivalent to the percentage of the area where the control would not be performed. Table 1. Descriptive statistical parameters of the populations of common sowthistle, horseweed and ‘maria-mole’
Statistical parameters
Weeds per square meter
Common sow thistle Horseweed ‘Maria-mole’
Mean 1.55 6.59 0.42
Minimum value 0 0 0
Maximum value 28 80 24
Standard deviation 4.10 12.26 2.69
CV (%) 37.89 53.73 15.73
1Range (m); 2Sill; 3Nugget effect; 4Residual sum of squares; 5Coefficient of determination; 6Intercept; 7Standard error of prediction
Attribute Geostatistical parameters Parameters of cross validation analysis
Model a(1) C
0+ C(2) C0(3) RSS(4) R2(5) Coefficient of regression Y(6) SEP(7) R2
Horseweed Exponential 57.5 94.7 13.9 305 0.66 0.53 2.66 8.7 0.13
Table 2. Parameters of the theoretical semivariograms and cross validation analysis referring to the modeling of spatial dependence of horseweed plants present in the studied area
Figure 1. Thematic map of distribution of horseweed plants (A) and polygon representing its infestation area (B)
A.
B.
plants m-2
13.2 ha
Di
st
an
ce Y (m)
Distance X (m)
Di
st
an
ce Y (m)
A study conducted by Jurado-Expósito et al. (2004), in which geostatistical techniques and population maps obtained through kriging were used to estimate the cover percentage for local application, aiming at the control of Convolvulus arvensis L., allowed a reduction of 81% of the costs with herbicide. The mapping of weed populations promotes, besides the economic benefit, a reduction in the impacts caused by the application of agrochemicals on both the environment and the person who performs the application.
2014, through the application of the herbicide metsulfuron-methyl (Ally) at the dose of 4.0 g c.p. ha-1 in post-emergence.
A second data collection was performed in November 2014, in the same period of the collection of 2013, and there was an excellent control of the analyzed weed species (S. oleraceus,
S. brasiliensis and Conyza spp.). No clumps and/or isolated
plants were observed, which demonstrates the efficiency of the adopted control measures.
The association between the forms of crop and chemical control is an efficient way to reduce the infestation of weeds. Oliveira Neto et al. (2010) highlight in their study that the combination of post-harvest autumn management of second-season maize with the sowing of oat to cover the soil in the offseason (August to October) led to benefits in the control of not only horseweed, but also of other weeds.
Studies conducted by Paula et al. (2011) demonstrated that the population of horseweed resistant to glyphosate was larger in areas maintained in fallow, compared with those cultivated with wheat or black oat during the winter, highlighting the influence of the cultivation of these crops on the suppression of horseweed plants. Vargas & Gazziero (2009) emphasize that the weed-suppressing effect that some species provide, including oat, combined with the chemical control, has great impact on the control of horseweed.
The horseweed plants that germinated in areas with suppressing species had difficulty to develop, facilitating the control with herbicides (Main et al., 2006). In this context, the association of glyphosate with herbicides that have alternative action mechanism, such as 2,4-D or chlorimuron-ethyl, complemented with an application close to crop sowing of a contact herbicide, such as paraquat+diuron, can reduce the incidence of horseweed resistant to glyphosate (Lamego et al., 2013).
According to the studies conducted by Balbinot Júnior et al. (2008), the multi-cropping with black oat + ryegrass + vetch + arrow-leaf clover promoted high suppression of weeds, which, according to the authors, can be attributed to the large amount of straw. These authors point out that, in the south of Brazil, the soil cover in the winter, without grazing, promotes good control of weeds, contributing to the summer crops. Similar results were obtained by Pacheco et al. (2009) in an experiment of oversowing in soybean using Brachiarias. These authors observed that the oversowing reduced the emergence of the weeds ‘apaga-fogo’ (A. tenella) and ‘capim-carrapicho’
(C. echinatus). According to them, this technique can be an
important tool in the weed suppression management. Studies conducted by Noce et al. (2008) show that the
Brachiaria grass is superior in the reduction of weed infestation
and in straw production, indicating a probable correlation between both variables. Moraes et al. (2009), studying the use of vegetative cover for the control of weeds, in the maize crop, observed better results when ryegrass was used as the cover crop, in relation to fodder radish. These authors attribute the positive results to various allelopathic compounds present in the ryegrass, which are released when the straw is in an advanced stage of decomposition, causing the inhibition of germination and the development of weeds.
B.
Di
st
an
ce Y (m)
Distance X (m)
Di
st
an
ce Y (m)
A.
Figure 2. Indicative maps of weed density per sampling point. ‘Maria-mole’ (A) and Common sowthistle (B)
‘maria-mole’, there were dispersed occurrences, which did not characterize the formation of clumps.
In the 2014/15 season, none of the studied species showed spatial dependence and no weeds were observed in the studied area. This fact can be explained by the management adopted in the area during the offseason. Instead of maintaining the soil in fallow during the winter, white oat was sown as a strategy of weed management, using 60 kg of seeds per hectare, which favored the formation of a dense, uniform plantation.
Monteiro & Vieira (2002) explain that secondar y compounds synthesized by the plants can be used as an alternative to the use of pesticides. The allelopathic action of some oat genotypes is attributed to their capacity to exudate scopoletin, a secondary product that is able to retard the growth of other plants.
On June 9, 2014, a desiccation of management was performed using 2,4-D (0.7 L c.p. ha-1), for later sowing
Conclusions
1. Using geostatistical techniques, it was possible to map the infestation of horseweed in the studied area, for the 2013/14 season.
2. The weeds ‘maria-mole’ and common sowthistle did not show spatial dependence.
3. The management performed in the offseason reduced the population of the studied weeds.
Literature Cited
Balbinot Júnior, A. A.; Moraes, A.; Pelissari, A.; Dieckow, J.; Veiga, M. Formas de uso do solo no inverno e sua relação com a infestação de plantas daninhas em milho (Zea mays) cultivado em sucessão. Planta Daninha, v.26, p.569-576, 2008. http://dx.doi.org/10.1590/ S0100-83582008000300012
Chiba, M. K.; Guedes Filho, O.; Vieira, S. R. Variabilidade espacial e temporal de plantas daninhas em Latossolo Vermelho argiloso sob semeadura direta. Acta Scientiarum Agronomy, v.32, p.735-742, 2010. http://dx.doi.org/10.4025/actasciagron.v32i4.5445 Corá, J. E.; Araújo, A. V.; Pereira, G. T.; Beraldo, J. M. G. Variabilidade
espacial de atributos do solo para adoção do sistema de agricultura de precisão na cultura de cana-de-açúcar. Revista Brasileira de Ciência do Solo, v.28, p.1013-1021, 2004. http://dx.doi. org/10.1590/S0100-06832004000600010
EMBRAPA - Empresa Brasileira de Pesquisa Agropecuária. Sistema brasileiro de classificação de solo. 3.ed. Brasília: EMBRAPA, 2013. 353p.
Jaremtchuk, C. C.; Constantin, J.; Oliveira Júnior, R. S.; Biffe, D. F.; Alonso, D. G.; Arantes, J. G. Z. Efeito de sistemas de manejo sobre a velocidade de dessecação, infestação inicial de plantas daninhas e desenvolvimento e produtividade da soja. Acta Scientiarum Agronomy, v.30, p.449-455, 2008. http://dx.doi.org/10.4025/ actasciagron.v30i4.5297
Jurado-Expósito, M.; López-Granados, F.; González-Andújar, J. L.; García-Torres, L. Spatial and temporal analysis of Convolvulus arvensis L. populations over four growing season. European Journal of Agronomy, v.21, p.287-296, 2004.
Lamego, F. P.; Kaspary, T. E.; Ruchel, Q.; Gallon, M.; Basso, C. J.; Santi, A. L. Manejo de Conyza bonariensis resistente ao glyphosate: Coberturas de inverno e herbicidas em pré-semeadura da soja. Planta Daninha, v.31, p.433-442, 2013. http://dx.doi.org/10.1590/ S0100-83582013000200022
Main, C. L.; Steckel, L. E.; Hayes, R. M.; Mueller, T. C. Biotic and abiotic factors influence horseweed emergence. Weed Science, v.54, p.1101-1105, 2006. http://dx.doi.org/10.1614/WS-06-026R1.1
Monteiro, C. A.; Vieira, E. L. Substâncias alelopáticas. In: Castro, P. R. C.; Sena, J. O. A.; Kluge, R. A. Introdução à fisiologia do desenvolvimento vegetal. Maringá: UEM, 2002. p.105-122.
Moraes, P. V. D.; Agostinetto, D.; Vignolo, G. K.; Santos, L. S.; Panozzo, L. E. Manejo de plantas de cobertura no controle de plantas daninhas na cultura do milho. Planta Daninha, v.27, p.289-296, 2009. http://dx.doi.org/10.1590/S0100-83582009000200011 Noce, M. A.; Souza, I. F.; Karam, D.; França, A. C.; Maciel, G.
M. Influência da palhada de gramíneas forrageiras sobre o desenvolvimento da planta de milho e das plantas daninhas. Revista Brasileira de Milho e Sorgo, v.7, p.265-278, 2008. http:// dx.doi.org/10.18512/1980-6477/rbms.v7n3p265-278
Oliveira Neto, A. M.; Constantin, J.; Oliveira Júnior, R. S.; Guerra, N.; Dan, H. A.; Alonso, D. G.; Blainski, E.; Santos, G. Estratégias de manejo de inverno e verão visando ao controle de Conyza bonariensis e Bidens pilosa. Planta Daninha, v.28, p.1107-1116, 2010. http://dx.doi.org/10.1590/S0100-83582010000500018 Pacheco, L. P.; Pires, F. R.; Monteiro, F. P.; Procópio, S. O.; Assis, R. L.;
Cargnelutti Filho, A.; Carmo, M. L.; Petter, F. A. Sobressemeadura da soja como técnica para supressão da emergência de plantas daninhas. Planta Daninha, v.27, p.455-463, 2009. http://dx.doi. org/10.1590/S0100-83582009000300005
Paula, J. M.; Vargas, L.; Agostinetto, D.; Nohatto, M. A. Manejo de
Conyza bonariensis resistente ao herbicida glyphosate. Planta Daninha, v.29, p.217-227, 2011. http://dx.doi.org/10.1590/S0100-83582011000100024
Rocha, F. C.; Oliveira Neto, A. M.; Bottega, E. L; Guerra, N.; Rocha, R. P.; Vilar C. C. Weed mapping using techniques of precision agriculture. Planta Daninha, v.33, p.157-164, 2015. http://dx.doi. org/10.1590/S0100-83582015000100018
Trezzi, M. M.; Balbinot Júnior, A. A.; Benin, G.; Debastiani, F.; Patel, F.; Miotto, J. R. E. Competitive ability of soybean cultivars with horseweed (Conyza bonariensis). Planta Daninha, v.31, p.543-550, 2013. http://dx.doi.org/10.1590/ S0100-83582013000300006
Trezzi, M. M.; Vidal, R. A.; Patel, F.; Miotto Júnior, E.; Debastiani, F.; Balbinot Júnior, A. A.; Mosquen, R. Impact of Conyza bonariensis
density and establishment period on soyabean grain yield, yield components and economic threshold. Weed Research, v.55, p.34-41, 2014. http://dx.doi.org/10.1111/wre.12125
Trezzi, M. M.; Vidal, R. A.; Xavier, E.; Rosin, D.; Balbinot Júnior, A. A; Prates, M. A. Resistência ao glyphosate em biótipos de buva (Conyza spp.) das regiões oeste e sudoeste do Paraná. Planta Daninha, v.29, p.1113-1120, 2011. http://dx.doi.org/10.1590/ S0100-83582011000500019
Vargas, L.; Gazziero, D. L. P. Manejo de buva resistente ao glifosato. Passo Fundo: Embrapa Trigo, 2009. 16p. Documentos, 91. <http:// ainfo.cnptia.embrapa.br/digital/bitstream/item/31188/1/doc.91. trigo.pdf>. 25 Out. 2013.