This is an Open Access article distributed under the terms of the Creative Commons Attribution License (http://creativecommons.org/ licenses/by/4.0/), which permits unrestricted reuse, distribution, and reproduction in any medium, provided the original work is properly cited. © The Author(s) 2019. Published by Oxford University Press on behalf of the Annals of Botany Company.
Photosynthetic capacity, leaf respiration and growth in
two papaya (Carica papaya) genotypes with different leaf
chlorophyll concentrations
Jéssica Sousa Paixão
1, Jefferson Rangel da Silva
2, Katherine Fraga Ruas
1,
Weverton Pereira Rodrigues
1, José Altino Machado Filho
3, Wallace de Paula Bernado
1,
Deivisson Pelegrino Abreu
1, Luciene Souza Ferreira
1, Julian Cuevas Gonzalez
4, Kevin Lee Griffin
5,6,
José Cochicho Ramalho
7,8and Eliemar Campostrini
1*1Setor de Fisiologia Vegetal, Laboratório de Melhoramento Genético Vegetal, Centro de Ciências e Tecnologias Agropecuárias,
Universidade Estadual do Norte Fluminense, Avenida Alberto Lamego, 2000, Parque Califórnia, Campos dos Goytacazes, Rio de Janeiro 28013-602, Brazil
2Centro de Citricultura Sylvio Moreira, Instituto Agronômico, Rodovia Anhanguera, km 158, Cordeirópolis, São Paulo 13490-970,
Brazil
3Instituto Capixaba de Pesquisa, Assistência Técnica e Extensão Rual, Rua Afonso Sarlo 160, Bento, Ferreira, Vitória, Espírito Santo
29052-010, Brazil
4Agronomy Department, University of Almería, ceiA3, Ctra. Sacramento s/n, 04120 Almería, Spain
5Department of Earth and Environmental Sciences, Columbia University, Lamont-Doherty Earth Observatory, Palisades, NY 10964,
USA
6Department of Ecology, Evolution, and Environmental Biology, Columbia University, New York, NY 10027, USA
7Lab. Interações Planta-Ambiente & Biodiversidade (PlantStress&Biodiversity), Linking Landscape, Environment, Agriculture and
Food (LEAF), Departamento de Recursos Naturais, Ambiente e Território (DRAT), Instituto Superior de Agronomia (ISA), Universidade de Lisboa (ULisboa), Av. República, 2784-505 Oeiras, Portugal
8GeoBioTec, Faculdade de Ciências Tecnologia, Universidade NOVA de Lisboa, 2829-516 Caparica, Portugal
Received: 2 October 2018 Editorial decision: 26 February 2019 Accepted: 7 March 2019 Published: 8 March 2019 Associate Editor: Mary Heskel
Citation: Paixão JS, da Silva JR, Ruas KF, Rodrigues WP, Filho JAM, Bernado WP, Abreu DP, Ferreira LS, Gonzalez JC, Griffin KL, Ramalho JC, Campostrini E. 2019. Photosynthetic capacity, leaf respiration and growth in two papaya (Carica papaya) genotypes with different leaf chlorophyll concentrations. AoB PLANTS 11: plz013; doi: 10.1093/aobpla/plz013
Abstract.
Golden genotype of papaya (Carica papaya), named for its yellowish leaves, produces fruits very much appreciated by consumers worldwide. However, its growth and yield are considerably lower than those of other genotypes, such as ‘Sunrise Solo’, which has intensely green leaves. We undertook an investigation with the goal of evaluating key physiological traits that can affect biomass accumulation of both Golden and Sunrise Solo geno-types. Papaya seeds from two different genotypes with contrasting leaf colour ‘Sunrise Solo’ and Golden were grown in greenhouse conditions. Plant growth (plant height, leaf number, stem diameter, leaf area, plant dry weight), leaf gas exchanges, leaf carbon balance, RuBisCO oxygenation and carboxylation rates, nitrogen, as well as chlorophyll concentrations and fluorescence variables were assessed. Although no significant differences were observed for photosynthetic rates between genotypes, the accumulation of small differences in photosynthesis, day after day, over a long period, might contribute to some extend to a higher C-budget in Sunrise Solo, higher leaf area and, thus, to higher productivity. Additionally, we consider that physiological processes other than photosynthesis and leaf respiration can be as well involved in lower growth and yield of Golden. One of these aspects could be related tothe higher rates of photorespiration observed in Sunrise Solo, which could improve the rate of N assimilation into organic compounds, such as amino acids, thus contributing to the higher biomass production in Sunrise Solo relative to Golden. Further experiments to evaluate the effects of N metabolism on physiology and growth of Golden are re-quired as it has the potential to limit its yield.
Keywords:
Chlorophyll fluorescence; leaf respiration rates; net photosynthesis; nitrogen concentration; RuBisCO oxygenation/carboxylation rates.Introduction
Papaya is the most economically important species within the Caricaceae family and it is widely cultivated not only for fruit consumption, but also for the proteo-lytic enzyme papain, which has several commercial and medical uses (Villegas 1997; Campostrini and Glenn 2007; Carr 2014). In 2016, there were an estimated 441 964 ha of papaya cultivated worldwide, with an an-nual production of >13 million t of fresh fruit. The prin-cipal producers were India (5.69 million t from 133 000 ha), Brazil (1.42 million t from 30 372 ha), Mexico (0.95 million t from 16 820 ha) and Indonesia (0.90 million t from 9980 ha) (FAOSTAT 2016). Although Golden fruits are better accepted by consumers worldwide due to the superior appearance of the fruits, greater transport re-silience and longer post-harvest, Golden plants are less vigorous (Torres-Netto et al. 2009; Castro et al. 2014) and lower yielding compared to ‘Sunrise Solo’ (90 vs. 120 t ha−1 in the whole cycle) (Caliman Agrícola, Linhares, Espiríto Santo, Brazil, pers. comm.; Costa and Pacova 2003). Lower growth vigour and yield were first assumed to be related to the reduced chlorophyll and nitrogen (N) content of the leaves (Torres-Netto et al. 2009; Castro
et al. 2014).
A substantial fraction of leaf N is allocated to the photosynthetic apparatus and invested in chlorophyll, chlorophyll-binding proteins and, especially, RuBisCO (Griffin and Seemann 1996; Zhang et al. 2008; Sage 2013), thus higher N content promotes better photo-synthetic performance (Hikosaka and Terashima 1995), and plays a crucial role in the plant ability to trigger acclimation mechanisms (Ramalho et al. 1999; Carelli
et al. 2006). RuBisCO alone can account for up to 50 % of leaf soluble protein (Spreitzer and Salvucci 2002) and for 20–30 % of total leaf nitrogen (Makino 2003). Thus, the low leaf N concentration of Golden leaves could nega-tively affect their photosynthetic capacity and there-fore, growth and yield (Eckardt 2009; Akram and Ashraf 2011). However, a previous study showed that Golden had similar CO2 uptake rates to ‘Sunrise Solo’ (Castro
et al. 2014), which suggests that physiological processes other than photosynthesis are likely responsible for the reduced growth and yield of Golden. Previous work on leaf pigments demonstrated that similar rates of canopy
photosynthesis can be maintained in soybean with dra-matically lower leaf chlorophyll and 9 % lower leaf ni-trogen (Walker et al. 2017). Additionally, Slattery et al. (2017) reported that chlorophyll content can be drastic-ally reduced with little impact to canopy photosynthesis, suggesting an over-investment in chlorophyll and an under-utilization of photosynthetic biochemical cap-acity in modern soybean cultivars. Slattery et al. (2017)
further showed that chlorophyll deficiency led to greater rates of leaf-level photosynthesis per absorbed photon early in the growing season when mutant chlorophyll content was ca. 35 % of the wild-type, but there was no effect on photosynthesis later in the season when mu-tant leaf chlorophyll approached 50 % of the wild-type. Despite a >50 % chlorophyll reduction, there was little negative impact on both biomass accumulation and yield. The small negative effects that were present were likely due to a pleiotropic effect of the mutation that was linked to lower water use efficiency (WUE) that may have dampened any photosynthetic benefits of reduced chlorophyll content, especially since significant drought conditions were experienced during the work (Slattery
et al. 2017).
Other authors have studied the relationship between photosynthetic pigment content and photosynthetic capacity in papaya plants. Castro et al. (2014) showed that the reduction in the maximum quantum yield of primary photochemistry (Fv/Fm) in Golden was only
observed when total chlorophyll concentration was <400 µmol m−2, while in ‘Sunrise Solo’ the F
v/Fm reduction
was observed when total chlorophyll concentration was <600 µmol m−2. This lack of effect of total chlorophyll concentration on Fv/Fm ratio may indicate that there was a reduction in the generation of reactive oxygen species from over-excited reaction centres (Vass and Cser 2009). Thus, by reducing total light energy absorption (<total chlorophyll concentration) and conserving antioxidant capacity, light stress resilience may be improved (Foyer and Shigeoka 2011). Despite the relevance of these pre-vious studies, a full analysis of the relationships between chlorophyll concentration, gas exchange, leaf respir-ation and leaf carbon balance (LCB) was not performed.
Slattery et al. (2017) hypothesized that decreasing leaf absorbance through reduced chlorophyll content
could improve light penetration into a crop canopy, so that sun leaves would reduce over-saturation at midday, while allowing more light to reach the lower canopy. This would stimulate maximum net photosyn-thetic rates (Anet) in shade leaves, thereby potentially improving canopy photosynthesis, and potential yield. However, papaya plants exhibit spiralled phyllotaxis in a 3:8 configuration (Campostrini et al. 2018) which might impact canopy light absorption. There are three leaves positioned clockwise or counterclockwise within each 360° turn around the trunk, and spiral leaf insertion on the trunk. This leaf arrangement is associated with long petioles and allows for efficient light distribution in the papaya canopy (Ferraz et al. 2016). Thus, the hypothesis proposed by Slattery et al. (2017) might be less relevant for papaya. However, considering that photosynthetic performance is maintained for lower leaf chlorophyll and N contents, it might be envisaged a somewhat de-creased application of N to reduce costs, leaching and soil contamination (Neeteson 1995).
Net leaf carbon gain estimated from leaf photosyn-thesis alone typically leads to an overestimation of plant performance (Escalona et al. 2012). Therefore, leaf respiration in the dark and in the light must also be considered to obtain an accurate C-balance estimate. Indeed, leaf respiration occurs continuously and even small changes in this process can result in substantial variation in the plant C-balance and, hence, in growth and yield (Poni et al. 2009; Flexas et al. 2010; Griffin and Heskel 2013; Tomás et al. 2014). Moreover, leaf respira-tion is positively correlated to leaf N concentrarespira-tion due to the links between the tricarboxylic acid pathway and N metabolism (Crous et al. 2012). In this context, Golden and Sunrise Solo could have different leaf respiration rates in response to the contrasting leaf N contents present in the leaves of each genotype (Castro et al. 2014), and could contribute to explain the observed dif-ferences in growth and yield between these cultivars. Therefore, it will be important to quantify respiration rates both in the dark (Rdark) and in the light (Rlight) to bet-ter understand LCB.
High rates of photorespiration in C3 plants such as papaya, supports the efficient uptake of transiently available nitrogen, increasing the N assimilation into organic compounds (Busch et al. 2018). Moreover, in addition to its relevance to N metabolism, photorespi-ration consumes high-energy reductant (four electrons per oxygenation reaction), and thus plays an important role in dissipating excess energy. This serves to miti-gate photoinhibition in high light, and may be crucial to the maintenance of high photosynthetic rates, and a positive C-balance (Wingler et al. 2000; Hochberg et al. 2013). Therefore, changes in photorespiration rates of
papaya genotypes must also be taken into account to better understand the influence of this important physi-ological process on plant growth.
In Brazil, the two most important papaya genotypes are ‘Sunrise Solo’ and Golden, both from Solo group (Trindade et al. 2000). To the best of our knowledge, this is the first work designed to analyse LCB (photo-synthesis, respiration and photorespiration), in different papaya genotypes. Previous study focused on photosyn-thetic rates and maximum quantum yield of primary photochemistry failed to explain the differences in plant growth of Golden and Sunrise Solo genotypes (Castro
et al. 2014). Thus, this work is a step forward, aiming at understand the implications of C-balance in papaya growth and yield. In fact, given the economic impor-tance of papaya crop (Campostrini and Glenn 2007;
Campostrini et al. 2018), it is imperative to better under-stand physiological underpinnings of its growth and pro-duction. Thus, we undertook an investigation with the goal of evaluating whether photorespiration, photosyn-thetic capacity, leaf respiration and, therefore, LCB can affect the growth of papaya plants with contrasting leaf chlorophyll contents. We hypothesize that the Golden genotype has higher leaf respiration rates in both light and dark, negatively impacting LCB, and affecting the growth of plants.
Materials and Methods
Plant material and growth conditions
This study was conducted in a greenhouse at the Universidade Estadual do Norte Fluminense, located in Campos dos Goytacazes, Rio de Janeiro (21°44′47″S; 41°18′24″W), with natural fluctuations of light, tem-perature and relative humidity [see Supporting Information—Fig. S1]. The 147 m2 greenhouse was cov-ered with both 150 µm thick plastic and shading screen, transmitting 60 % of the solar radiation. The east-west oriented structure was closed on all sides with anti-aphid screen. The study was carried out from January to March 2017 (summer season).
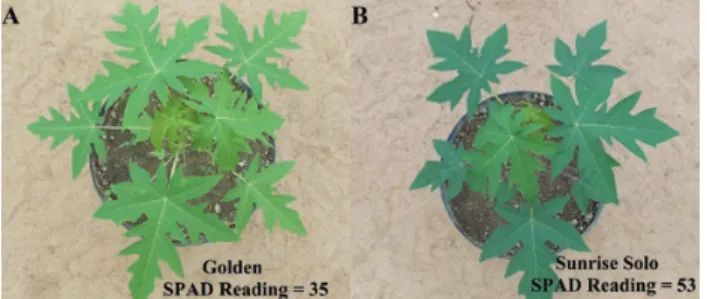
Figure 1. Golden (A) and Sunrise Solo (B) plants used in the
experiment.
Papaya seeds from two different genotypes with con-trasting leaf colour [‘Sunrise Solo’ (intensely green leaves) and Golden (yellowish-green leaves); Fig. 1] were sown in 0.28 L pots inside the greenhouse. Forty-one days after sowing, nine plants of each genotype were transferred to 40 L high-density polyethylene pots (1 plant per pot). Pots were wrapped in a reflective aluminized blanket to avoid soil over-heating. The substrate consisted of soil [Dystrophic Yellow Latosol (Embrapa 2006)], sand and cattle manure (2:1:1, v/v). Fertilization was made during substrate preparation, with a total of 60 g per pot of CaO; 10.2 g per pot of N (NH4+:NO3− ratio = 1.5); 4.5 g per pot of P2O5; 6.6 g per pot of K2O; 0.39 g per pot of Mg; 1.8 g per pot of S; 0.015 g per pot of Cu; 0.138 g per pot of Fe; 0.018 g per pot of Mn; 0.006 g per pot of Mo and 2 g per pot of Fritted Trace Elements (FTE Br-12, Nutriplant Indústria e Comércio S/A, Brazil). All pots were fully irrigated every 2 days to maintain them under field capacity, throughout the entire experiment.
Air temperature and relative humidity were recorded using a data logger (WatchDog Model 450, Spectrum Technologies, Plainfield, IL, USA). Photosynthetic pho-ton flux density (PPFD) was monitored from 25 days after transferring plants to the 40 L pots onward, with a quantum light sensor (model LightScout, Spectrum Technologies, Plainfield, IL, USA) and recorded (WatchDog Model 450, Spectrum Technologies, Plainfield, IL, USA). Air vapour pressure deficit (VPD) was calculated according to Jones (1992). Climate variables are shown in Supporting Information—Fig. S1. Mean values of maximum, average and minimum air tem-peratures throughout the experiment were 31.71, 26.34 and 21.24 °C, respectively. Mean values of maximum, average and minimum relative humidity throughout the experiment were 89.3, 74.1 and 49.10 %, respectively. Mean values of maximum, average and minimum VPD throughout the experiment were 3.08, 1.13 and 0.28 kPa, respectively. Finally, mean values of maximum, average and minimum PPFD throughout the experiment were 613, 260 and 3 µmol m−2 s−1, respectively.
Plant growth
Plant height measured with a ruler, leaf number, and stem diameter measured with a digital calliper (±0.01 mm precision) were determined twice a week, from 15 to 50 days after transferring plants to the 40 L pots, when the length of the central vein of the young-est leaf of each plant was measured. Then, the leaf was tagged so central vein measurements could be taken on the same days as all other morphological measurements through the duration of the experiment. The central leaf vein data were used to calculate the total leaf area of
the plants (m2) throughout the experiment according to the equation proposed by Posse et al. (2009).
Leaf gas exchanges
Leaf gas exchange measurements were made when the central leaf vein measurements reached stable values (at 43 and 44 days after transferring plants, 5–6th leaf below the plant apex). Light response curves of net photosyn-thetic rate (Anet) using a Li-Cor 6400XT portable photo-synthesis infrared gas analyzer (IRGA) system (Li-Cor Inc., Lincoln, NE, USA) were obtained at 0800, 1200 and 1600 h and made as described in Shapiro et al. (2004) taking into consideration the precautions of Pons and Welschen (2002). The system incorporated a CO2 controller which was used to set the CO2 concentration inside the leaf cuvette to 400 µL L−1. The 6 cm2 cuvette was fitted with a red–blue light source (6400-02B). The net photosynthetic rate (Anet), stomatal conductance (gs) and transpiration
rate (E) were determined from the light response curves with 24 levels of PPFD: 1500, 1200, 800, 500, 200, 100, 90, 80, 70 µmol m−2 s−1 and every 5 units between 70 and 0 μmol m−2 s−1. The light compensation point (I
c, PPFD at
which Anet = 0), the incident quantum yield (ΦI, slope of the linear portion of the light response curve, between 0 and 300 μmol m−2 s−1 of PPFD) and maximum photosynthesis (Amax) were obtained from the light response curves.
The rate of respiration in the light (Rlight) was esti-mated using the method originally described in Kok (1948), as the y-axis intercept of a first-order linear regression fitted to Anet-irradiance plots to measure-ments made over the 25–65 µmol m−2 s−1 irradiance range. All gas exchange data were corrected for the increase in intercellular CO2 concentrations (Ci) with
decreasing irradiance, which can result in reduced rates of photorespiration and increased rates of carboxyla-tion (Villar et al. 1994). The correction was applied by adjusting the Rlight through iteration to minimize the intercept of photosynthetic electron transport (J) as a function of irradiance (Kirschbaum and Farquhar 1987). J was calculated according to Farquhar and von Caemmerer (1982):
J = [(4(Anet+(CRlight))(Ci+2Γ∗)]
i− Γ∗)
(1) where Γ* is the CO2 compensation point in the absence of Rlight (von Caemmerer and Farquhar 1981; 38.6 at 25 °C). The rates of oxygenation and carboxylation by RuBisCO (Vo and Vc, respectively) were calculated at intensities of 0 to 1500 μmol m−2 s−1, according to Farquhar and von
Caemmerer (1982):
Vc= 13
ïÅJ 4 ã
+2(Anet+Rlight)
ò
(2)
Vo= 23 ïÅJ 4 ã − (Anet+Rlight) ò (3) The effects of varying atmospheric [O2] or [CO2] on oxy-genation (Vo) and carboxylation (Vc) at each intensity of light used were also calculated according to Farquhar and von Caemmerer (1982):
Vc= [CO2]Vc max [CO2] +Kc Ä 1 +[O2] Ko ä (4) and Vo= [O2]Vo max [O2] +Ko Ä 1 +[CO2] Kc ä (5)
Equations (4) and (5) used the RuBisCO kinetic constants (Kc = 404.9 μmol mol−11; K
o = 278.4 mmol mol−1)
previ-ously determined by Bernacchi et al. (2001) at 25 °C, and calculated Vc max as:
Vc max= Anet[CO− R2]−Γlight∗ [CO2]+Kc 1+[O2]
Kc
(6) Γ* (the CO2 compensation point in the absence of Rlight) depends on the RuBisCO specificity factor, O2 partial pressure and is calculated according to von Caemmerer and Farquhar (1981) for real leaf temperature:
Γ∗= 0.5Vo maxKc[O2] Vc maxKo
(7) Here we use the specificity presented in Cousins et al. (2010), the ambient O2 concentration and the tem-perature response function of Brooks and Farquhar (1985) to determine Γ*. The Vo, Vc and Vc:Vo ratio val-ues reported here were calculated at ambient CO2 concentration.
In order to obtain the rate of respiration in the dark (Rdark), the value of Anet at 0 μmol m−2 s−1 of PPFD was determined at 2000 h. The Anet, gs and E values were
used to calculate the intrinsic WUE (iWUE) and instan-taneous WUE as the slope of the linear relationship between Anet and gs or Anet and E, respectively, at 200, 500, 800, 1200 and 1500 μmol m−2 s−1 of PPFD. In addi-tion, LCB for the experiment was estimated using the following equation:
LCB =R Anet 0800 h+Anet 1200 h+ Anet 1600 h
dark+ Rlight 0800 h + Rlight 1600 h + Rlight 1200 h
(8) where Anet 0800 h; Anet 1200 h; Anet 1600 h are Anet measured at 0800, 1200 and 1600 h, respectively, and at either 1200 or 1500 μmol m−2 s−1 of PPFD. Likewise, R
light 0800 h, Rlight 1200 h and Rlight 1600 h are respiration Rlight measured at 0800, 1200 and 1600 h, respectively.
All gas exchange measurements were taken at a rel-ative humidity of ~30 % by manipulating the amount of air passing through a drying column prior to entering the leaf cuvette. The Li-Cor cuvette block temperature was set to 28 °C for all measurements to account for the influences of leaf temperature on gas exchange vari-ables. In addition, the flow rate was kept at 300 µmol m−2 s−1.
Chlorophyll a fluorescence—Soil Plant Analysis
Development and JIP-test measurements
Soil Plant Analysis Development (SPAD) values and Chlorophyll a fluorescence were measured on the same intact leaves used for the gas exchange measurements and on the same days, also at 0800, 1200 and 1600 h. Five SPAD values were averaged in the same sampled leaf, using the SPAD-502 Chlorophyll Meter (Minolta Co. Ltd, Osaka, Japan). Maximum quantum yield of primary photochemistry (Fv/Fm) and the performance index [PI— energy cascade processes from the first light absorption event until plastoquinone reduction (Strasser et al. 2004)] was measured using a non-modulated fluorimeter model Pocket PEA (Plant Efficiency Analyser, Hansatech, King’s Lynn, Norfolk, UK). The leaves were dark-adapted for ca. 30 min using leaf clips (Plant Efficiency Analyser, Hansatech, King’s Lynn, Norfolk, UK) so that all reaction centres of photosystem II (PSII) acquired an ‘open’ sta-tus, and heat loss was minimal (Strasser et al. 2000).
The JIP-test equations (Strasser and Strasser 1995;
Strasser et al. 1995; Strasser and Tsimilli-Michael 2001;
Strasser et al. 2004) were applied to calculate: the effec-tive antenna size of an aceffec-tive reaction centre (RC) (ABS/ RC); the maximal trapping rate of PSII (TR0/RC); the elec-tron transport in an active RC (ET0/RC); the effective dis-sipation of an active RC (DI0/RC); the electron transport probability (ET0/TR0); the quantum yield of electron trans-port (ET0/ABS); the number of photons absorbed by an excited PSII cross-section (ABS/CS0); the maximal trap-ping rate in a PSII cross-section (TR0/CS0); the electron transport in a PSII cross-section (ET0/CS0); the fraction of active reaction centres per excited cross-section of leaf (RC/CS0); and the area above the fast fluorescence rise.
Photosynthetic pigments, dry weight and nitrogen
content
At 80 days after transferring plants, leaves, stems, peti-ole and roots were collected, dried in a forced-air oven at 70 °C for 72 h and weighed to determine the leaf, petiole, stem and root dry weights. The leaf, petiole, stem and root dry weight values were then used to cal-culate both the biomass allocation (%) and the relation
between shoot (leaf dry weight + shoot dry weight + pet-iole dry weight) and root dry weights (root dry weight/ shoot dry weight).
The same leaves used for gas exchange measure-ments were collected separately in order to determine the photosynthetic pigment contents. Therefore, five leaf discs (each 28.26 mm2) were cut into fine strips and placed in a test tube containing 5 mL dimethyl sulfoxide. The test tubes were then incubated at 70 °C for 30 min in the dark. After cooling the extract in the dark, a 3 mL ali-quot was analysed spectrophotometrically at 480, 649 and 665 nm (Beckman DU640; Varian, Walnut Creek, CA, USA). Contents of chlorophyll a, chlorophyll b and total carotenoid were calculated according to Wellburn (1994). The remaining parts of the leaves were dried in a forced-air oven at 70 °C for 72 h. Dried leaves were then weighed and ground in a Wiley mill with 20 mesh sieve (Thomas Wiley® Mini-Mill Cutting Mill, Swedesboro, NJ, USA). Leaf powdered aliquots (200 mg) were then sol-ubilized in a solution of sulphuric acid (98 %) in order to determine the level of N according to Kjeldahl semi-micro method (Malavolta et al. 1997).
Statistical analysis
A completely randomized design was used with both genotypes as treatments. Nine replicates were used for both growth and dry weight measurements, totalling 18 plots (plants). Gas exchange, SPAD readings, Chlorophyll a fluorescence, photosynthetic pigments and nitrogen content measurements were performed in four rep-licates, totalling eight plots. In order to compare two groups of normally distributed data (two genotypes), dry weight measurements, gas exchange traits, photo-synthetic pigment traits and nitrogen content data were analysed by Student’s unpaired t-test at 5 % probability. Although gas exchange measurements were performed throughout the day, comparisons by the t-test were made within each measurement time only. For chloro-phyll a fluorescence data and SPAD readings, a complete randomized design in a split plot scheme was used with 2 genotypes × 3 measurement times × 4 replications, in order to compare both the differences between geno-types within each measurement time, and the differ-ences in these traits among the three measurement times within each genotype. Chlorophyll a fluorescence data and SPAD readings were then subjected to analysis of variance tests and the mean pairwise comparisons made using the Tukey HSD test at 5 % probability. Linear regression slopes for WUE (Anet vs. E), iWUE (Anet vs. gs), ΦI
(Anet vs. PPFD), plant height, leaf number, stem diameter and total leaf area were calculated. Statistical analysis was made using the software Sisvar 5.6.
Results
Plant growth
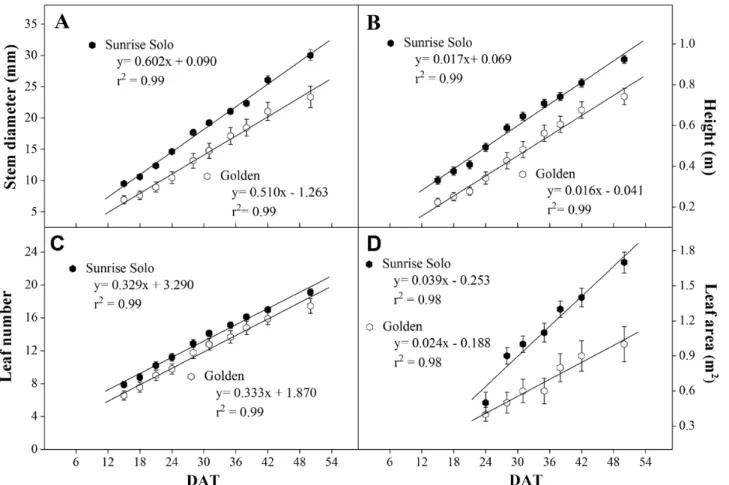
Sunrise Solo genotype plants had larger stem diameter, height, number of leaves and leaf area throughout the experiment (Fig. 2). Regarding stem diameter, the dif-ference between genotypes increased with time since Sunrise Solo stem diameter growth rate was 14.5 % higher. That led to a difference between genotypes of ca. 4 mm at 15 days after transferring plants to ca. 8 mm at 54 days after transferring plants (Fig. 2A). Both gen-otypes had similar plant height and leaf number incre-ment rates (ca. 0.02 m day−1 and ca. 3–4 leaves each 10 days, respectively; Fig. 2B and C). However, despite the lack of genotypic differences in the number of leaves maintained, total leaf area was increasingly different. Sunrise Solo plants had a higher total leaf area growth rate (0.039 m2 day−1) than the Golden genotype (0.024 m2 day−1), that is, a 63 % higher rate in leaf area evolution (Fig. 2D). In addition, Sunrise Solo had significantly higher root, leaf, petiole and stem dry weights than Golden (ca. 66, 46, 53 and 51 % higher, respectively; Fig. 3B).
Photoassimilates were allocated primarily to the leaves in both genotypes (ca. 44 and 39 % in Golden and Sunrise Solo, respectively), as reflected by biomass allo-cation (Fig. 3A). Less biomass (ca. 33 %) was allocated to the roots in Golden than Sunrise Solo (Fig. 3A). Likewise, Golden had significantly lower root dry weight:shoot dry weight ratio (ca. 33 %; Fig. 3C) and shoot dry weight (ca. 50 %) than Sunrise Solo (Fig. 3D).
Leaf gas exchanges
At 1200 h, only for the highest provided irradiance (1500 μmol m−2 s−1) the Sunrise Solo genotype had a sig-nificantly higher Anet than Golden (ca. 17 vs. ca. 14 μmol CO2 m−2 s−1, respectively) (Fig. 4D). Furthermore, no sig-nificant differences were observed both 0800 and 1600 h for any of applied irradiances (Fig. 4A and G).
Ic values from Sunrise Solo did not vary throughout the day (ca. 12 μmol m−2 s−1), whereas they changed from ca. 13 μmol m−2 s−1 (0800 and 1600 h) to ca. 17 μmol m−2 s−1 (1200 h) in Golden (see Fig. 4 legend). Furthermore, no significant differences were observed in ΦI, although mean values were higher at 0800 h in both genotypes (Fig. 4A, D and G).
Golden had significantly higher gs and E values than Sunrise Solo at 0800 h, at PPFD higher than 200 μmol m−2 s−1 (Fig. 4B and C). Golden maintained somewhat higher values of gs and E throughout the day, although without significant differences (Fig. 4E, F, H and I). Both genotypes had considerably lower gs and E values (ca.
16 and 33 %, respectively) at 1600 h in relation to the measurements taken earlier in the day.
As a consequence of the observed variation in Anet, gs and E, Sunrise Solo had a 42 % higher iWUE and 30 % higher WUE than Golden [see Supporting Information— Table S1].
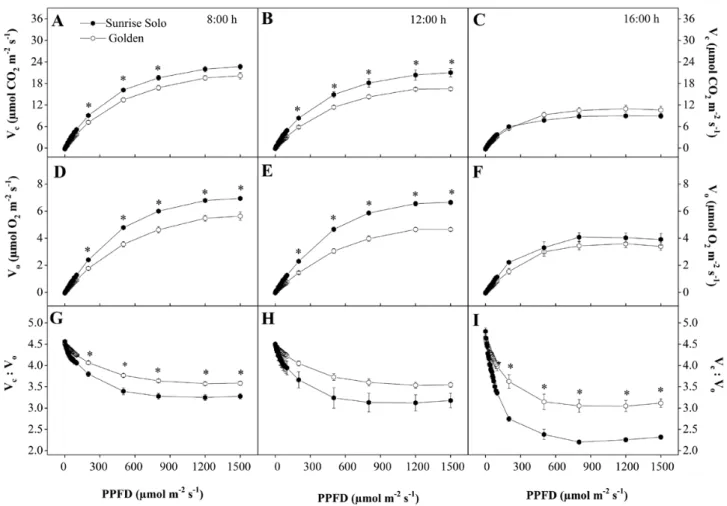
Following the Anet pattern, Vc values were higher in Sunrise Solo than in Golden plants at both 0800 and 1200 h, and these differences were statistically sig-nificant at PPFD ranging from 200 to 800 μmol m−2 s−1 (0800 h) and from 200 to 1500 μmol m−2 s−1 (1200 h) (Fig. 5A and B). These differences were ca. 17 % at 0800 h and ca. 23 % at 1200 h. Sunrise Solo plants also showed higher Vo values than Golden plants at
PPFD values greater than 200 μmol m−2 s−1, at both 0800 and 1200 h (ca. 22 and 32 %, respectively, Fig. 5D and E). No significant differences between geno-types were observed in either Vc or Vo at 1600 h (Fig. 5C
and F). Regarding the Vc:Vo ratio, Golden showed 8 %
higher values than Sunrise Solo at 0800 h and 26 % higher values at 1600 h, when irradiances greater than 200 μmol m−2 s−1 (Fig. 5G and I).
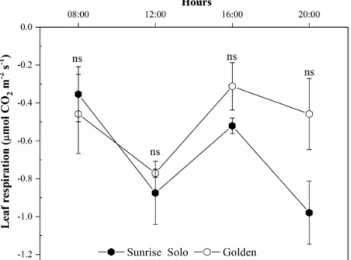
No significant differences were found in Rlight throughout the day, or in Rdark (leaf respiration rates at 2000 h) (Fig. 6), although Golden plants consistently tended to higher values from 1200 h onwards. Likewise, no significant differences between genotypes were ob-served in LCB calculated using Anet values obtained at 1200 μmol m−2 s−1 (Fig. 7), or 1500 μmol m−2 s−1 [see Supporting Information—Fig. S2] of PPFD.
Photosynthetic pigments and nitrogen content,
SPAD values and Chlorophyll a fluorescence
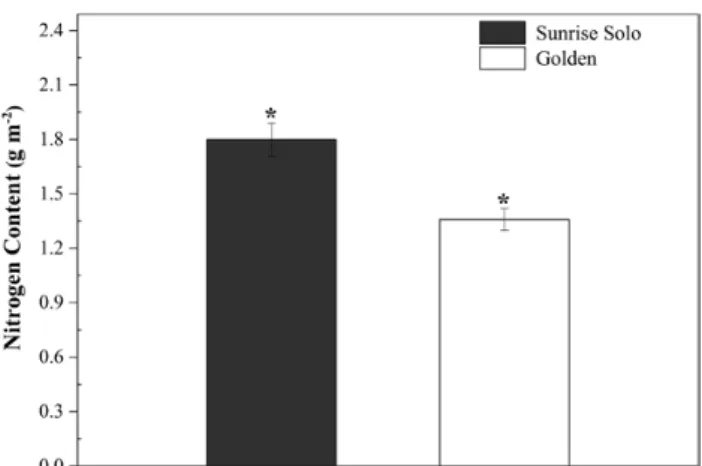
Sunrise Solo showed significantly higher values of chloro-phyll a, chlorochloro-phyll b, total chlorochloro-phyll, carotenoids and total chlorophyll/carotenoids ratio (51, 75, 56, 52 and 9 %, respectively) (Fig. 8A, B, C, E and F), and lower (ca. 48 %) chlorophyll a/chlorophyll b ratio than Golden (Fig. 8D). In line with the higher content in photosynthetic pigments, greater leaf N content was also observed in Sunrise Solo (ca. 11 % greater, Fig. 9). Greater leaf pig-ments and N content resulted in higher SPAD values in Sunrise Solo than Golden plants [see Fig. 1 and Supporting Information—Table S2].
Figure 2. Stem diameter (A), height (B), leaf number (C) and leaf area (D) of two Carica papaya genotypes (Golden and Sunrise Solo) along the
experiment (DAT—days after transfer to 40 L pots). Each treatment mean represents the average of nine replicates.
Overall, both genotypes showed a small variation along the diurnal period for chlorophyll a fluorescence parameters [see Supporting Information—Table S2]. With the exception of the ABS/CS0 (both genotypes), ET0/ RC and RC/CS0 (Sunrise Solo), no significant differences were observed among measurements (0800, 1200 and 1600 h).
Regarding the differences between genotypes, no sig-nificant differences were found in ABS/RC, DI0/RC, RC/ CS0 and ABS/CS0, but Sunrise Solo showed higher values than Golden for TR0/RC (0800 h), ET0/RC, ET0/TR0, TR0/CS0, ET0/CS0, Fv/Fm, SPAD and PI throughout the day, as well as larger area at 1200 and 1600 h.
Discussion
The leaves of Golden showed lower N allocation, photo-synthetic pigments (Figs 8 and 9) and, likely, photochem-ical components than Sunrise Solo leaves as previously reported (Castro et al. 2014). This lower investment agreed with the lowered TR0/RC, ET0/RC, ET0/TR0, ET0/ABS, TR0/CS0, ET0/CS0, PI, photochemical efficiency (Fv/Fm) and
SPAD values [see Supporting Information—Table S2]. Such lower investment in photochemical components will limit the photochemical energy production needed to both carboxylation and oxygenation reactions of RuBisCO (Escalona et al. 1997; Hymus et al. 2001;
Aranjuelo et al. 2005; Lambreva et al. 2005; Erice et al. 2006; Silva et al. 2017). In fact, reduced photochemical capacity has been related to reduced chlorophyll con-tents in other species (Eckardt 2009; Akram and Ashraf 2011). Moreover, in Golden plants, the observed Fv/Fm ratio remained <0.69, indicating a reduced photochem-ical efficiency [see Supporting Information—Table S2]. Thus, PSII reaction centres might have been im-paired, that is, either damaged or inactivated (Baker and Rosenqvist 2004; Zlatev 2009; Rodrigues et al. 2016), impartially contributed to blocking electron transfer be-tween the acceptors (Shu et al. 2012). In fact, a large portion of leaf N is typically associated with chlorophyll, and specifically to the photosystem I and II cores, and their light-harvesting complexes (Walker et al. 2017). Still, these authors observed the maintenance of con-trol rates of canopy photosynthesis in soybean despite a 9 % decrease in leaf N allocation and corresponding Figure 3. Biomass allocation (A); dry weight (B) of roots, stem, petioles and leaves; root dry weight:shoot dry weight ratio (C); and shoot dry
weight (D) of two Carica papaya genotypes (Golden and Sunrise Solo). Each column represents the mean of nine replicates. * indicates signifi-cant statistical difference by unpaired Student’s t-test at 5 % probability.
decreased chlorophyll. In leaves from Golden plants, the reduction in N content (25 %) and total chlorophyll (−56 %) were even stronger, supporting the proposed impacts on photochemical functions as reflected in the above-mentioned fluorescence parameters and, more moderately, in the observed Anet (0800 and 1200 h). Additionally, the investment in biochemical components might have been affected, particularly RuBisCO, which is known to be one of the most important N-containing mol-ecules in plant cells (Lawlor 1993; Griffin and Seemann 1996; Zhang et al. 2008; Sage 2013). Together these ef-fects could explain the lower Vc and Vo values observed in Golden leaves (Fig. 4). Notably, the impacts in the photo- and biochemical functioning in Golden plants did not sig-nificantly affect net CO2 uptake through photosynthesis (Anet, ΦI and Ic; Fig. 4). It is important to point out that although at 1200 h, Sunrise Solo had significantly higher
Anet at 1500 μmol m−2 s−1 of PPFD (given by the IRGA system) than did Golden (Fig. 4), the maximum ambient PPDF value observed throughout this work was only 882 μmol m−2 s−1 [see Supporting Information—Fig. S1]. Therefore, the better Anet response of Sunrise Solo to the high PPFD intensities (~1500 μmol m−2 s−1) at midday cannot be associated to its improved growth when compared to Golden. However, although there were no significant differences between genotypes, it must be underlined that a consistent tendency for higher Anet values in Sunrise Solo was observed along the day when compared to Golden, from 200 up to 1500 µmol m−2 s−1, except for the last daytime measurements. Therefore, although the net photosynthetic rates did not statistic-ally differ between genotypes, we cannot discard the possibility of a cumulative effect, that is, that a sum of a marginal difference can have some impact after a long Figure 4. Net photosynthetic rate (Anet—A, D and G), stomatal conductance (gs—B, E and H), transpiration (E—C, F and I) of two Carica papaya genotypes (Golden and Sunrise Solo) at 0800 (A, B and C), 1200 (D, E and F) and 1600 h (G, H and I). Each point represents the mean of four replicates. Bars represent the standard error. * indicates significant statistical difference for the same PPFD by unpaired Student’s t-test at 5 % probability. Golden and Sunrise Solo light compensation points (Ic, µmolPPFD m−2 s−1) were, respectively, 13.27 and 12.40 at 0800 h; 17.33
and 12.58 at 1200 h; and 13.03 and 12.76 at 1600 h. Golden and Sunrise Solo maximum photosynthesis values (Amax, µmolCO2 m−2 s−1) were,
respectively, 17.65 and 18.77 at 0800 h; 14.50 and 17.15 at 1200 h; and 8.77 and 5.99 at 1600 h. Golden and Sunrise Solo incident quantum yield values (ΦI, µmolCO2/µmolPPFD) were, respectively, 0.032 and 0.041 at 0800 h; 0.026 and 0.037 at 1200 h; and 0.025 and 0.025 at 1600 h.
time period. Such small differences, day after day over a long period, can contribute to some extend to the dif-ferences in leaf area investment. The latter can in turn result in greater C-assimilation at whole canopy scale, contributing to the higher yields in Sunrise Solo than in Golden. Specifically, greater Anet values at midday could contribute to improve Sunrise Solo growth under field conditions in the tropics, where such conditions are ob-served thought most part of the year.
The higher stomatal conductance of the Golden plants seemed not to affect Anet (Fig. 4). Nonetheless, the higher gs and E, together with similar Anet val-ues of Golden compared to Sunrise Solo leaves resulted in reduced iWUE and WUE [see Supporting Information—Table S2]. Lower WUE confirm ear-lier results (Torres-Netto et al. 2009), and could also be related to observed lower chlorophyll content. In soybean, reduced pigmentation in mutants linked to increase in gs and reduced iWUE and integrated canopy WUE (Slattery et al. 2017). However, since no water limitation was imposed in the present work, we cannot relate the lower growth observed in Golden
(Figs 2 and 3) to either iWUE or WUE, or any result-ing reduction in plant water availability. Indeed, since gs means were always higher in Golden plants (Fig. 4),
our results show no indications of water stress in this genotype. Previous work published by our research group showed that water-stressed papaya plants dra-matically reduced their gs to values close to 0.06 mol
m−2 s−1 at midday at 1500 μmol m−2 s−1 of PPFD (Lima
et al. 2015). Such low gs values were not observed in our work (Fig. 4E), confirming that our plants did not experience water stress throughout the experiment. Also, abscisic acid concentrations increase in papaya roots under water stress, stimulating root-system growth (Mahouachi et al. 2007). Thus, if Golden plants had experienced water stress, we would not have observed the low root dry weight values in Golden (Fig. 3B). Indeed, all pots were fully irrigated until satura-tion and plants were cultivated in 40 L pots, so that there was no limitation to root-system growth (as vis-ually observed by taking the plants out of the pots at the end of the experiment).
Figure 5. RuBisCO carboxylation (Vc—A, B and C) and oxygenation (Vo—D, E and F) rates and Vc:Vo ratio (G, H and I) of two Carica papaya genotypes (Golden and Sunrise Solo) at 0800 (A, B and C), 1200 (D, E and F) and 1600 h (G, H and I). Each point represents the mean of four replicates. Bars represent the standard error. * indicates significant statistical difference by unpaired Student’s t-test at 5 % probability.
In addition, no significant effects either on leaf respir-ation (Fig. 5) or on LCB (Fig. 7) were observed between the studied genotypes. Higher LCB values typically rep-resent more carbon available for plant growth (Flexas
et al. 2006; Escalona et al. 2012; Ayub et al. 2014). Nonetheless, Sunrise Solo presented higher growth and biomass production than Golden (Figs 2 and 3), despite the absence of large significant differences in Anet, ΦI, Ic, leaf respiration and, consequently, LCB (Figs 4, 6 and 7). Such results show that Sunrise Solo had a higher in-herent capacity to convert the available C into biomass than Golden and/or that biomass construction costs are
higher in Golden. These findings contradict our initial hypothesis, and thus we suggest that physiological pro-cesses other than photosynthesis, leaf respiration and, therefore, LCB are likely to be involved in reduced bio-mass measured in Golden (Figs 2 and 3). There appears to be an inherent stoichiometry among the various physio-logical components of the LCB and within the photosyn-thetic machinery that constrain the conversion of light energy into biomass. Thus, even though both genotypes present similar values of LCB, less biomass is produced in Golden (Figs 2, 3 and 7). Possibly other carbon losses are involved. For example, isoprene emission may be in-volved and could reduce yield of the Golden genotype. Indeed, in higher plants, almost all of the carbon used to produce isoprene comes directly from photosynthetic intermediates, reducing the amount of C available for plant growth (Loreto and Fineschi 2014).
Although ca. 45 % of the dry weight of plants consists of C, biomass production strongly depends on N to syn-thesize several important molecules (Marschner 1995), such as chlorophylls and RuBisCO, as well as proteins, nucleic acids and various enzymatic cofactors (Griffin
Figure 6. Leaf respiration rates in the light, Rlight (at 0800, 1200 and
1600 h) and in the dark, Rdark (at 2000 h) of two Carica papaya
geno-types (Golden and Sunrise Solo). Each point represents the mean of four replicates. Bars represent the standard error. ns indicates no statistical difference by unpaired Student’s t-test at 5 % probability.
Figure 7. Leaf carbon balance of two Carica papaya genotypes
(Golden and Sunrise Solo) calculated using net photosynthetic rates (Anet) at 1200 μmol m−2 s−1 of PPFD. Each column represents
the mean of four replicates. Bars represent the standard error. ns indicates no statistical difference by unpaired Student’s t-test at 5 % probability.
Figure 8. Changes in content of chlorophyll a (A), chlorophyll b (B),
total chlorophyll (C), chlorophyll a:chlorophyll b ratio (D), total ca-rotenoids (E) and total chlorophyll:total caca-rotenoids ratio (F) of two
Carica papaya genotypes (Golden and Sunrise Solo). Each column
represents the mean of four replicates. * indicates significant stat-istical difference by unpaired Student’s t-test at 5 % probability within the same day.
and Seemann 1996; Zhang et al. 2008; Sage 2013). Since Golden had lower leaf N content than Sunrise Solo (Fig. 9), we suggest that the lower biomass of Golden may be related to either lower N assimilation through the meta-bolic pathways, which may indirectly affect growth (Figs 2 and 3). Indeed, plants can increase nitrogen assimila-tion via the photorespiratory pathway, fixing carbon as amino acids in addition to carbohydrates (Busch et al. 2018). The higher Vo and lower Vc:Vo ratio in Sunrise Solo (Figs 5 and 9) might support higher rates of photores-piration, which in turn, could enable higher rates of N integration in organic compounds (Busch et al. 2018). This would justify the observed higher leaf N content, stronger biomass accumulation, and, future, higher yields observed in Sunrise Solo, as compared to Golden (Caliman Agrícola, Linhares, Espiríto Santo, Brazil, pers. comm.). Moreover, the reduction of NO3− to NH4+ asso-ciated with photorespiratory nitrogen assimilation is a strong sink of both electrons and reducing power which are photochemically created (Busch et al. 2018), and could explain why the improved photochemical capacity of Sunrise Solo [see Supporting Information—Table S2] did not result in higher CO2 uptake rates (Anet) (Fig. 4).
Additionally, nitrate reductase is a key enzyme re-lated to plant growth (e.g. Falxa-Raymond et al. 2012), that can be down-regulated under low N availability. We suggest that the lower N content in Golden leaves (Fig. 9) may be the result of having less reducing power avail-able for NO3− reduction, and the subsequent impairment of amino acid metabolism and therefore, plant growth. Indeed, Golden leaves had only ca. 37 mg N kg−1 dry weight (1.3 g m−2; Fig. 9), whereas a range of 45–55 g N kg−1 dry weight has been considered adequate for pa-paya leaves (Viégas 1997). The effects of nitrate reduc-tase activity on Golden physiology and growth require
further investigations as the effective cultivation of this genotype is likely to be affected by this enzyme activity. Finally, although the reduction in leaf chlorophyll con-tent in Golden has been associated with reduced growth and leaf N content, the lack of change in photosynthetic carbon assimilation may indicate that papaya plants typ-ically produce a ‘luxury’ leaf chlorophyll concentration. This information can be used in breeding programmes with the objective of increasing nitrogen use efficiency (NUE) (Anet/Nleaf) and avoiding heavy applications of N in papaya fields for higher profitability and better environ-mental sustainability.
In conclusion, this study provides the first com-plete picture of LCB in two economically important genotypes of papaya and demonstrates that neither stomatal effects nor reduced photochemical and car-boxylation capacities of Golden genotype affected CO2 assimilation through photosynthesis. Nonetheless, the accumulation of small differences in photosyn-thesis, day after day, over a long period, might con-tribute to some extend to a higher C-budget in Sunrise Solo, higher leaf area and, thus, to higher productiv-ity. Additionally, we consider that physiological pro-cesses other than photosynthesis and leaf respiration (LCB) can be as well involved in the lower growth and yield of Golden. One of these aspects could be related to the higher rates of photorespiration observed in Sunrise Solo, which could improve the rate of N assimi-lation into organic compounds, such as amino acids, thus contributing to the higher biomass production in Sunrise Solo relative to Golden. However, further experiments to evaluate the effects of N metabolism on Golden physiology and growth, as well as measure-ments of the whole canopy gas exchange and phy-tohormonal balance are required as these have the potential to affect both growth and yield. In addition, assessments of respiration of trunk and root biomass should be made in both genotypes.
Sources of Funding
This research was funded by Coordenação de Aperfeiçoamento de Pessoal de Nível Superior - CAPES and Fundação Carlos Chagas de Apoio à Pesquisa do Estado do Rio de Janeiro - FAPERJ (grant E-26/202.323/2017 to W.P.R.), and Conselho Nacional de Desenvolvimento Científico e Tecnológico (CNPq) (fellowship 300996/2016-0 to E.C.), all from Brazil. The authors wish to thank the support Portuguese national funds from Fundação para a Ciência e a Tecnologia through the research units UID/AGR/04129/2013 (LEAF) and UID/GEO/04035/2013 (GeoBioTec).
Figure 9. Nitrogen content of two Carica papaya genotypes (Golden
and Sunrise Solo). Each column represents the mean of four rep-licates. * indicates significant statistical difference by unpaired Student’s t-test at 5 % probability within the same day.
Contributions by the Authors
J.S.P., J.R.S., K.F.R., W.P.R., J.A.M.F., K.L.G. and E.C. designed the study. J.S.P., J.R.S., K.F.R., W.P.R., W.P.B., D.P.A. and L.S.F. performed the experiment. J.S.P., J.R.S., K.F.R., W.P.R., J.C.R. and E.C. analysed the data. J.S.P., J.R.S., K.F.R., W.P.R., J.A.M.F., J.C.G., K.L.G., J.C.R. and E.C. wrote the manuscript. All the authors revised the manuscript.
Conflict of Interest
None declared.
Acknowledgements
The authors are thankful to Dr D. Ort (University of Illinois) for critical review and suggestions.
Supporting Information
The following additional information is available in the online version of this article—
Figure S1. Average, minimum and maximum air temper-ature (A), relative humidity (B), photosynthetic photon flux density (PPFD, from 6:30 am to 5:30 pm) (C) and air vapour pressure deficit (VPD) (D) throughout the experi-ment. Arrows indicate the days gas exchange variables were measured.
Figure S2. Leaf carbon balance (LCB) of two Carica papaya genotypes (Golden and Sunrise Solo) calculated using net photosynthetic rates (Anet) at 1500 μmol m−2 s−1 of photosynthetic photon flux density. Each column represents the mean of four replicates. Bars represent the standard error. ns indicates no statistical difference by unpaired Student’s t-test at 5 % probability.
Table S1. Intrinsic water use efficiency (iWUE) and instantaneous water use efficiency (WUE) of two Carica papaya genotypes—Golden and Sunrise Solo (n = 12). Table S2. Changes in SPAD readings and in the fluores-cence parameters obtained from a JIP-test analysis of two Carica papaya genotypes—Golden (G) and Sunrise Solo (SS) (n = 4).
Literature Cited
Akram NA, Ashraf M. 2011. Pattern of accumulation of inorganic elements in sunflower (Helianthus annuus L.) plants subjected to salt stress and exogenous application of 5-aminolevulinic acid. Pakistan Journal of Botany 43:521–530.
Aranjuelo I, Pérez P, Hernández L, Irigoyen JJ, Zita G, Martínez-Carrasco R, Sánchez-Díaz M. 2005. The response of nodulated alfalfa to water supply, temperature and elevated CO2:
photo-synthetic down-regulation. Physiologia Plantarum 123:348–358.
Ayub G, Zaragoza-Castells J, Griffin KL, Atkin OK. 2014. Leaf respir-ation in darkness and in the light under pre-industrial, current and elevated atmospheric CO2 concentrations. Plant Science
226:120–130.
Baker NR, Rosenqvist E. 2004. Applications of chlorophyll fluor-escence can improve crop production strategies: an exam-ination of future possibilities. Journal of Experimental Botany
55:1607–1621.
Bernacchi CJ, Singsaas EL, Pimentel C, Portis AR, Long SP. 2001. Improved temperature response functions for models of Rubisco-limited photosynthesis. Plant, Cell & Environment
24:253–259.
Brooks A, Farquhar GD. 1985. Effect of temperature on the CO2/O2
specificity of ribulose-1,5-bisphosphate carboxylase/oxygenase and the rate of respiration in the light: estimates from gas-exchange measurements on spinach. Planta 165:397–406.
Busch FA, Sage RF, Farquhar GD. 2018. Plants increase CO2 uptake
by assimilating nitrogen via the photorespiratory pathway.
Nature Plants 4:46–54.
Campostrini E, Glenn DM. 2007. Ecophysiology of papaya: a review.
Brazilian Journal of Plant Physiology 19:413–424.
Campostrini E, Schaffer B, Ramalho JC, Cuevas J, Rodrigues WP, da Silva JR, Lima RS. 2018. Environmental factors controlling carbon assimilation growth, and yield of papaya (Carica papaya L.) under water-scarcity scenarios. In: Tejero IFG, Zuazo VHD, eds. Water scarcity and sustainable agriculture in semiarid
envir-onment. London, UK: Academic Press, 481–505.
Carelli ML, Fahl JI, Ramalho JC. 2006. Aspects of nitrogen me-tabolism in coffee plants. Theoretical and Experimental Plant
Physiology (ex-Brazilian Journal of Plant Physiology) 18:9–21.
Carr MKV. 2014. The water relations and irrigation requirements of papaya (Carica papaya L.). A review. Experimental Agriculture
50:270–283.
Castro FA, Campostrini E, Torres-Neto A, Gomes MMA, Ferraz TM, Glenn DM. 2014. Portable chlorophyll meter (PCM-502) values are related to total chlorophyll concentration and photosyn-thetic capacity in papaya (Carica papaya L.). Theoretical and
Experimental Plant Physiology 26:201–210.
Costa AFS, Pacova BEV. 2003. Caracterização de cultivares, estraté-gias e perspectivas do melhoramento genético do mamoeiro. In: Martins DS, Costa AFS, eds. A cultura do mamoeiro: Tecnologia
e Produção. Vitória, Brazil: Incaper, 59–102.
Cousins AB, Ghannoum O, von Caemmerer S, Badger MR. 2010. Simultaneous determination of rubisco carboxylase and oxygenase kinetic parameters in Triticum aestivum and Zea
mays using membrane inlet mass spectrometry. Plant, Cell & Environment 33:444–452.
Crous KY, Zaragoza-Castells J, Ellsworth DS, Duursma RA, Löw M, Tissue DT, Atkin OK. 2012. Light inhibition of leaf respiration in field-grown Eucalyptus saligna in whole-tree chambers under elevated atmospheric CO2 and summer drought. Plant, Cell &
Environment 35:966–981.
Eckardt NA. 2009. The future of science: food and water for life. The
Plant Cell 21:368–372.
Empresa brasileira de pesquisa agropecuaria - EMBRAPA. Centro Nacional de Pesquisa do Solo. 2006. Sistema brasileiro de
classi-ficação de solos, 2nd edn. Rio de Janeiro, Brazil: Embrapa Solos.
Erice G, Irigoyen JJ, Pérez P, Martínez-Carrasco R, Sánchez-Díaz M. 2006. Effect of elevated CO2, temperature and drought on
photosynthesis of nodulated alfalfa during a cutting regrowth cycle. Physiologia Plantarum 126:458–468.
Escalona J, Delgado E, Medrano H. 1997. Irrigation effects on grape-vine photosynthesis. Acta Horticulturae 449:449–455.
Escalona JM, Tomàs M, Martorell S, Medrano H, Ribas-Carbo M, Flexas J. 2012. Carbon balance in grapevines under different soil water supply: importance of whole plant respiration. Australian
Journal of Grape and Wine Research 18:308–318.
Falxa-Raymond N, Patterson AE, Schuster WS, Griffin KL. 2012. Oak loss increases foliar nitrogen, δ(15)N and growth rates of Betula
lenta in a northern temperate deciduous forest. Tree Physiology
32:1092–1101.
FAOSTAT. 2016. FAO data for agriculture: statistics database. http:// faostat.fao.org/site/339/default.aspx (20 May 2018).
Farquhar GD, von Caemmerer S. 1982. Modelling of photosynthetic response to environmental conditions. In: Lange OL, Nobel PS, Osmond CB, Ziegler H, eds. Encyclopedia of plant physiology.
Physiological plant ecology II. Water relations and carbon assimi-lation, Vol. 12B. Berlin, Germany: Springer, 551–587.
Ferraz TM, Rodrigues WP, Torres Netto A, Reis FO, Peçanha AL, Figueiredo FAMMA, Sousa EF, Glenn DM, Campostrini E. 2016. Comparison between single-leaf and whole-canopy gas ex-change measurements in papaya (Carica papaya L.) plants.
Scientia Horticulturae 209:73–78.
Flexas J, Bota J, Galmés J, Medrano H, Ribas-Carbo M. 2006. Keeping a positive carbon balance under adverse conditions: responses of photosynthesis and respiration to water stress. Physiologia
Plantarum 127:343–352.
Flexas J, Galmés J, Gallé A, Gulías J, Pou A, Ribas-Carbó M, Medrano H. 2010. Improving water use efficiency in grape-vines: potential physiological targets for biotechnological im-provement. Australian Journal of Grape and Wine Research
16:106–121.
Foyer CH, Shigeoka S. 2011. Understanding oxidative stress and antioxidant functions to enhance photosynthesis. Plant
Physiology 155:93–100.
Griffin KL, Heskel M. 2013. Breaking the cycle: how light, CO2 and O2
affect plant respiration. Plant, Cell & Environment 36:498–500.
Griffin KL, Seemann JR. 1996. Plants, CO2 and photosynthesis in the
21st century. Chemistry & Biology 3:245–254.
Hikosaka K, Terashima I. 1995. A model of the acclimation of photosynthesis in the leaves of C3 plants to sun and shade with
respect to nitrogen use. Plant, Cell & Environment 18:605–618.
Hochberg U, Degu A, Fait A, Rachmilevitch S. 2013. Near isohydric grapevine cultivar displays higher photosynthetic efficiency and photorespiration rates under drought stress as compared with near anisohydric grapevine cultivar. Physiologia Plantarum
147:443–452.
Hymus GJ, Dijkstra P, Baker NR, Drake BG, Long SP. 2001. Will rising CO2 protect plants from the midday sun? A study of
photoinhibi-tion of Quercus myrtifolia in a scrub-oak community in two sea-sons. Plant, Cell and Environment 24:1361–1368.
Jones HG. 1992. Plant and microclimate: a quantitative approach
to environmental plant physiology. Cambridge: Cambridge
University.
Kirschbaum MU, Farquhar GD. 1987. Investigation of the CO2
de-pendence of quantum yield and respiration in Eucalyptus
pauci-flora. Plant Physiology 83:1032–1036.
Kok B. 1948. A critical consideration of the quantum yield of
Chlorella-photosynthesis. Enzymologial 13:1–56.
Lambreva M, Stoyanova-Kolevab D, Baldjievb G, Tsonev T. 2005. Early acclimation changes in the photosynthetic apparatus of bean plants during short-term exposure to elevated CO2
concentration under high temperature and light intensity.
Agriculture, Ecosystems & Environment 106:219–232.
Lawlor DW. 1993. Photosynthesis - molecular, physiological and
en-vironmental processes, 2nd edn. Essex, UK: Longman Scientific &
Technical.
Lima RSN. Figueiredo FAMMA, Martins AO, Deus BCS, Ferraz TM, Gomes MMA, Sousa EF, Glenn DM, Campostrini E. 2015. Partial rootzone drying (PRD) and regulated deficit irrigation (RDI) effects on stomatal conductance, growth, photosynthetic capacity, and water-use efficiency of papaya. Scientia Horticulturae 183:13–22.
Loreto F, Fineschi S. 2014. Reconciling functions and evolution of isoprene emission in higher plants. The New Phytologist
206:578–582.
Mahouachi J, Arbona V, Gómez-Cadenas A. 2007. Hormonal changes in papaya seedlings subjected to progressive water stress and re-watering. Plant Growth Regulation 53:43–51.
Makino A. 2003. Rubisco and nitrogen relationships in rice. Leaf photosynthesis and plant growth. Soil Science and Plant
Nutrition 49:319–327.
Malavolta E, Vitti GC, Oliveira SA. 1997. Avaliação do estado
nutri-cional das plantas: princípios e aplicações, 2nd edn. Piracicaba,
Brazil: Potafos.
Marschner H. 1995. Mineral nutrition of higher plants. London, UK: Academic Press.
Neeteson JJ. 1995. Nitrogen management for intensively grown ar-able crops and field vegetar-ables. In: Bacon PE, ed. Nitrogen
fer-tilization in the environment. New York: Marcel Dekker, 270–298.
Poni S, Bernizzoni F, Civardi S, Gatti M, Porro D, Camin F. 2009. Performance and water-use efficiency (single-leaf vs. whole-canopy) of well-watered and half-stressed split-root Lambrusco grapevines grown in Po Valley (Italy). Agriculture, Ecosystems
and Environment 129:97–106.
Pons TL, Welschen RAM. 2002. Overestimation of respiration rates in commercially available clamp-on leaf chambers. Complications with measurement of net photosynthesis. Plant, Cell and
Environment 25:1367–1372.
Posse RP, Sousa EF, Bernardo S, Pereira MG, Gottardo RD. 2009. Total leaf area of papaya trees estimated by a nondestructive method. Scientia Agricola 66:462–466.
Ramalho JC, Campos PS, Quartin VL, Silva MJ, Nunes MA. 1999. High irradiance impairments on electron transport, ribulose-1,5-bis-phosphate carboxylase/oxygenase and N assimilation as func-tion of N availability in Coffea arabica L. plants. Journal of Plant
Physiology 154:319–326.
Rodrigues WP, Vieira HD, Campostrini E, Figueiredo FAMMA, Ferraz TM, Partelli FL, Ramalho JC. 2016. Physiological aspects, growth and yield of Coffea spp. in areas of high altitude.
Australian Journal of Crop Science 10:666–674.
Sage RF. 2013. Photorespiratory compensation: a driver for bio-logical diversity. Plant Biology 15:624–638.
Shapiro JB, Griffin KL, Lewis JD, Tissue DT. 2004. Response of
Xanthium strumarium leaf respiration in the light to elevated
CO2 concentration, nitrogen availability and temperature. New
Phytology 162:377–386.
Shu S, Guo SR, Sun J, Yuan LY. 2012. Effects of salt stress on the structure and function of the photosynthetic apparatus in
Cucumis sativus and its protection by exogenous putrescine. Physiologia Plantarum 146:285–296.
Silva JR, Patterson AE, Rodrigues WP, Campostrini E, Griffin KL. 2017. Photosynthetic acclimation to elevated CO2 combined with
par-tial rootzone drying results in improved water use efficiency, drought tolerance and leaf carbon balance of grapevines (Vitis
labrusca). Environmental and Experimental Botany 134:82–95.
Slattery RA, VanLoocke A, Bernacchi CJ, Zhu XG, Ort DR. 2017. Photosynthesis, light use efficiency, and yield of reduced-chlo-rophyll soybean mutants in field conditions. Frontiers in Plant
Science 8:549.
Spreitzer RJ, Salvucci ME. 2002. Rubisco: structure, regulatory inter-actions, and possibilities for a better enzyme. Annual Review of
Plant Biology 53:449–475.
Strasser RJ, Srivastava A, Govindjee. 1995. Polyphasic chloro-phyll a fluorescence transient in plants and cyanobacteria.
Photochemistry and Photobiology 61:32–42.
Strasser RJ, Srivastava A, Tsimilli-Michael M. 2000. The fluorescence transient as a tool to characterize and screen photosynthetic samples. In: Yunus M, Pathre U, Mohanty P, eds. Probing
photo-synthesis: mechanisms, regulation and adaptation. London, UK:
Taylor and Francis, 445–483.
Strasser BJ, Strasser RJ. 1995. Measuring fast fluorescence tran-sients to address environmental questions: the JIP-test. In: Mathis P, ed. Photosynthesis: from light to biosphere. Dordrecht, The Netherlands: Kluwer, 977–980.
Strasser RJ, Tsimilli-Michael M. 2001. Stress in plants, from daily rhythm to global changes, detected and quantified by the JIP-Test, Chim. Nouvelle (SRC) 75:3321–3326.
Strasser RJ, Tsimilli-Michael M, Srivastava A. 2004. Analysis of the chlorophyll fluorescence transient. In: Papageorgiou GC, Govindjee eds. Chlorophyll fluorescence: a signature of
photo-synthesis, advances in photosynthesis and respiration, Vol. 19.
Dordrecht, The Netherlands: Springer, 321–362.
Tomás M, Medrano H, Escalona JM, Martorell S, Pou A, Ribas-Carbó M, Flexas J. 2014. Variability of water use efficiency in grapevines.
Environmental and Experimental Botany 103:148–157.
Torres-Netto A, Campostrini E, da Costa LA, Sousa MA, Ramalho JC, Chaves MM. 2009. Morphological analysis and photosynthetic
performance of improved papaya genotypes. Brazilian Journal
of Plant Physiology 21:209–222.
Trindade AV, Oliveira AAR, Nascimento AS, Oliveira AMG, Rtzinger CHSP, Barbosa CJ, Costa DC, Coelho EF, Santos Filho HP, Oliveira JRP. 2000. Mamão. Produção: aspectos técnicos.
Embrapa mandioca e fruticultura. Brasília, Brazil: Embrapa.
Vass I, Cser K. 2009. Janus-faced charge recombinations in photosystem II photoinhibition. Trends in Plant Science
14:200–205.
Viégas PRA. 1997. Teores de nitrogênio em tecidos foliares, produção
e qualidade de frutos de mamoeiro, em função da adubação nitrogenada. PhD Thesis, Universidade Federal de Viçosa,
Viçosa, Brazil.
Villar R, Held AA, Merino J. 1994. Comparison of methods to esti-mate dark respiration in the light in leaves of two woody spe-cies. Plant Physiology 105:167–172.
Villegas VN. 1997. Carica papaya L. In: Verheij EWM, Coronel RE, eds.
Plant resources of South-East Asia 2: edible fruis and nuts. Bogor,
Indonesia: PROSEA Foundation, 108–112.
von Caemmerer S, Farquhar GD. 1981. Some relationships between the biochemistry of photosynthesis and the gas exchange of leaves. Planta 153:376–387.
Walker BJ, Drewry DT, Slattery RA, VanLoocke A, Cho YB, Ort DR. 2017. Chlorophyll can be reduced in crop canopies with little penalty to photosynthesis. Plant Physiology 176:1215–1232.
Wellburn AR. 1994. The spectral determination of chlorophyll a and b, as well as total carotenoids, using various solvents with spectrophotometers of different resolution. Journal of Plant
Physiology 144:307–313.
Wingler A, Lea PJ, Quick WP, Leegood RC. 2000. Photorespiration: metabolic pathways and their role in stress protection.
Philosophical Transactions of the Royal Society of London. Series B, Biological Sciences 355:1517–1529.
Zhang X, Wollenweber B, Jiang D, Liu F, Zhao J. 2008. Water defi-cits and heat shock effects on photosynthesis of a transgenic
Arabidopsis thaliana moderate water stress and recovery than
isohydric behavior. Plant Soil 359:335–349.
Zlatev Z. 2009. Drought-induced changes in chlorophyll fluores-cence of young wheat plants. Biotechnology 23:437–441.