GROWTH AND SEED YIELD OF SUNFLOWER ON SOIL FERTILIZED WITH
CASSAVA WASTEWATER
1MARA SUYANE MARQUES DANTAS2, MARIO MONTEIRO ROLIM2*, ELVIRA MARIA REGIS PEDROSA2, MANASSÉS MESQUITA DA SILVA2, DANIEL DA COSTA DANTAS2
ABSTRACT- Cassava wastewater is the liquid residue of the cassava flour processing and its application to the soil as fertilizer for agricultural crops is a good alternative to sources of nutrients for plants. In this context, the objective of this work was to evaluate the growth and seed yield of sunflower on soil fertilized with cassava wastewater. A randomized block experimental design with four replications was used, with six cassava
wastewater rates (0, 8.5, 17, 34, 68 and 136 m3 ha-1) and six plant sampling times (15, 30, 45, 60, 75 and 90
days after sowing), using the sunflower cultivar Helio-250. The evaluated variables were total leaf area, leaf
area index, leaf area ratio, specific leaf area, leaf weight ratio, shoot dry mass and sunflower seed yield. The use
of cassava wastewater rate of 136 m3 ha-1 increases the seed yield, leaf area, leaf area index and shoot dry mass,
and results in lower leaf area ratio, specific leaf area and leaf weight ratio of sunflower (cv. Helio-250) crops.
Key words: Helianthus annuus. Manihot esculenta. Liquid residue. Physiological índices.
ANÁLISE DE CRESCIMENTO E PRODUTIVIDADE DO GIRASSOL ADUBADO COM ÁGUA RESIDUÁRIA DA MANDIOCA
RESUMO - A aplicação da manipueira, resíduo liquido do processamento da mandioca, em cultivos agrícolas
apresenta-se como uma boa alternativa como fonte de nutrientes para as plantas. Nesta perspectiva o objetivo
desta pesquisa foi analisar o crescimento e a produtividade de plantas de girassol adubadas com manipueira. O delineamento experimental utilizado foi em blocos ao acaso, com seis doses de manipueira (0; 8,5; 17; 34; 68 e 136 m3ha-1) em quatro repetições, sendo avaliados em seis épocas de amostragens das plantas (15, 30, 45, 60,
75 e 90 dias após a semeadura - DAS), utilizando-se a cultivar de girassol, Helio 250. As variáveis avaliadas foram a área foliar, o índice de área foliar, a razão de área foliar, a área foliar específica, a razão de peso foliar,
a massa seca da parte aérea das plantas e a produtividade. A dose de manipueira igual a 136 m3 ha-1 propiciou
maiores produtividade, área foliar, índice de área foliar e massa seca da parte aérea. Os menores valores de razão de área foliar, área foliar específica e a razão de peso foliar foram obtidos quando se utilizou a dose de 136 m3 ha-1.
Palavras-chave: Helianthus annuus. Manihot esculenta. Resíduo líquido. Índices fisiológicos.
___________________
*Corresponding author
1Received for publication in 04/04/2016; accepted in 01/26/2017.
Paper extracted from the doctoral thesis of the first author.
2Department of Agricultural Engineering, Universidade Federal Rural de Pernambuco, Recife, PE, Brazil; marasuyane@hotmail.com,
INTRODUCTION
Advances in agricultural production systems in recent decades have increased the consumption of inputs and generation of waste by agricultural and
agro-industrial activities, aggravating global
environmental problems such as the destruction of the ozone layer, greenhouse effect and loss of biodiversity; and local problems caused by the impacts of the generation of liquid and solid waste.
The processing for cassava flour production generates solid and liquid residues, from which the cassava wastewater is the most harmful to the environment, due to its high content of organic compounds and of linamarin, which is a cyanogenic glycoside of high toxicity (CAMPOS et al., 2006). However, the nutrient contents of cassava wastewater, especially potassium, magnesium, nitrogen and phosphorus, can be used as soil
bio-fertilizer for agricultural activities (CARDOSO
et al., 2009).
Adding value to agricultural and
agro-industrial waste can contributes to a more
sustainable economic and social development. Therefore, the use of cassava wastewater in agriculture can be a viable alternative to source nutrients for plants and reduce environmental
impacts, contributing to a low-carbon emission
agriculture (DANTAS et al., 2015).
Sunflower (Helianthus annuus L.) stands out
as one of the four main annual oil producing crops of the world. This oleaginous plant presents important characteristics, such as resistance to drought, cold and heat, adapts to different soil and climate conditions, and can be grown all year round. Besides, sunflower is an important crop for the world economy, since the sunflower seed production is
approximately 45 million Mg yr-1. The planted area
of sunflower in Brazil, in 2013, was 76.8 thousand hectares, with a production of 109,473 Mg and a
seed yield of 1581.3 kg ha-1 (FAO, 2016). Sunflower
has diverse applications, therefore, its planted area in Brazil has been gradually expanding, generating new income and work opportunities to family agriculture because the use of cassava wastewater as soil fertilizer for this crop.
Studies on the reuse of cassava wastewater have been carried out by several researchers. Cabral et al. (2010) reported an increase in seed yield of black oats, evaluated under field conditions, reaching 3,795 kg ha-1 on soil fertilized with 376 m3 ha-1 of
cassava wastewater. Duarte et al. (2012) used
45.0 m3 ha-1 of cassava wastewater in substitution of
soil mineral fertilizers for lettuce crops and found an increase in the phenotypic variables plant height, leaf number, total leaf area and shoot fresh and dry mass. Magalhães et al. (2014) evaluated maize grown on soil fertilized with cassava wastewater and found increases in culm diameter, number of leaves and
leaf fresh and dry mass using a rate of 63 m3 ha-1.
Dantas et al. (2015) found increases in leaf number, leaf fresh and dry mass, stem and capitulum, in
sunflower crops on soil fertilized with 136 m3 ha-1 of
cassava wastewater.
In this context, the objective of this work was to evaluate the growth and seed yield of sunflower on soil fertilized with cassava wastewater.
MATERIAL AND METHODS
The experiment was carried out in Vitória de Santo Antão, State of Pernambuco (PE), Brazil (8º8'0"S, 35º22'0"W), from October 2012 to January 2013. The climate of the region is C1S2A A‟ a‟, according to the classification of Köppen. The soil of the experimental area was classified as Oxisol, whose physical (granulometry) and chemical
characteristics (layer 0.0-0.40 m) are presented in
Table 1.
Table 1. Physical and chemical characteristics of the soil (layer 0.0-0.40 m) of the experimental area, before the application
of cassava wastewater.
Sand Silt Clay pH EC P K+ Ca2+ Mg2+ Na+ Al3+ H+ +Al3+ OC
g kg-1 1:2.5 H2O dS m-1 mg dm-3 cmolc dm-3 g kg-1
578 122 300 6.60 0.55 7.47 0.45 2.7 2.8 0.27 0.00 2.93 28
OC = Organic Carbon; EC = Electric Conductivity.
A randomized block experimental design with four replications was used, with six cassava
wastewater rates (0, 8.5, 17, 34, 68 and 136 m3 ha-1),
and six plant sampling times (15, 30, 45, 60, 75 and
90 days after sowing - DAS).
Each experimental plot consisted of four 6-m
plant rows spaced 1.0 m apart with 0.20 m between plants, totaling 120 plants per plot, representing a
density of 50,000 plants per hectare. The evaluation
area of the plot (10.4 m2) consisted of the 52 central
plants of the two central rows.
The rate of cassava wastewater to be applied to the soil was calculated based on the potassium content found in this residue and the soil, since potassium is one of the most abundant elements in cassava wastewater. The potassium requirement for the sunflower crop was also considered, following the recommendation proposed by Ribeiro,
Guimarães and Alvarez (1999) (25 kg ha-1 of
potassium; 8.5 m3 ha-1 of cassava wastewater) for the
local conditions.
The other rates were calculated based on the
recommended rate, considering multiples of it (2-,
4-, 8- and 16-fold the recommended rate). Mineral
fertilizers and lime were not applied during the experiment, in order to evaluate only the effect of the cassava wastewater on the crop. The cassava wastewater rates were applied in a single application, at 15 days before sowing the sunflower seeds, so that the residue could be chemically balanced in the soil.
The soil preparation consisted of plowing, harrowing and furrowing, with row spacing of 1.0 m and depth of 0.3 m. A drip irrigation system was
used, with 16-mm flexible dripline, emitters spaced
0.2 m apart and flow of 1.0 L h-1. After the irrigation
system was installed, 8-cm-deep furrows were dug,
parallel to the plant rows, in which the cassava wastewater rates were applied as fertigation.
Seeds of the sunflower cultivar Helio-250
were sowed directly in the field, placing five seeds per hole. Seven days after the emergence the plants were thinned, leaving one plant per hole.
The irrigation water depth (357 mm) was determined based on the crop evapotranspiration (ETc), with reference evapotranspiration (ETo)
estimated by the Hargreaves-Samani method, using
the recommended crop coefficient (Kc) for sunflower, during the entire cycle.
Three sunflower plants from the evaluation area of each plot were sampled for growth analysis, with intervals of 15 days up to 90 days after sowing (DAS). The plants were cut near the ground level, fractionated in stems, leaves and inflorescences,
packed in paper bags and placed in a forced air circulation oven at 65 ºC to a constant weight.
The total leaf area (TLA) was determined by the linear measures of leaf width proposed by Maldaner et al. (2009), estimated by the equation TLA=1.7582 L1.7067 (R²=0.983). Based on the TLA
and dry masses of plants, the following characteristics were evaluated: leaf area index (LAI),
calculated by the equation LAI=TLA/S, in which TLA
is the total leaf area and S is the space available for
the plant (20 x 100 cm); leaf area ratio (LAR),
calculated by the equation LAR=TLA/TDM(cm2 g-1),
in which TDM is the total dry mass; specific leaf area
(SLA) calculated by the equation SLA=TLA/LDM
(cm2 g-1), in which LDM is the leaf dry mass; and
leaf weight ratio: LWR=LDM/TDM (g)
(BENINCASA, 2003).
The Mauchly‟s sphericity test was applied to define the type of statistical analysis to be used on the data, univariate (with independence of the measures over time) or multivariate (without independence of the measures over time). The results of the Mauchly's test (p<0.01) indicated the use of the multivariate analysis through repeated measurements over time. The variables that presented significant responses were then subjected to regression analysis, using mathematical models with the highest coefficient of determination at 5% of significance.
RESULTS AND DISCUSSIONS
According to the results of the analysis of variance, the plant sampling times (PST) and cassava wastewater rates (CWR) had significant effects on the total leaf area (TLA), leaf area index (LAI), leaf area ratio (LAR), specific leaf area (SLA) and leaf weight ratio (LWR) (Table 3). Thus, these results were subjected to test of means to verify the PST x CWR interaction.
Table 2. Physical and chemical characteristics of the cassava wastewater.
COD EC pH N P K+ Ca2+ Mg2+ Na+ SO42- Cl
-mg L-1 dS m-1 mg L-1
66.62 7.27 6.60 3,064.0 312.0 3,200.0 241.9 1,588.2 390.0 2,205.0 795.0
COD = Chemical oxygen demand; EC = Electric Conductivity.
Table 3. Analysis of variance of the total leaf area (TLA), leaf area index (LAI), leaf area ratio (LAR), specific leaf area (SLA) and leaf weight ratio (LWR) of sunflower on soil fertilized with cassava wastewater.
DF = Degrees of freedom; Pr > F = Significance level.
Source of Variation DF Pr > F
TLA LAI LAR SLA LWR
Time 5 < 0.0001 <0.0001 <0.0001 <0.0001 <0.0001
Time x Block 15 0.7369 0.7321 0.4996 0.6933 0.0020
Time x Rate 25 < 0.0001 <0.0001 <0.0001 <0.0001 0.0401
The interaction between PST and CWR was significant for all variables evaluated. The results of the sunflower total leaf area (TLA) presented a
quadratic response to the cassava wastewater rates
over time (Figure 1A).
The maximum TLA found were 2,131.85 cm2
(rate of 0, at 71 days after sowing DAS)
2,571.82 cm2 (rate of 8.5 m3 ha-1, at 68 DAS),
2,815.29 cm2 (rate of 17 m3 ha-1, at 66 DAS),
3,631.71 cm2 (rate of 34 m3 ha-1, 66 DAS),
4,536.02 cm2 (rate of 68 m3 ha-1 and 63 DAS),
6,512.72 cm2 (rate of 136 m3 ha-1, 63 DAS). These
results showed that the higher rates accelerated the development stages of the culture. The vegetative stages, and especially the reproductive stage, are favored by the carbon/nitrogen balance (C/N), which is quantitatively favorable to the first assimilated compounds (TAIZ; ZEIGER, 2013), and since the cassava wastewater is a residue that supplies carbon and nitrogen, the acceleration of the development stages, which were eight days early, may be related to the adequate supply of these two nutrients.
Rate 0 Ŷ = -0.653**x2+92.159**x-1120.11 R² = 0.95
Rate 8.5 Ŷ = -0.820**x2+112.239*x-1268.30 R² = 0.99
Rate 17 Ŷ = -0.929**x2+123.487**x-1290.05 R² = 0.98
Rate 34 Ŷ = -1.155**x2+153.278**x-1451.76 R² = 0.95
Rate 68 Ŷ = -1.584**x2+200.166**x-1787.89 R² = 0.95
Rate 136 Ŷ = -2.049**x2+258.360**x-1632.44 R² = 0.84
Rate 0 Ŷ = -0.000326**x2+0.0461**x -0.560 R² = 0.95
Rate 8.5 Ŷ = -0.000410**x2+0.056**x -0.634 R² = 0.90
Rate 17 Ŷ = -0.000464**x2+0.062**x-0.645 R² = 0.98
Rate 34 Ŷ = -0.000578x**2+0.077**x-0.726 R² = 0.95
Rate 68 Ŷ = -0.000792**x2+0.100**x-0.894 R² = 0.95
Rate 136 Ŷ = -0.001100**x2+0.129**x-0.811 R² = 0.84 Figure 1. Total leaf area (TLA) (A) and leaf area index (LAI) (B) of sunflower on soil fertilized with different rates of cassava wastewater, in different evaluation times.
The maximum TLA was reached around 66 DAS for all rates, and then this variable decreased
throughout the evaluation time (Figure 1A). This result was due to abscission and natural senescence of leaves, which occur by the end of the crop cycle, because the targeting of photoassimilates is preferential to the fruits during this stage (TAIZ; ZEIGER, 2013).
The results of TLA confirm those found by Aquino, Silva and Berger (2013) in sunflower plants
(cultivars BR-122 and M-74) under field conditions,
in Januária, State of Minas Gerais, Brasil. They
found, by a non-destructive method, an average TLA
of 6,278 cm2 plant-1 by the end of the flowering
stage. Duarte et al. (2012) also found an increase of TLA in lettuce, grown in greenhouse, with quadratic response to the application of the cassava wastewater
which the application rate of 45 m3 ha-1 resulted in
the largest TLA.
The results of the sunflower leaf area index (LAI) also presented a quadratic response to the
cassava wastewater rates over time (Figure 1B). The
maximum LAI found were 1.07 (0 m3 ha-1), 1.29
(8.5 m3 ha-1), 1.65 (17 m3 ha-1), 1.81 (34 m3 ha-1),
2.27 (68 m3 ha-1) and 2.97 cm2 cm-2 (136 m3 ha-1) at
65 DAS, then, the LAI decreased, presenting 0.95 (0 m3 ha-1), 1.08 (8.5 m3 ha-1), 1.15 (17 m3 ha-1), 1.49
(34 m3 ha-1), 1.70 (68 m3 ha-1) and 2.52 cm2 cm-2
(136 m3 ha-1) at 90 DAS.
According to Benincasa (2003), the leaf area index is the relation between leaf area and soil area shaded by leaves. Thus, the LAI increases with
increasing leaf area until the self-shading becomes
full flowering is ideal to high seed yields in sunflower crops (BRAZ; ROSSETTO, 2009). Thus,
a cassava wastewater rate of 136 m3 ha-1 can promote
high seed yields, since a LAI of 2.97 was found at full flowering (58 DAS) with this rate.
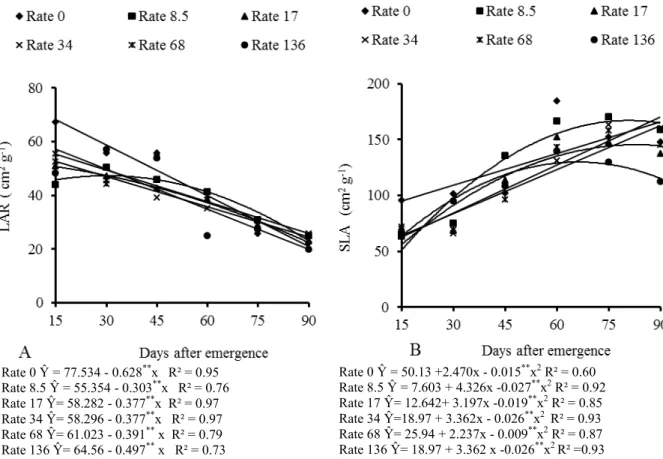
The leaf area ratio (LAR) expresses the photosynthetic leaf area, i.e., the relation between the
leaf area that intercept light energy and CO2 and the
total dry mass resulting from photosynthesis. The interference of the upper on the lower leaves increases with the plant growth, reducing the photosynthetic leaf area (BENINCASA, 2003).
The results of the sunflower leaf area ratio (LAR) presented a negative linear response to the
cassava wastewater rates over time. LAR of 68.12
(0 m3 ha-1), 50.81 (8.5 m3 ha-1), 52.63 (17 m3 ha-1),
52.64 (34 m3 ha-1), 55.16 (68 m3 ha-1) and
57.11 cm2 g-1 (136 m3 ha-1) were found at 15 DAS,
which decreased to 21.06 (0 m3 ha-1), 28.08
(8.5 m3 ha-1), 24.35 (17 m3 ha-1), 24.37 (34 m3 ha-1),
25.82 (68 m3 ha-1) and 19.83 cm2 g-1 (136 m3 ha-1) at
90 DAS (Figure 2A). Thus, the photosynthetic leaf area of the plants decreased as a function of plant age and accumulation of dry mass by the plants.
Rate 0 Ŷ = 77.534 - 0.628**x R² = 0.95
Rate 8.5 Ŷ = 55.354 - 0.303**x R² = 0.76
Rate 17 Ŷ= 58.282 - 0.377**x R² = 0.97
Rate 34 Ŷ= 58.296 - 0.377**x R² = 0.97
Rate 68 Ŷ= 61.023 - 0.391** x R² = 0.79
Rate 136 Ŷ= 64.56 - 0.497** x R² = 0.73
Rate 0 Ŷ = 50.13 +2.470x - 0.015**x2 R² = 0.60
Rate 8.5 Ŷ = 7.603 + 4.326x -0.027**x2 R² = 0.92
Rate 17 Ŷ= 12.642+ 3.197x -0.019**x2 R² = 0.85
Rate 34 Ŷ=18.97 + 3.362x - 0.026**x2 R² = 0.93
Rate 68 Ŷ= 25.94 + 2.237x - 0.009**x2 R² = 0.87
Rate 136 Ŷ= 18.97 + 3.362 x -0.026**x2 R² =0.93
Figure 2. Leaf area ratio (LAR) and specific leaf area (SLA) of sunflower grown on soil fertilized with different rates of cassava wastewater, in different evaluation times.
These results confirm those found by Lopes et al. (2011), who found a decrease in leaf area ratio in tomato crops, as a function of plant age. The decrease of the LAR throughout the crop cycle is related to the reduction of photoassimilates to the older organs, which causes a reduction in the relative growth rate of the plants. Silva et al. (2010) evaluated the growth of sweet pepper at different spacing between plants and found similar responses.
According to Fontes, Dias and Silva (2005), the specific leaf area (SLA) is the photosynthetic area per dry mass of leaf, and the inverse of the specific leaf area indicates the leaf thickness. The results of the sunflower SLA presented a quadratic
response to the cassava wastewater rates over time
(Figure 2B), with maximum SLA of 167
(8.5 m3 ha-1, 81 DAS), 145 (17 m3 ha-1, 83 DAS) and
129.76 cm2 g-1 (136 m3 ha-1, 66 DAS). The SLA had
small decrease, denoting the increase of leaf dry mass, however, the plants continued to expand their leaf area.
S
D
M
(g
p
la
n
t
-1)
Rate 0 Rate 8.5 Rate 17
Rate 34 Rate 68 Rate 136
Rate 0 Rate 8.5 Rate 17
Rate 34 Rate 68 Rate 136
1 300
0.8 250
0.6
0.4
0.2
0
15 30 45 60 75 90
200
150
100
50
0
15 30 45 60 75 90
A
Days after emergence B Days after emergenceL
W
R
(g
g
-1)
Rate 0 Ŷ = 0.820 - 0.008**x R² = 0.91
Rate 8.5 Ŷ = 0.871- 0.009**x R² = 0.92
Rate 17 Ŷ = 0.912 - 0.009**x R² = 0.92
Rate 34 Ŷ = 0.912 - 0.009**x R² = 0.93
Rate 68 Ŷ = 0.895 - 0.009**x R² = 0.95
Rate 136 Ŷ = 0.842 - 0.008**x R² = 0.97
Rate 0 Ŷ = - 20.093 + 1.169**x R² = 0.97
Rate 8.5 Ŷ = - 15.06 + 1.207**x R² = 0.97
Rate 17 Ŷ = - 14.74 + 1.368**x R² = 0.97
Rate 34 Ŷ = - 11.48 +1.530**x R² = 0.97
Rate 68 Ŷ = - 4.37 + 1.796**x R² = 0.95
Rate 136 Ŷ = - 20.47 + 3.128**x R² = 0.94
Figure 3. Leaf weight ratio (LWR) and shoot dry mass (SDM) of sunflower grown under different rates of cassava wastewater, in different evaluation times.
The leaf weight ratios (LWR) estimated by
regression equations were 0.699 (0 m3 ha-1), 0.742
(8.5 m3 ha-1), 0.778 (17 m3 ha-1), 0.778 (34 m3 ha-1),
0.763 (68 m3 ha-1), and 0.716 g g-1 (136 m3 ha-1) at
15 DAS, which decreased to 0.091 (0 m3 ha-1), 0.097
(8.5 m3 ha-1), 0.111 (17 m3 ha-1), 0.111 (34 m3 ha-1),
0.102 (68 m3 ha-1) and 0.069 g g-1 (136 m3 ha-1) at 90
DAS, showing a mean decrease of 87%. This decrease was expected due to the decrease of the leaf weight ratio in the total dry mass composition, due to the formation of new organs, such as branches and capitula.
Oliveira, Pereira and Gomide (2000) also found a negative linear response of LWR over time
in the grass Tifton-85, with maximum and minimum
LWR of 0.59 and 0.27 g g-1 at 14 and 70 days of
regrowth, respectively. Rodrigues et al. (2008)
evaluated the grass Brachiaria brizantha cv. Xaraés,
grown under different nitrogen and potassium rates and found a decrease in LWR with increasing nitrogen rates, however, the LWR was not affected by the potassium rates.
The shoot dry mass (SDM) was similar in all treatments, with increased SDM with increasing cassava wastewater rates (Figure 3B). SDM of 0.82 (0 m3 ha-1), 3.05 (8.5 m3 ha-1), 5.79 (17 m3 ha-1),
11.50 (34 m3 ha-1), 22.57 (68 m3 ha-1) and
26.46 g plant-1 (136 m3 ha-1) were found at 15 DAS,
(8.5 m3 ha-1), 108.39 (17 m3 ha-1), 126.32
(34 m3 ha-1), 157.27 (68 m3 ha-1) and 261.06 g plant-1
(136 m3 ha-1) at 90 DAS.
The maximum SDM was found in the treatment with the highest rate of cassava wastewater, denoting the efficient use of the nutrients present in this residue by the plants (Figure 3B). The SDM results confirm those found by Zobiole et al. (2010), who evaluated the nutrient
uptake rate of sunflower (variety BRS-19) grown in
a eutrophic Red Latosol and found maximum dry
mass index of 272.75 g plant-1 at 89 DAS.
Experiments conducted on other crops also show increases of SDM with the use of cassava wastewater as a source of nutrients. Cabral et al.
(2010) evaluated black oats (Avena strigosa) grown
in the field and found a quadratic response of the SDM to the cassava wastewater rates, with a rate of
376 m3 ha-1 presenting the highest SDM
(212 g plant-1), which was attributed mainly to the
high content of potassium and nitrogen in the residue.
Duarte et al. (2012) found quadratic response of SDM to the application of different cassava
wastewater rates (0, 12.5, 25.0, 45.0 and
65.0 m3 ha-1) for soil fertilization in lettuce crops,
with the maximum SDM (estimated by regression)
The results of the sunflower seed yield (SSY) presented a positive linear response to the cassava wastewater rates over time, with estimated SSY of
2,476.3 (0 m3 ha-1) and 4,553.56 kg ha-1
(136 m3 ha-1), denoting an increase of 83.9% (Figure
4A).
Uchôa et al. (2011) evaluated three sunflower varieties and five potassium rates (topdressing) (0,
30, 60, 90 and 120 kg ha-1) and found increased seed
yield with increasing K rates, reaching
2,038.3 kg ha-1 of sunflower seeds.
Figure 4. Seed yield of sunflower plants grown on soil fertilized with different rates of cassava wastewater.
CONCLUSIONS
The use of cassava wastewater as soil fertilizer improves the development of sunflower
(cv. Helio-250) crops.
The rate of 136 m3 ha-1 of cassava wastewater
increases the seed yield, leaf area, leaf area index and shoot dry mass, and results in lower leaf area ratio, specific leaf area and leaf weight ratio of sunflower
(cv. Helio-250) crops.
The use of 136 m3 ha-1 of cassava wastewater
as soil fertilizer is recommended for sunflower
(cv. Helio-250) crops.
REFERENCES
AMERICAN PUBLIC HEALTH ASSOCIATION
-APHA, AMERICAN WATER WORKS
ASSOCIATION - AWWA, WASHINGTON PRESS
CLUB FOUNDATION - WPCF. Standard methods
for the examination of water and wastewater. Washington: American Public Halth Association, 17. ed. 1995. 2198 p.
AQUINO, L. A.; SILVA, F. D. B.; BERGER, P. G. Características agronômicas e o estado nutricional de
cultivares de girassol irrigado. Revista Brasileira de
Engenharia Agrícola e Ambiental, Campina Grande, v. 17, n. 5, p. 551–557, 2013.
BENINCASA, M. M. P. Análise de crescimento de
plantas: noções básicas. 2. ed. Jaboticabal, SP: FUNEP, 2003. 41 p.
BRAZ, M. R. S.; ROSSETTO, C. A. V. Crescimento de plantas de girassol em função do vigor de
aquênios e da densidade de semeadura. Ciência
Rural, Santa Maria, v. 39, n. 7, p. 1989-1996, 2009.
CABRAL, J. R. et al. Effects of wastewater from a cassava industry on soil chemistry and crop yield of
lopsided oats (Avena strigosa Schreb). Brazilian
Archives of Biology & Technology, Curitiba, v. 53,
n. 1, p. 19-26. 2010.
CAMPOS, A. T. et al. Tratamento de águas residuárias de fecularia por meio de lagoas de
estabilização. Engenharia Agrícola, Jaboticabal, v.
26, n. 1, p. 235-242, 2006.
CARDOSO, E. et al. Use of Manihot esculenta, crantz processing residue as biofertilizer in corn
crops. Research Journal of Agronomy, Criciúma,
v. 3, n. 1, p. 1-8, 2009.
DANTAS, M. S. M. et al. Crescimento do girassol adubado com resíduo líquido do processamento de
mandioca. Revista Brasileira de Engenharia
Agrícola e Ambiental, Campina Grande, v. 19, n. 4, p. 350–357, 2015.
DUARTE, A. S. et al. Uso de diferentes rates de manipueira na cultura da alface em substituição à
Engenharia Agrícola e Ambiental, Campina
Grande, v. 16, n. 3, p. 262-267, 2012.
FONTES, P. C. R.; DIAS, E. N.; SILVA, D. J. H. Dinâmica do crescimento, distribuição de matéria seca na planta e produção de pimentão em ambiente
protegido. Horticultura Brasileira, Brasília, v. 23,
n. 1, p. 94-99, 2005.
FOOD AND AGRICULTURE ORGANIZATION
-FAO. Anuários Estatísticos da FAO. Disponível
em: <http://www.faostat.fao.org/>. Acesso em 08 mar. 2016.
LOPES, W. A. R. et al. Análise do crescimento de
tomate „SM-16‟ cultivado sob diferentes coberturas
de solo. Horticultura Brasileira, Brasília, v. 29, n.
4, p. 554-561, 2011.
MAGALHÃES, A. G. et al. Desenvolvimento inicial do milho submetido à adubação com manipueira. Revista Brasileira de Engenharia Agrícola e Ambiental, Campina Grande, v. 18, n. 7, p. 675-681, 2014.
MALDANER, I. C. et al. Modelos de determinação
não-destrutiva da área foliar em girassol. Ciência
Rural, Santa Maria, v. 39, n. 3, p. 1356-1361, 2009.
OLIVEIRA, M. A.; PEREIRA, O. G.; GOMIDE, J.
A. Análise de crescimento do capim-bermuda
“Tifton 85” (Cynodon spp.). Revista Brasileira de
Zootecnia, Viçosa, v. 29, n. 6, p. 1930-1938, 2000.
RIBEIRO, A. C.; GUIMARÃES, P. T. G.;
ALVAREZ, V. V. H. Recomendação para o uso de
corretivos e fertilizantes em Minas Gerais. 5ª aproximação. Viçosa, MG: Comissão de Fertilidade do Solo do Estado de Minas Gerais, 1999. 359 p.
RODRIGUES, R. C. et al. Produção de massa seca, relação folha/colmo e alguns índices de crescimento do Brachiaria brizantha cv. Xaraés cultivado com a combinação de rates de nitrogênio e potássio. Revista Brasileira de Zootecnia, Viçosa, v. 37, n. 3,
p. 394-400, 2008.
SILVA, P. I. B. et al. Crescimento de pimentão em
diferentes arranjos espaciais. Pesquisa
Agropecuária Brasileira, Brasília, v. 45, n. 2, p. 132-139. 2010.
TAIZ, L.; ZEIGER, E. Fisiologia vegetal. 5. ed.
Porto Alegre, RS: Artmed, 2013. 820 p.
UCHÔA, S. C. P. et al. Adubação de potássio em cobertura nos componentes de produção em
cultivares de girassol. Revista Ciência Agronômica,
Fortaleza, v. 41, n. 1, p. 8-15, 2011.
ZOBIOLE, L. H. S. et al. Marcha de absorção de
macronutrientes na cultura do girassol. Revista
Brasileira de Ciência do Solo, Viçosa, v. 34, n. 2, p.