Universidade Nova de Lisboa
Faculdade de Ciências e Tecnologia
Departamento de Química
NEW ULTRASONIC-BASED
METHODS IN PROTEOMICS
Ph.D dissertation in Biochemistry by Hugo Miguel Baptista Carreira dos Santos
ISBN: 978-989-20-2273-4 (Hardcover)
Title: New ultrasonic-based methods in proteomics Author: Santos, Hugo Miguel Baptista Carreira dos
Departamento de Química
Hugo Miguel Baptista Carreira dos Santos
NEW ULTRASONIC-BASED
METHODS IN PROTEOMICS
Dissertação apresentada para obtenção do Grau de Doutor em Bioquímica pela Universidade Nova de Lisboa, Faculdade de Ciências e Tecnologia.
A presente dissertação foi preparada no âmbito do convénio bilateral existente entre a Universidade Nova de Lisboa e a Universidade de Vigo.
Supervised by:
José Luis Capelo Martínez, Ph.D
Faculdade de Ciências e Tecnologia, Universidade Nova de Lisboa – Portugal and Science Faculty of Ourense, University of Vigo – Spain
José João Galhardas de Moura, Ph.D
Faculdade de Ciências e Tecnologia, Universidade Nova de Lisboa – Portugal Garry Leander Corthals
Acknowledgements
Giving thanks because of the successful ending of a hard work is indeed something nice to be done. And this is because with my doctoral thesis finally completed, I can see the way I have done to get this moment. It has been, it is and I hope it will be a never ending way to wisdom.
This way has had moments of difficulty, moments I needed to overcome alone or most of the times, with the aid of my family, my supervisors and my friends. Joy has been also present during the making of the thesis. For instance, I have had the opportunity to know the way of living of many people of other countries, such as Finland or Spain. This has opened my mind to a better understanding of people and has taught me to be proud of my country and my family.
The acceptance of the manuscripts was always a moment of happiness because is the final act of this incredible history named science.
Below I will thanks to all those whom in a way or another have helped to bring this work to safe port. Therefore I would like to thanks
To Prof. José Luis Capelo, main supervisor of this thesis, and to Carlos Lodeiro for their help guidance through this work, and for his truly friendship. We have passed hard but fruitful moments together, and together we have done great things, such as one book; good research, that has been published in the top-ten of the journals of the analytical and proteomics areas; and also many courses through which we have formed more than 50 researchers and technicians from countries as different as Brazil and Sweeden.
Last but not least, together we have created two research labs, one in Portugal and a new one in Spain. Thanks for all. I will try to follow your counsel: “From your supervisor learn the better, to copy it and to make it best, but also learn the pits, to use them never”.
To Prof. Garry Corthals co-supervisor of this thesis, not only for his support and truly friendship but also for giving me the opportunity to work in his laboratory. I could learn a different but positive way of doing things.
To Prof. Mário Diniz for his always useful advices, support and because he was the first researcher who taught me how to do real research.
To “Fundação para a Ciência e Tecnologia de Portugal”, for the financial support given to perform this doctoral thesis (grant SRF/BD/38509/2007).
To the New University of Lisbon and in particular to the Chemistry Department of the Faculty of Science and Technology, for giving me the possibility to use its facilities.
To the Turku Centre for Biotechnology – University of Turku and Åbo Akademi for provide me the opportunity to learn and work on their facilities.
To the University of Vigo for giving me the possibility for work on their facilities. To my parents, Leonor and Armindo, and to my brother Ruben, for being like they are and for their constant support and help. Without their constant presence and perseverance in pushing me to give my best, I had probably never tried to do a doctorate.
To all my laboratory colleagues, especially, to Gonçalo, Marco and Ricardo for their support.
To the group of Garry Corthals, for their kindness and help during my research period in Turku. A special thanks to Petri Kouvonen, Anne Rokka and Anni Vehmas.
To Elisabete, more than a colleague a real friend, for her always useful help, advice and support.
To all the people that in a way or another have contribute to this work and that I had might forgotten of named here.
Abstract
The present dissertation is devoted, essentially, to the development of new ultrasonic-based sample preparation methods for mass-spectrometry-based analysis of proteins.
This dissertation is introduced by a brief overview about general aspects in proteomics such as protein identification, quantification and finally, tissue analysis by mass spectrometry. Special attention is given to fast methods for protein identification, as for example those using tools such as microwave energy and ultrasonic energy to speed-up enzymatic digestion. In addition, a general overview of label-based quantification approaches, such as SILAC, iTRAQ, ICAT, or 18O and, label-free methods are presented. Furthermore, stable 18O-isotopic labeling is described in detail. The last topic covered in the first chapter is the analysis of tissue samples by mass spectrometry, a short overview on this subject is done to introduce the reader on the importance of tissue analysis by mass spectrometry.
As far as experimental concerns, different types of ultrasonic devices, such as ultrasonic bath, sonoreactor, ultrasonic probe and multiprobe were assessed in different steps of currents protocols for protein identification through mass spectrometry. Variables such as temperature, sonication time, amplitude and ultrasonic frequency were evaluated in order to identify the optimum conditions. On the first trial, ultrasonic energy was used to accelerate the in-solution enzymatic protein digestion. It was found that the application of the ultrasonic energy (ultrasonic probe and sonoreactor) to a liquid medium containing protein and trypsin speeds protein cleavage from overnight (12h) to 5min.
The efficiency of ultrasonic energy to accelerate the sample preparation for protein identification by peptide mass fingerprint was evaluated by comparison with the overnight method.
Once all the experiments were done, it was completed a new sample treatment for the identification of proteins by mass spectrometry. For proteins separated by gel-based approaches the total sample treatment time was reduced from 12-24h to just 20min whilst for proteins separated by off-gel approaches the total time was reduced to just 8min.
Regarding protein quantification, we chose to work with isotopic labeling, as this is one of the methods most suitable for protein quantification by mass spectrometry. In this work proteins separated by gel electrophoresis were inverse labeled with 18O and analysed by MALDI-TOF-MS. The inverse labeling approach, allows to select some peptides that have reproducible loses in different sets of a given entire proteomic workflow. Those selected peptides were used for subsequent protein quantification.
To help to handle in a simple way the data from inverse labeling experiments and to use such data for protein quantification, a bioinformatics tool called “Decision peptide-driven”, DPD; was developed. The simultaneous use of the inverse labeling approach to select the peptides suitable for quantification and the DPD software allowed the accurate quantification of targeted proteins. The proposed quantification strategy was successfully compared with a classic quantification done with the ELISA method.
Resumo
O presente trabalho descreve a aplicação da energia de ultra-sons a diferentes etapas da preparação de amostra para análise de proteínas por espectrometria de massa. A dissertação apresentada encontra-se orientada numa perspectiva de desenvolvimento de novos métodos com aplicações em proteómica.
Em primeiro lugar, apresenta-se de forma geral uma introdução que pretende contextualizar de forma simples os diferentes temas abordados, por exemplo identificação de proteínas, a sua quantificação e a análise directa de proteinas em tecidos biológicos, tudo com recurso a espectrometria de massa. No entanto, temas relacionados com a aceleração de tratamentos de amostra para identificação de proteínas por espectrometria de massa, como por exemplo a utilização de energia de microondas e de ultra-sons serão abordados com algum detalhe.
Tendo em conta a grande importância da quantificação de proteínas para o entendimento dos sistemas biológicos foi efectuada uma pesquisa bibliográfica em temas chave de quantificação de proteínas por espectrometria de massa, nomeadamente, a utilização de marcadores isotópicos como por exemplo SILAC, iTRAC, ICAT e 18O. Este ultima, será abordada de forma mais exaustiva.
O último tema sobre o qual recai a presente dissertação, encontra-se relacionado com a análise directa de proteinas em tecidos biológicos por espectrometria de massa. Nesta parte pretende-se elucidar o leitor acerca da importância da análise de tecidos por espectrometria de massa, bem como esclarecer sobre a forma como se processa a análise de tecidos biológicos por espectrometria de massa.
Alguns parâmetros, como por exemplo, temperatura, tempo, amplitude e frequência de ultra-sons foram avaliados quanto à performance destes sistemas em protocolos de identificação de proteínas.
Numa primeira aproximação, foi testada a aplicação da energia de ultra-sons para acelerar a digestão enzimática de proteínas em solução. A aplicação desta energia a um meio liquido contendo proteína e enzima produz um efeito de cavitação aumentado os processos de transferência de massa, como consequência, a digestão de proteínas foi reduzida de 12h para 5 min. A energia de ultra-sons, foi aplicada com sucesso às etapas de redução e alquilação de proteínas, que foram reducidas de 3h para apenas 10min.
A capacidade da energia de ultra-sons para acelerar a preparação de amostra para identificação de proteínas por PMF foi avaliada por comparação com o método clássico, verificando-se a redução no total de 12-24h para apenas 20min para proteínas separadas em gel ou 8min para proteínas em soluçao
Relativamente ao tema de quantificação de proteínas com utilização de isótopos e análise por espectrometria de massa, foi efetuado um estudo de quantificação de proteínas separadas por eletroforese em gel. Deste modo as proteínas de interesse foram digeridas e marcadas com 18O, seguindo uma estratégia de marcação inversa e análise por MALDI-TOF-MS.
A marcação inversa permite a identificação de péptidos que apresentam um comportamento reprodutível ao longo das etapas de preparação de amostra e análise. Estes péptidos sao seleccionados e são utilizados para a quantificação. Para facilitar o processo de quantificação, foi desenvolvida uma ferramenta bioinformática chamada “Decision Peptide-Driven”, DPD, que se destina ao tratamento de dados provenientes das experiências de marcação inversa e analise por MALDI-TOF-MS. A utilização conjunta da metodologia proposta e do software permite seleccionar os péptidos adequados e como consequência a quantificação é efectuada de forma exacta e rápida.
Os resultados de quantificação obtidos com a abordagem proposta formam comparados com um método clássico de ELISA, utilizado normalmente para a quantificação de proteínas em misturas complexas.
Abbreviations
1D-LC-MS One dimension liquid chromatography 2D-GE Two-dimensional gel electrophoresis
2D-PAGE Two-dimensional polyacrylamide gel electrophoresis A&D Aspirate and dispense
AmBic Ammonium Bicarbonate
cICAT Cleavable Isotope-code affinity tags D&I Direct and Inverse
DIGE Diference gel electrophoresis
DNA Deoxyribonucleic acid
DPD Decision peptide-driven
DTT DL-Dithiothreitol
ECDs Endocrine disruptor compounds,
ESI Electrospay ionization
FT-ICR- MS Fourier transform ion cyclotron resonance mass spectrometry
GE Gel elctrophoresis
HPLC High pressure liquid chromatography
IAA Iodoacetamide
ICAT Isotope-code affinity tags
IEF Isoelectric focusing
iTRAQ Isobaric tag for relative and absolute quantification
LC Liquid chromatography
MALDI-TOF-MS Matrix Asisted laser/desorption ionization time-of-flight mass spectrometry
MRM Multiple reaction monitoring
MS Mass spectrometry
MW Molecular weight
PMF Peptide mass fingerprint PNPP p-nitro-phenylphosphate
RP-HPLC Reverse phase high performance liquid chromatography RSD Relative Standard Deviation
SDS Sodium dodecyl sulfate
SILAC Stable isotopic labeling with acids in cell culture SIM Selected ion monitoring
TCA Trichloroacetic acid
Vtg Vitellogenin
Table of Contents
Chapter I. Introduction ... 1
I.1 Proteomics, the new biology ... 5
I.2 Sample preparation for mass spectrometry-based protein identification ... 6
I.2.1 In-gel protein digestion ... 6
I.2.2 In-solution protein digestion ... 7
I.3 Accelerating protein digestion ... 8
I.3.1 Microwave energy... 9
I.3.2 Ultrasonic energy ... 9
I.3.2.1 Basics on ultrasonic energy... 9
I.3.2.2 Indirect sonication: the ultrasonic bath and the sonoreactor... 10
I.3.2.3 Direct sonication: the ultrasonic probe... 11
I.3.2.4 Accelerating protein digestion with ultrasonic energy... 12
I.4 Beyond protein identification - quantitative proteomics... 12
I.5 Gel-based quantification methods... 13
I.5.1 Differential gel electrophoresis ... 14
I.6 Mass-spectrometry based protein quantification... 15
I.6.1 Label-free methods for protein quantification... 15
I.6.2 Methods based on isotopic labeling ... 16
I.6.2.1 Monitoring... 16
I.6.2.2 SILAC Labeling... 18
I.6.2.3 ICAT Labeling... 18
I.6.2.4 iTRAQ labeling... 19
I.7 Isotopic labeling of proteins with 18O ... 20
I.7.1 Chemical reactions involved in the 18O labeling of proteins... 20
I.7.1.1 The direct labeling... 21
I.7.1.2 The decoupling procedure... 21
I.7.2 The problem of the 18O-labeling efficiency ... 23
I.7.3 Variables affecting 18O labeling of proteins ... 23
I.7.3.1 The enzymes used for 18O labeling... 23
I.7.3.2 The influence of the pH... 24
I.7.4 18O inverse labeling... 24
I.7.4.1 Applications to proteins separated by gel electrophoresis... 25
I.7.4.2 Applications to proteins in solution... 28
I.8. Direct tissue mass spectrometry analysis... 29
I.9. References...30
Chapter II. Objectives and working plan ... 35
Chapter III. Improving sample treatment for in-solution protein identification by peptide mass fingerprint using matrix-assisted laser desorption/ionization time-of-flight mass spectrometry ... 39
III.1 Resumo... 42
III.2 Abstract ... 43
III.3 Introduction ... 44
III.4 Experimental procedures... 45
III.4.1 Apparatus... 45
III.4.2 Ultrasonic devices ... 45
III.4.3 Standards and reagents ... 46
III.4.4 Sample treatment ... 47
III.4.4.1 Classic method... 47
III.4.4.2 Protein digestion accelerated method... 48
III.4.4.3 Accelerated method... 50
III.4.5 MALDI-TOF-MS Analysis ... 50
III.4.6 Protein samples from complex mixtures ... 51
III.5 Results and discussion... 51
III.5.1 Protein digestion accelerated method... 51
III.5.2 Accelerated method ... 53
III.5.3. Proof of the method ... 56
III.6 Conclusions ... 57
III.7 Acknowledgments... 58
III.9 Supporting information ... 60
Chapter IV. Ultrasonic multiprobe as a new tool to overcome the bottleneck of throughput in workflows for protein identification relaying on ultrasonic energy. ... 61
IV.1 Resumo... 64
IV.2 Abstract ... 65
IV.3 Introduction ... 66
IV.4 Experimental ... 67
IV.4.1 Apparatus... 67
IV.4.2 Ultrasonic devices ... 67
IV.4.3 Standards and reagents ... 68
IV.4.4 Sample treatments ... 68
IV.4.4.1 Classic method... 68
IV.4.4.2 Accelerated urea method... 69
IV.4.4.3 Accelerated clean method... 69
IV.4.5 A case study... 69
IV.4.5.1 D. desulfuricans ATCC 27774... 69
IV.4.6 MALDI-TOF-MS analysis ... 70
IV.4.7 Statistical analysis ... 71
IV.5 Results and discussion... 71
IV.5.1 Classic method... 71
IV.5.2 Accelerated urea method ... 71
IV.5.3 Accelerated clean method... 75
IV.5.4 MALDI spectra... 75
IV.5.5 Application to a case study... 76
IV.5.6 Final remarks ... 77
IV.6 Conclusions ... 78
IV.7 Acknowledgments ... 79
IV.8 References ... 79
Chapter V. Decision peptide-driven: a free software tool for accurate protein quantification using gel electrophoresis and matrix assisted laser desorption ionization time-of-flight mass spectrometry. ... 81
V.1 Resumo ... 85
V.3 Introduction ... 87
V.4 Materials and methods... 88
V.4.1 Apparatus... 88
V.4.2 Standards and reagents ... 88
V.4.3 In-gel protein digestion... 89
V.4.4 18O labeling: the decoupled procedure ... 89
V.4.5 Inverse 18O labeling of peptides ... 90
V.4.6Quantification of peptides... 90
V.4.7 Case study... 90
V.4.8 MALDI analysis ... 91
V.4.9 Software distribution ... 91
V.4.10 Decision peptide-driven experimental workflow ... 91
V.5 Results and discussion... 93
V.5.1 Preparing theoretical data ... 93
V.5.1.1 How to obtain the in-silico protein digestion... 93
V.5.1.2 How to obtain the isotopic mass distribution of the peptides... 93
V.5.2 Finding out the DPD peptides ... 94
V.I.5.2.1 First step: loading the in-silico data... 94
V.5.2.2 Second step: loading experimental data... 95
V.5.2.3Third step: creating a label experiment... 98
V.5.2.4 Fourth step: intersect peptides... 98
V.5.3 Quantification experiment ... 100
V.5.4 Merits and limitations... 102
V.6 Conclusions ... 103
V.7 Acknowledgements ... 103
V.8 References ... 104
V.9. Supplementary material………105
V.9.SM.1 Step by step description for the preparation of the data to use in the DPD software. ... 105
V.9.SM.2 How to obtain the in-silico digestion of a target protein ... 105
VI.1 Resumo... 117
VI.2 Abstract ... 118
VI.3 Introduction ... 119
VI.4 Materials and Methods ... 120
VI.4.1 Apparatus... 120
VI.4.2 Standards and reagents ... 121
VI.4.3 Gel electrophoresis ... 121
VI.4.4 Stain and image analysis ... 122
VI.4.5 In-gel protein digestion... 122
VI.4.6 18O labeling: the decoupled procedure... 123
VI.4.7 Inverse 18O labeling of peptides ... 123
VI.4.8 Analytical and biological sample replicates ... 123
VI.4.9 Quantification of peptides ... 124
VI.4.10 Case study... 125
VI.4.10.1 Plasmatic vitellogenin from Cyprinus carpio... 125
VI.4.10.2 ELISA vitellogenin quantification in Cyprinus carpio fish plasma... 126
VI.4.11 MALDI-TOF-MS analysis ... 126
VI.4.12 Software distribution ... 127
VI.5 Results and Discussion... 127
VI.5.1 Sample treatment workflow ... 127
VI.5.2 Finding out the best peptides for protein quantification... 128
VI.5.3 The use of “DPD peptides” as internal standards... 133
VI.5.4 A case study: quantifying 17E-estradiol-induced vitellogenin in fish... 135
VI.5.5 Merits and limitations... 140
VI.6 Conclusions ... 140
VI.7 Acknowledgements ... 142
VI.8 References ... 142
VI.9. Supplementary material... 144
VI.9.SM.1 Glycogen phosphorylase muscle from Oructolagus cuniculus... 144
VI.9.SM.3 Peptides assigned by the DPD software as candidates of bovine serum albumin, ovalbumin, carbonic anhydrase, trypsin inhibitor and α-lactalbumin... 146
VI.9.SM.4 Protein precipitation methods... 148 VI.9.SM.4.1 Precipitation with Cl2Mg/EDTA... 148
Index of Figures
Figure I. 1. Example of ultrasonic devices: A- ultrasonic bath; B- ultrasonic probe and C- Sonoreactor...10 Figure I. 2. N-hydroxy-succinimidyl esters of Cy2, propyl Cy3 and methyl Cy5 used for DIGE labeling of lysine residues [37]. ...14 Figure I. 3. Chemical structure of the original ICAT label. Heavy reagent, d8-ICAT (R-deuterium); Light reagent, d0-ICAT (R-hydrogen) [38]...18 Figure I. 4. Mechanism of the double oxygen incorporation by carboxyl oxygen exchange.
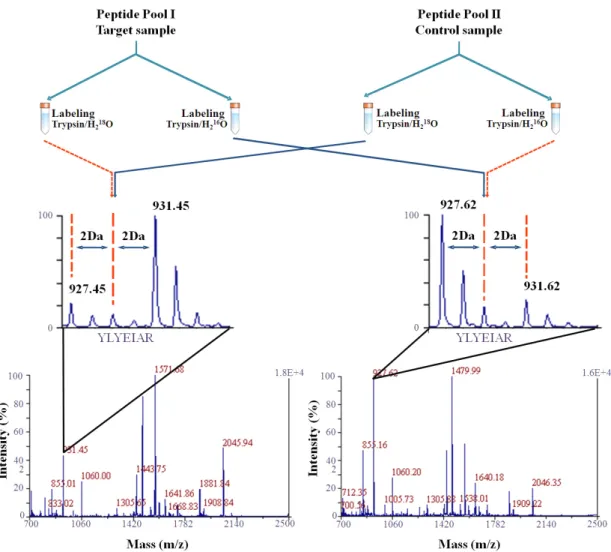
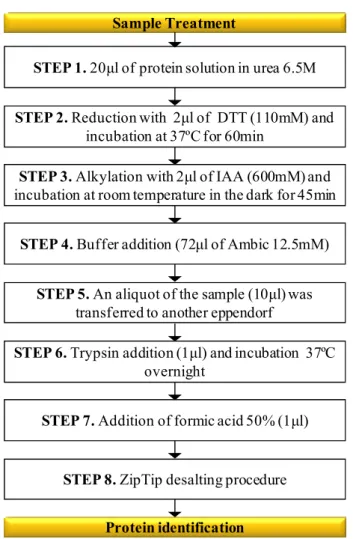
...22 Figure I. 5. Direct and inverse labeling experiments of a target protein and the correspondent control sample...25 Figure III. 1. Classic sample treatment for in-solution protein digestion. ...47
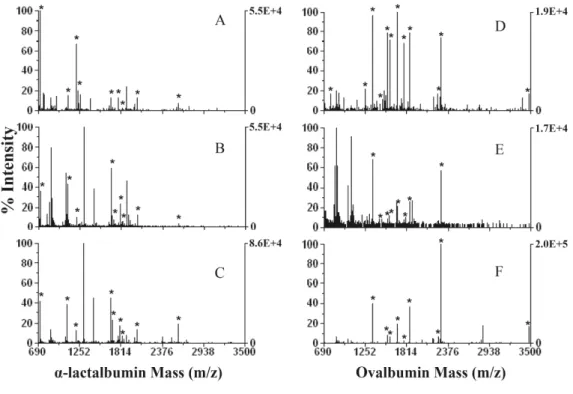
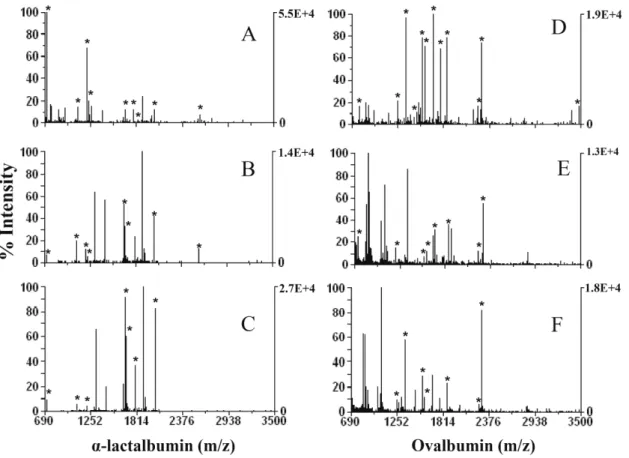
conditions refer to the text. Protein/enzyme ratio was 20:1 (w/w). Expected protein in the MALDI spot: 0.01Pg...55 Figure III. 5. MALDI-TOF-MS spectra for α-lactalbumin and ovalbumin. (A and D) Classic treatment; (B and E) accelerated method using ultrasonic probe for protein alkylation, protein reduction, and protein digestion; (C and F) accelerated method using sonoreactor for protein alkylation, protein reduction, and protein digestion. For ultrasonic conditions refer to the text. Protein/enzyme ratio was 20:1 (w/w). Expected protein in the MALDI spot: 0.01Pg...57 Figure III.SM. 1. MALDI-TOF-MS spectra for α-lactalbumin after protein digestion in the ultrasonic bath: A: frequency 35KHz, 100% amplitude and 5min sonication time; B: frequency 35KHz, 100% amplitude and 15min sonication time; C: frequency 130KHz, 100% amplitude and 5 min sonication time; D: frequency 130KHz, 100% amplitude and 15min sonication time. ...60 Figure IV. 1. This figure shows the new ultrasonic multiprobe coupled to the 96-well plate. ...67 Figure IV. 2. Number of peptides matched and sequence coverage for bovine serum albumin and α-lactalbumin as a function of time, and amplitude of ultrasonication. Sequence coverage and peptides matched for the overnight method was 61±5 and 39±4 for bovine serum albumin and 47±2 and 11±1 for α-lactalbumin, respectively...73
Figure IV. 3. MALDI spectra obtained of in-solution digestion of 3Pg/Pl of bovine serum albumin and α -lactalbumin. Panel A, B and C, spectrum of digested bovine serum albumin with classic method (A), accelerated urea method (B) and (C) accelerated clean method. Panel D, E and F, spectrum of digested α-lactalbumin with classic method (D), accelerated method (E) and (F) accelerated clean method...76 Figure IV. 4. MALDI spectra of Split-Soret cytochrome c from D. desulfuricans, (A)
classic method, (B) accelerated urea method and (C) accelerated clean method. ...77 Figure V. 1. Schematic diagram illustrating steps of the sample treatment workflow
that allows the best choice of peptides for quantification and finally the DPD quantification experiment. ...92 Figure V. 2. MALDI-TOF-MS spectra of glycogen phosphorylase obtained for the direct (0.84µg of unlabeled protein and 1.68µg of 18O-labeled protein, samples were mixed in a 1:1 ratio before MALDI analysis) and inverse labeling (0.84µg of 18O-labeled protein and 1.68µg of unlabeled protein, samples were mixed in a 1:1 ratio before MALDI analysis).
Ì
peptides assigned by the DPD software, § indicates the peptides used for the quantification with the most intense peaks and ̧ indicates peptides that were simultaneously assigned by DPD and are the most intense peaks. ...94 Figure V. 3. Results obtained with the DPD approach for glycogen phosphorylase, bovine serum albumin, ovalbumin carbonic anhydrase, trypsin inhibitor and α-lactalbumin. Panels A, C, E, G, I and K: x-axes shows the RSD of the direct (blue colour) and inverse experiments (red colour), RSDD&I. Peptides are grouped as a function of the RSDD&I and
only those included in the group named (I), can be used for accurate quantification. As an example in panel A, (I) means that four peptides can be used for accurate quantification. The expected direct and inverse ratios are 0.5 for all proteins except for α-lactalbumin for which the expected ratio is 0.75. Insets B, D, F, H, J and L show the quantification results obtained for each protein using the peptides included in each group. For instance, in inset B, the amount of protein is calculated four times. Each value is named as (I), (II), (III) and (IV) and correlates with the group of peptides with the same letters that were used for the calculation.....95 Figure V. 4. DPD protein quantification of 2, 1 and 0.4µg of (1) bovine serum albumin, (2) carbonic anhydrase and (3) α-lactalbumin. The quantification was carried out with different ratios of protein/18O-labeled internal standard, 1:1, 1:2, 1:5. No statistical differences were found between the calculated value and the amount of protein loaded on the 1D-gel (p>0.05, t-test, n=4). ....96 Figure V. 5. 1D-gel electrophoresis of A- molecular weight marker; B-1µg of Cyprinus
carpio vitellogenin standard; C- Precipitated plasma with MgCl2/EDTA method (250µL of
diluted 1:2 before loading on the gel); E and F- Plasma from control males (non-exposed) precipitated by the acetone method; G and H- Plasma from exposed males precipitated by the acetone method (dilution 1:50)...97 Figure V. 6. MALDI mass spectrum obtained for the quantification of Vtg (0.5µg of 18 O-labeled internal standard).ÌDPD-peptides....97 Figure VI. 1. Experimental workflow for the identification of DPD (decision peptide
Figure VI. 8. DPD application showing a ready-to-run quantification experiment where the user-defined parameters can be specified. ...101 Figure VI. 9. Protein quantification results computed by the DPD application once an experiment is executed ...102 Figure VII. 1. Schematic diagram of the sample treatment workflow including: tissue washing, on-tissue trypsin digestion, 18O labeling and matrix application. ...156 Figure VII. 2. MALDI spectra of a liver tissue from Mus musculus spiked with carbonic anhydrase (0, 0.1, 0.5, 2.5Pg) and digested with 40ng/mm2 of trypsin in a humidified chamber for 3h at 37ºC. Ì Indicate the m/z peaks from carbonic anhydrase...157 Figure VII. 3. MALDI spectra of 0.5Pg of carbonic anhydrase digested over ITO-coated glass slide (trypsin 40ng/mm2)in H216O, 1:1 H216O/ H218O and H218O. ...159
Figure VII. 4. MALDI spectra of 0.5Pg of carbonic anhydrase digested over ITO-coated glass slide (trypsin 40ng/mm2) followed by 20min of labeling with H216O/trypsin
125ng/PL/ammonium acetate 50mM and H218O/ trypsin 125ng/PL/ ammonium acetate
50mM. ...160 Figure VII. 5. MALDI spectra of 0.5Pg of carbonic anhydrase digested over ITO-coated glass slide (trypsin 40ng/mm2) followed by 20min of labeling with H218O/ ammonium
acetate 50mM with 0.1Pg, 0.05Pg, 0.01Pg and 0Pg of trypsin...162 Figure VII. 6. MALDI spectra of a liver tissue from Mus musculus digested with 40ng/mm2 of trypsin in a humidified chamber for 3h at 37ºC followed by 20min of labeling at room temperature with H216O/ 50mM ammonium acetate, H216O/H218O/ ammonium
acetate 50mM and H218O/ 50mM ammonium acetate...162
Figure VII. 7. MALDI spectra of a ovary tissue from Mus musculus digested with 40ng/mm2 of trypsin in a humidified chamber for 3h at 37ºC followed by 20 min of labeling at room temperature with H216O/ 50mM ammonium acetate, 10 min of labeling
with H218O/ ammonium acetate 50mM and 20min of labeling with H218O/ 50mM
Table I. 1. Protein staining for gel electrophoresis-based quantification of proteins [35].13
Table III. 1. Number of Peptides Matched and Protein Sequence Coverage (%) for the Classic and Accelerated Methods. Initial protein concentration: a 2 µg/µl; b 10 µg/µl;c 20 µg/µl. ...56 Table IV. 1. Protein sequence coverage and number of peptides matched for the in-solution
protein digestion: overnight method, accelerated method with urea and ZipTip® and clean method in H2O/acetonitrile (n=4, pt=0.05a)...72 Table IV. 2. Comparison of handling and time consumed for the three methods studied in this work. ...78 Table V. 1. Peptides assigned by the DPD software as candidates to be used for quantification of glycogen phosphorylase, muscle from Oryctolagus cuniculus. Direct labeling: 0.84µg of unlabeled protein and 1.68µg of 18O-labeled protein, samples were mixed in a 1:1 ratio before MALDI analysis. The expected direct ratio is 0.5 corresponding to the unlabeled/labeled ratio (0.84/1.68). Inverse labeling: 0.84µg of 18O-labeled protein and 1.68µg of unlabeled protein, samples were mixed in a 1:1 ratio before MALDI analysis. The expected inverse ratio is 2 corresponding to the unlabeled/labeled ratio (1.68/0.84). (note: the inverse ratio is expressed in the table as (inverse ratio)-1 for simplicity. In this way the direct and inverse ratios may be compared easily since both have the same value of 0.5). For the direct method the amount of protein calculated was the lower of 0.84µg whilst for the inverse method was the higher of 1.68µg. DPD software parameters: Peak intensity - 5; Peptide mass tolerance ± 0.25Da; experimental overlapping - 2; Ratio I4/I0 - 0.15. ÌSignificant differences between D&I ratios (p<0.05, t-test). n=4; ‡
Expected values. ...130 Table V. 2. Amounts of different proteins loaded into the 1D-gel for the direct and inverse labeling and the respective quantification using (i) the DPD methodology, (ii) the most
intense peak of the mass spectra and (iii) the four most intense peaks of the mass spectra. For the quantification done with the DPD methodology the number of peptides used is indicated between branches...132 Table V. 3. Peptides assigned by the DPD software as candidates for quantification for vitellogenin from Cyprinus carpio. Direct labeling: 1µg of unlabeled protein and 2µg 18 O-labeled protein, samples were mixed in a 1:1 ratio before MALDI analysis. The expected direct ratio is 0.5 corresponding to the unlabeled/labeled ratio (1/2). Inverse labeling: 1µg of 18O-labeled protein and 2µg of unlabeled protein, samples were mixed in a 1:1 ratio before MALDI analysis. The expected inverse ratio is 2 corresponding to the unlabeled/labeled ratio (2/1). (note: the inverse ratio is expressed in the table as (inverse ratio)-1 for simplicity. In this way the direct and inverse ratios may be compared easily since both have the same value of 0.5). For the direct method the amount of protein calculated was the lower of 1µg whilst for the inverse method was the higher of 2µg. DPD software parameters used: Peak intensity - 5; Peptide mass tolerance ±0.25Da; experimental overlapping - 2; Ratio I4/I0 - 0.15. ÌSignificant differences between D&I ratios (p<0.05, t-test). ...137 Table V. 4. Quantification of Vtg from Cyprinus carpio fish plasma by enzyme-linked immunosorbent assay (ELISA) and by DPD. Nonparametric Mann-Whitney U-test: no statistical differences were found between both quantitation methods...139 Table V. 5. Relative labeling efficiency of peptides formed by the tryptic digestion of vitellogenin and postdigestion labeling in the presence of 97% H218O. ...141
V.9.SM.2. Comparison of the DPD peptides and the 4 most intense peaks in the mass spectra for all the proteins studied. Peak intensities of each peak are shown in branches
Chapter I.
Index
I.1 Proteomics, the new biology
Large-scale DNA sequencing has changed biological and biomedical research in a little period of time. As the DNA sequencing technique is spread among the scientific community the list of entire genomes decoded or at least entire sequences decoded, is growing exponentially. This decodification allows getting a better understanding in the insight of the operational parts of an organism [1]. Ultimately, our era has witnessed the answer to difficult biological questions thanks to the fact that DNA sequencing has allowed the understanding of intricate biological processes [2].
Genome, transcriptome, proteome and metabolome are names that generally refer to different compartments of biological complexity within a living organism. The part that studies the proteome is referred to as Proteomics.
The study of proteomics, defined as the entire complement of proteins, including the modifications made to a particular set of proteins, produced by an organism or system, presents many challenges. Nowadays it has been clearly established that a gen or group of gens can support the information to produce one protein or proteins, yet this does not necessarily means that such protein(s) is(are) presented (expressed) in the proteome of a living organism. Furthermore, once a protein has been produced it may suffer a series of modifications called post-translational modifications, and therefore the final protein does not correspond with the original design corresponding to the information contained in the gen or gens. Therefore much of the present attention devoted to proteomics relies in its capability to unravel the secrets of the biological systems whilst overcoming the limits of classical biochemical approaches [2-4].
Originally the word proteomics was associated to the study of a large number of proteins from a given organism or cell by means of two dimensional polyacrylamide gels, 2D-PAGE [5,6]. However, to determine the identity of the proteins was difficult by this method. In the 1990s mass spectrometry (MS) emerged as a powerful tool with which overcome the limitations inherent to 2D-PAGE and protein identification [2]. Nowadays MS-based protein identification by means of peptide mass fingerprint, PMF, or peptide fragment fingerprint [7-9] is broadly adopted, and the transition from analyzing one protein at a time to analyzing proteins in highly complex mixtures has been made [10,11].
modifications, to elucidate protein structure and function, and to establish correlations between genes and proteins.
I.2 Sample preparation for mass spectrometry-based protein identification
The identification of proteins is becoming more important to the scientific community due to emerging issues related to proteins critically significant to the society. Many hereditary diseases, cancer and other common illnesses, such as diabetes, can be distinguished on the basis of the expression of certain proteins, known as biomarkers. As a result, disease screening and medical diagnosis take advantage of MS-based technological improvements that allow protein identification [12,13].
Gel-based and gel-free are the two main approaches used in proteomics research. The first one is based in the resolving power, semi-quantitative nature and instant visualization of proteins separated by gel electrophoresis in the first or in the second dimension. However, gel-based approaches lack in reproducibility, are expensive in the second dimension, and are considered labor intensive [14,15]. Gel-free approaches are mainly based in the coupling of high performance liquid chromatography, HPLC, and mass spectrometry. The proteins are digested into peptides either off- or on-line, and then the peptides are separated by HPLC. The identification of the proteins is done through the information retrieved from the peptides using mass spectrometry either off-line using matrix assisted laser desorption ionization, MALDI, or on-line using electrospray ionization, ESI [16].
General aspects of sample preparation steps for both, gel-based and gel-free proteomics are described on the following sections.
I.2.1 In-gel protein digestion
proteins [18]. To run the first dimension of 2D-GE, samples are loaded into isoelectric focusing (IEF) gel strips containing ampholytes.
When a protein is placed in a medium with a pH gradient and then is subjected to an electric field, it will initially move toward the electrode with the opposite charge. During migration through the pH gradient, the protein will either pick up or lose protons. As it migrates, its net charge and mobility will decrease and the protein will slow down. Finally, the protein will arrive in the pH gradient at the point equal to its pI. There, being uncharged, it will stop migrating. Once the first dimension is completed, and to prevent further re-oxidation, protein-cystine residues must be reduced using dithiothreitol (DTT) and the resulting cysteines blocked with iodoacetamide (IAA).
After focusing, IEF strips are soaked in SDS to prepare proteins for separation by molecular weight (MW) in the second dimension. When the separation is complete, proteins are visualized in the gel by staining with Coomassie Blue, fluorescent dyes, or with MS-compatible silver staining [19]. After protein separation and visualization, protein spots are excised and de-stained and usually digested with specific proteases as trypsin or Lys-C. The resulting pool of peptides are extracted from the gel peace and analysed by mass spectrometry with either ESI or MALDI as ionization technique. The resulting peptide profiling is matched against the theoretical masses obtained from the in silico of all protein amino acid sequences in the database. Then the protein in the database is ranked according to the number of peptides matching their sequence within a given mass error tolerance [20]. The in-gel digestion protocol presents several drawbacks, namely (i) trapping protein substrates in the gel makes some peptide bonds inaccessible to the enzyme, and (ii) not all the peptides produced during digestion can diffuse freely from the gel.
I.2.2 In-solution protein digestion
In-solution protein digestion, usually applied to whole-protein extracts is the base of shotgun proteomics but is also widely used in the analysis of purified proteins. There are key steps related to sample preparation issues that guaranty the success of the in-solution protein digestion.
the detection of less abundant proteins. So to facilitate the identification of less abundant proteins, some fractionation (e.g., organelle purification) or depletion to separate some proteins from another is needed [21].
As a general rule, protein extracts are first precipitated using cold acetone or TCA and then proteins are solubilizeded/denaturated in order to facilitate the action of proteolytic enzymes. To achieve this goal, several buffers have been described in literature, including some ones for specific types of proteins. As a general role, protein solubilization and denaturation are achieved by the addition of chaotropic agents such as urea or guanidine hydrochloride in order to break the intra-molecular forces that maintain secondary and tertiary structure of the proteins. Finally, to prevent protein renaturation before enzymatic cleavage, reduction and alkylation of protein disulfide bridges are frequently done using DTT and IAA [22].
As previously mentioned, trypsin is one of the enzymes used for protein digestion. However, care must be taken, when high urea concentration is used. Normally, trypsin retains most of its activity in 2M urea, 2M guanidine HCl or 0.1% SDS. Protein digestion is usually performed for 12–24 hours, due to protein heterogeneity in samples. Finally, the reaction is stopped by adding an acid, such as trifluoroacetic or formic, to a final pH of 2–3. Then, the digest can be analysed by bi-dimensional chromatography coupled to tandem mass spectrometry [22].
I.3 Accelerating protein digestion
I.3.1 Microwave energy
Microwave-assisted protein enzymatic digestion under controlled microwave irradiation was first reported in 2002 [24], and have been used for both in-solution [24] and in-gel digestion [25]. Using this methodology, digestion times required to get a complete digestion are lowered from 12-24h up to 20 min.
Critical parameters, as irradiation time, temperature and power require careful optimization in order to maintain the benefits of microwave energy. For example, radiation power should be maintained below 30% of the total nominal power of the microwave oven; otherwise, temperature control becomes difficult [22].
Microwaves are known to catalyze reactions by inducing molecular perturbation by a stimulation of ionic diffusion, and also, by enhancement of dipole rotation without causing any rearrangement of molecular structures. This mechanism differs from conventional heating due to the dipole rotation that constitutes an alternative efficient form of molecular agitation. It is due to this added molecular agitation that increased molecular catalysis is thought to occur.
I.3.2 Ultrasonic energy
I.3.2.1 Basics on ultrasonic energy
When ultrasonic waves cross through a liquid media, an effect known as cavitation occurs [26,27]. The name cavitation defines a physical process by which numerous tiny gas bubbles are generated. Those bubbles, grow, oscillate, split and finally implode, in such a way, that they can be considered as micro-reactors in which temperatures near to 5000ºC and pressures of 1000atm are reached.
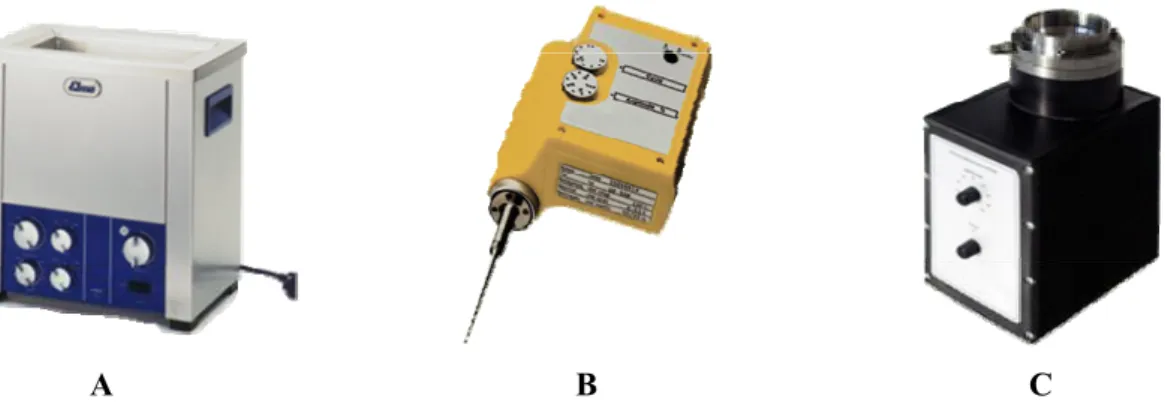
Nowadays ultrasonication can be applied in two main ways with different devices, direct ultrasonication can be applied with the ultrasonic probe whilst indirect sonication can be applied with the common ultrasonic bath or with the sonoreactor. Figure I.1 shows three examples of ultrasonic devices.
A B C
Figure I. 1. Example of ultrasonic devices: A- ultrasonic bath; B- ultrasonic probe and C- Sonoreactor
As a general role the influence of the following variables should it be studied when the optimization of a methodology of sample treatment is done through ultrasonication: (i) particle size, if a solid is studied; (ii) reagent(s) used in the treatment; (iii) sample volume; (iv) sonication time; (v) temperature; (vi) frequency of the ultrasonic energy; (vii) for the case of an ultrasonic bath, the position in which the sample container is situated inside the bath (vertical and horizontal position) and finally (viii) amplitude of sonication.
I.3.2.2 Indirect sonication: the ultrasonic bath and the sonoreactor
Indirect sonication means that the ultrasonic waves need to cross the wall of the sample container. The ultrasonic bath is not a powerful tool; the irradiation power given by a common ultrasonic bath is comprised between 1 and 5 Wcm−2. When used for analytical tasks, the ultrasonic bath lacks in reproducibility. Finding the highest intensity place of sonication inside an ultrasonic bath is always a critical issue, to do so, the so-called “aluminum foil test”, which is done to find the best place inside the bath in terms of sonication intensity [28].
sterile or dangerous pathogenic ones. In the cup horn, the titanium probe is held within an acrylic cup filled with water. Samples are placed within the cup, above the probe. The cavitation produced in the immersed samples is higher than the one given by an ultrasonic bath but it is lower than the cavitation produced by direct immersion of the ultrasonic probe into the solution. Both systems allow refrigeration.
I.3.2.3 Direct sonication: the ultrasonic probe
The ultrasonic probe is directly immersed in the sample, giving direct in-sample sonication. Two are the main differences when comparing the ultrasonic probe with the ultrasonic bath. Firstly, the ultrasonic probe is immersed directly into the solution, where the sonication takes place, and secondly, the ultrasonic power provided by the probe is at least up to 100 times greater than the one supplied by the bath. Those major differences make each system devoted for a different set of applications. The probe is a powerful system for the solid–liquid extraction of analytes that can be extracted but can also be degraded. There are dedicated probes for a given range of volumes. It should be stressed that the amplitude control of the probes allows the ultrasonic vibrations at the probe tip to be set to any desired level. However, to achieve cavitation, normally it is not necessary to use high amplitude levels; otherwise the probe will deteriorate rapidly. Temperature is another factor that must be controlled. As the ultrasound is delivered into the solution, a slow but constant increase in the bulk temperature is achieved and, at one point, the physical characteristics of the liquid media changes so that a decoupling of the probe can occur and no more cavitation is achieved. At this point the procedure must be stopped and the solution refrigerate. If long sonication times are needed the “pulse” mode is recommended.
I.3.2.4 Accelerating protein digestion with ultrasonic energy
Ultrasonic-assisted enzymatic digestion was first introduced in 2005 [29].This method was successfully applied to the in solution and in-gel protein digestion, thus effectively reducing the digestion time from overnight (12 h) to less than 5min [30,31]. In the in-solution protein digestion, the procedure entails sonication of small volumes of sample, typically 20–50PL while the trypsin digestion proceeds. The ultrasonic treatment probably boosts enzyme-substrate kinetics by the enhancement of mass transfers processes in the solution. In the in-gel protein digestion, slides of gel containing protein can be submitted to the same procedure: once excised, the gel piece is placed in an Eppendorf cup and a small amount of a buffer containing the enzyme is added. The liquid jets produced by the ultrasonication act as micro-syringes [32], delivering the enzyme into the gel and making the protein digestion faster. The mechanical erosion of the gel surface caused by the cavitation associated with ultrasonication enhances peptide release from the gel.
The recent advances in ultrasonic energy performance have led to the development of new and powerful devices, whose many possible applications has only become recently to be known [26,33].
I.4 Beyond protein identification - quantitative proteomics
Whilst no long ago qualitative protein identification was considered enough to describe a biological system, at the present time protein identification and quantification have become mandatory to address the same aims. All modern biosciences are given special attention to the changes that occur in the proteome as important information can be retrieved that may be linked to important medical and biological processes. The changes in the expressed proteins in a given type of cells, tissue or organism need to be detected with the highest accuracy and precision possible. These changes can be linked to cellular and tissue localization, to signaling cascades, and to changes due to disease or drug treatment.
spectrometry-based technologies and the development of different types of stable isotopic labeling reagents and label-free approaches, mass spectrometry-based quantitative proteomics is, nowadays, the ultimate technology used to quantify proteins. In the next sections we will briefly describe the above mentioned methods for protein quantification.
I.5 Gel-based quantification methods
Native or denatured proteins can be separated through GE in the first or in the second dimension. Once the proteins have been separated they are stained with different reagents such as coomassie blue, silver nitrate or fluorescent dyes.
A general method to quantify proteins separated by GE is densitometry. Densitometry is the quantitative measurement of optical density in light-sensitive materials. Optical density is expressed as the number of dark spots in a given area.
Gel densitometry is widely used for protein expression studies; however some drawbacks have been reported. For example, the low linearity ranges of work, usually of 1-2 orders of magnitude [34]. Nevertheless, and depending on the reagent used for staining, the order of magnitude can be varied, as it is showed in table I.1.
Table I. 1. Protein staining for gel electrophoresis-based quantification of proteins [35].
Protein Stain Lower Limit
of Sensitivity Linear Range Cost Imaging System Requirements MS Compatibility
Coomassie Blue R-250 stain 10–25 ng 2 orders of
magnitude + Densitometer +++++
Bio-Safe Commassie G-250
stain 5–10 ng
2 orders of
magnitude ++ Densitometer +++++
Silver stain kit - Merril
method 0.5–1 ng
1 order of
magnitude +++ Densitometer Not compatible
Silver Stain Plus kit 0.5–1 ng 1 order of
magnitude +++ Densitometer ++
Dodeca silver stain 0.5–1 ng 1 order of
magnitude +++ Densitometer +++
SYPRO Ruby protein gel
stain 1–10 ng
3 orders of
magnitude +++++ Fluorescent ++++
Flamingo fluorescent gel
stain 0.25–0.5 ng
>3 orders of
Another drawback is the low reproducibility of the separations done by gel electrophoresis in the second dimension. 2D-gel electrophoresis it requires to be done by skilled personnel otherwise many problems are encountered when the same sample is run several times.
I.5.1 Differential gel electrophoresis
Modern gel electrophoresis research offers powerful software-based image analysis tools primarily to analyze biomarkers by quantifying individual, as well as showing the separation between one or more protein spots on a scanned image of a 2D-GE.
Difference gel electrophoresis - DIGE can be used to highlight differences in the spot patterns. This quantification technique is done on intact proteins, and the differential expression determination is based on fluorescence.
In this technique, three different fluorescent labels (e.g. Cy2, Cy3, and Cy5, see figure I.2) with different absorbance and emission characteristics, are used to covalently modify the amino group of lysines in proteins via an amide linkage.
O
O N
O
O
N N+
O C
H3 CH3
CH2CH3
N N+
C
H3 CH3 H3C CH3
CH2CH3
O O N O O N C H3 CH3
CH3 N+ CH3 C H3 O O N O O
NSH-Cy2 NSH-Cy3 NSH-Cy5
Figure I. 2. N-hydroxy-succinimidyl esters of Cy2, propyl Cy3 and methyl Cy5 used for DIGE labeling of lysine residues [37].
The 2D-GE itself does not generally allow the resolution of proteins with high (150kDa) or low (10kDa) molecular weights, or very basic or hydrophobic proteins.
The fluorescence analysis itself comes with some problems such as high background, the detection of signals from non-protein sources and the overlap of signals from different fluorophores [37].
I.6 Mass-spectrometry based protein quantification
Proteomics aims to analyze as much proteins as possible in the same experiment. Until recently, mass spectrometry was used to characterize complex mixtures of proteins in a qualitative approach.
Mass spectrometry is nowadays a powerful tool for protein quantification, both in a relative or absolute manner, with a continuously growing interest among the research community, as it is showed by the large amount of reviews published regarding this item in the last years, 183 since 2005 (key searching words: protein quantification and mass spectrometry; searching engine: scopus). Those reviews cover a broad area of research activities, including proteomics, genomics and medical care or food chemistry.
The quantification of proteins can be done following two main ways. The first approach is named label-free quantification of proteins and it is based on the measurement of the area of the mass spectrometry peaks belonging to the specie of interest. Theoretically, this area is directly proportional to the concentration of the analyte of interest in a given range.
The second approach it takes advantage of the so called isotopic labeling; the basis of which is the increment in the mass of any chemical specie when one atom is substituted by one heavier isotope or when a chemical tag is added to the molecule of interest. The key of this method is that the mass increment can be easily followed through the mass spectrum and in some cases the intensity of the mass peak of interest can be linked to the concentration of the analyte studied.
I.6.1 Label-free methods for protein quantification
addition, those steps can lead to irreproducibility and loss of target peptides. It also eliminates the need for the synthesis of expensive isotopically labeled reference peptides. However in this methodology there is a greater need for reducing potential interferences that could lead to suppression effects. This leads to an increased need for high-resolution or multidimensional chromatography to reduce suppression effects and to allow the detection of low-abundance proteins. In addition, there is the challenge of normalizing the data so that accurate quantification can be done across multiple samples and multiple analyses. Two approaches are currently being used to compare samples: normalizing and aligning the chromatograms(and using the peptide MS data), or using the MS and/or MS/MS spectrato normalize the data [38].
Label free methods are far of being fully accepted among the scientific community since a number of serious drawbacks seem to be difficult to overcome. As an example in a 1D-LC-MS it has been reported that only 66% of peptides which were present in one analysis were also present in the second LC/MS run, and that ten replicate analyses were needed before no new peptides were detected [39]. Furthermore, label-free approaches do not allow for sample multiplexing neither can avoid matrix-dependant suppression effects [38,40]. For the aforementioned reasons label-free techniques are generally considered inferior in their quantification accuracy when compared to methods relying on stable isotopes. Furthermore the accuracy and linearity of label free techniques is still in question [41].
I.6.2 Methods based on isotopic labeling
I.6.2.1 Monitoring
Quantification can be done by comparing targeted ions from labeled and unlabeled standards with respect to the peak heights or areas of labeled versus unlabeled analytes. Quantification of analytes based on isotopically labeled internal standards was first reported for GC-MS [42]. In selected ion monitoring, SIM, instead of scanning all of the possible m/z values, only selected ions are measured. This approach can improve the limits of detection for an analyte by several orders of magnitude.
high sensitivity and specificity are achieved by only allowing a selected peptide to pass through the first quadrupole and enter the collision cell (Q2). Inside the collision cell, the peptide dissociates into fragments specific to the amino acid sequence of the precursor peptide. A second stage of specificity is added in the second MS (Q3), and only a specific fragment is allowed to pass through and strike the detector. By repeatedly cycling through a list of selected reaction monitoring, SRM, ion pairs associated with a set of specific retention times, multiple peptides can be targeted in a single multiple reaction monitoring (MRM) experiment.
The use of MRM technique for the absolute quantification (AQUA) of proteins was first introduced by Steven Gygi in 2003 [44]. Absolute quantification workflows include stable isotope labeled (2H, 13C, or 15N) versions of the targeted peptides. The endogenous and isotopically labeled peptides co-elute (or nearly co-elute in the case of deuterated standards) from reversed-phase high performance liquid chromatography (HPLC) columns, and will behave identically in the mass spectrometer with the exception of the introduced mass shift. Both versions are monitored and quantified, and their concentrations are determined from the relative responses (peak heights or peak areas) of the spiked-in compound to the target analyte [38]. Normally this approach is limited to a reduced number of proteins because suitable internal standards need to be identified and synthesized. The internal standard, because it is present in every sample, means that more accurate expression ratios can be calculated. It is not possible to calculate an accurate “treated vs. control” expression ratio if there is no peptide detected in the control sample. With an internal standard, if no signal is detected in the sample, and the internal standard is detected, then you can be certain that the level of that peptide in the sample is below the detection limit.
For an experiment with multiple treatments, the use of an internal standard ensures that all of the treatments can be compared with each other (e.g. treatment 1 vs. control, treatment 2 vs. control, allows the calculation of treatment1 vs. treatment 2).
I.6.2.2 SILAC Labeling
SILAC is the acronym of stable isotope labeling with acids in cell culture. In this method the labeling of the proteins is done in vivo, since the incorporation of the normal or heavy amino acids is done during the grown of two cell populations, that are identical except that one of them is make to grown in a medium that contains a form of amino acids without heavy isotopes added whilst the other is make to grown in a medium that contains such amino acids [46,47]. These “heavy” amino acids have been prepared with stable isotopic nuclei, such as 2H, 13C and 15N. The basis of this approach relies in that when the labeled analog of an amino acid is supplied to cell in culture it is incorporated into the new proteins that are synthesized during the cell growing. The amino acids generally involved in this labeling are arginine, leucine and lysine. The main advantage is that the labeling is uniformly done in every protein. As main disadvantages may be cited that sample complexity is not reduced, it is no applicable to human samples, and that arginine can be inter-converted to proline [38].
I.6.2.3 ICAT Labeling
ICAT is the acronym of isotope-coded affinity tags. It was first introduced by Gygi and Aebersold in 1999 [48].The reagent consists of three elements as it is showed in figure I.3. N H N H S O NH O O O NH O R R R R R R R R O CH
Figure I. 3. Chemical structure of the original ICAT label. Heavy reagent, d8-ICAT (R-deuterium); Light reagent, d0-ICAT (R-hydrogen) [38].
The original ICAT reagent is composed by a thiol reactive group, iodoacetamide, a spacer that contains either eight oxygen atoms (light) or eight deuterium atoms (heavy) and an affinity tag, biotin, this simplifies the analysis of the ICAT reagent-labeled peptides by
selecting and concentrating the cysteine-containing peptides, thereby reducing the complexity of the peptide mixture.
The cleavable ICAT reagent (cICAT) was introduced in 2003 [49,50]. This new version of ICAT retains the main structure of the original ICAT, but the oxygen/deuterium atoms are substituted by nine 12C atoms (light) and nine 13C atoms in the heavy version.
The heavy reagent with nine 13C atoms is +9 Daltons heavier than the light reagent. Mass spectrometric comparison of peptides labeled with heavy and light reagents provides a ratio of the concentration of the proteins of interest. This new reagent eliminates the potential confusion of a double ICAT label and an oxidation, both of which would have lead to a +16Da mass shift. In addition deuterium causes a slight shift in retention time in RP-HPLC, with the heavy form eluting slightly earlier than the light form. Furthermore, cleavage of the biotin moiety after affinity purification and before the MS analysis helps to improve the quality of the CID spectra, leading to the identification of a larger number of proteins.
The labeling occurs at the protein level and it is a chemical labeling that it takes place in the cysteines, which is its main drawback, since only peptides with cysteines are labeled, yet this means that, in comparison with the SILAC method, sample complexity may be reduced. This is because cysteines are only the 1.42% of all amino acids [51]. It also makes impossible to detect changes in the 20% of proteins that do not contain cysteine residues [52]. Two disadvantages to be mentioned are that side reactions with methionine residues may occur and that only two labels are available, meaning only two samples may be compared.
I.6.2.4 iTRAQ labeling
The SILAC and ICAT methods allow only the comparison of two treatments in a single analysis. The need for the comparison of larger number of treatments led to the development of the 4 or 8 plex iTRAQ which may be used to compare up to four or eight samples in a single analysis. The iTRAQ technique was first described by Ross et al. in 2004 [53] and is an isobaric tagging compound consisting of a reporter group (variable mass of 114-117Da or 113-121Da) a balance group at lysine side chains and at peptide N-termini.
ions. The isobaric nature of the iTRAQ-labeled peptides allows the signal from all peptides to be summed in both MS and MS/MS modes thus enhancing the sensitivity of detection.
I.7 Isotopic labeling of proteins with 18O
The use of 18O as a label in isotopic studies in biochemistry can be trace back to the work done by Boyer et al. in 1956 [54]. However, the use of 18O-labeling for protein quantification and protein differential expression has recently recalled the attention in research due to its almost perfect characteristics. Enzymatic labeling with 18O-water is easy to do and all the peptides formed during the protein cleavage are labeled. The resulting mass shift from 18O incorporation does not alter the chromatographic separation or the ionization efficiency of the labeled peptides. The characteristics, variables and applications of 18O-labeling will be commented below.
I.7.1 Chemical reactions involved in the 18O labeling of proteins
It is generally agreed that the 18O-isotopic labeling of peptides can be considered as consisting in two different chemical reactions. The first one is an amide bond cleavage whilst the second reaction is a carboxyl oxygen exchange. Both chemical reactions can be written as follows [55]:
(i) First reaction: amide bond cleavage
RC16ONHR´ + H218O → [RC16O18O]− +[H3NR_] (ii) second reaction: carboxyl oxygen exchange
[RC16O18O]− +H218O → [RC18O18O]− +H216O
As may be seen peptides incorporate one 18O in the first reaction, during the enzymatic cleavage. If this reaction is done in pure 18O-water (normally 95% reach in H218O) then it can be considered that almost 100% of the peptides will be labeled with one 18
O. If the reaction is done in mixed 16O/18O-water, then the labeling ratio will be proportional to the percentage of H218O in solution: the higher the amount of H218O the
In any case, the labeling cannot be studied without taking into consideration the second reaction, the carboxyl oxygen exchange. This reaction is an equilibrium, which ideally should be displaced towards the double oxygen incorporation, since the introduction of two oxygen in a peptide shifts its mass 4Da, facilitating the identification of the labeled peptide and its quantification by mass spectrometry-based techniques.
Both, the amide bond cleavage and the carboxyl oxygen exchange reactions, can take place at the same time, which is the principle of the direct 18O-labeling procedure; or separately, in two steps, which is the basis for the decoupling method. In the next sections the differences between both procedures along with the variables affecting the performance of each one will be commented.
I.7.1.1 The direct labeling
Digestion of proteins in the presence of 18O can isotopically label the resulting peptides. When the peptide bond is broken one atom of heavy oxygen is incorporated and further incorporation is done trough the carboxyl oxygen exchange at the same time.
Typically the protocol for 18O-labeling is very similar to a normal in-solution digestion. First proteins are solubilized/denaturated then reduced and alkylated and finally digested with trypsin in the presence of heavy water. The direct labeling can be done accelerating each step with the aid of ultrasonic energy or not [55].
The main advantage of this procedure is simplicity and speed. In addition, it can be used in on-line approaches. The main drawback is the lack in labeling efficiency, which makes direct labeling suitable only for relative quantification and for studies regarding proteins over-expressed or under-expressed [56].
I.7.1.2 The decoupling procedure
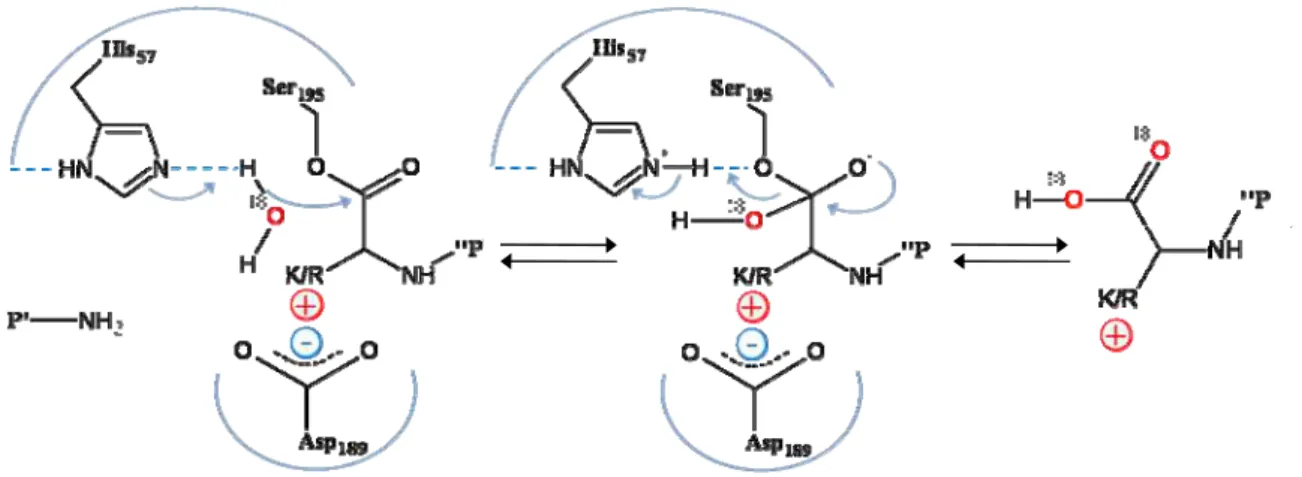
The decoupling procedure was first proposed by Yao et al. who have demonstrated that the cleavage of the protein can be done separately from the labeling in such a way that almost total double oxygen incorporation can be achieved using the carboxyl oxygen exchange process. The carboxyl oxygen reaction is shown in figure I.4 [57, 58].
Figure I. 4. Mechanism of the double oxygen incorporation by carboxyl oxygen exchange.
In addition to the four main steps of the direct procedure, as described above, it is necessary to dry the sample, once the protein has been digested. Then the sample is recomposed in a solution of acetonitrile/ammonium bicarbonate, that facilitates peptide solubilization and that lowered the pH of the solution to speed the subsequent carboxyl oxygen exchange process. Then the sample is dried again and finally recomposed in 18 O-water. Finally, the labeling takes place.
The advantage of this procedure is that a higher degree of peptides are double labeled in an efficient maner, which is extremely important for the accuracy of the quantification, as it will be shown in the next sections. Nevertheless this procedure takes longer than the direct method, usually 12h, if ultrasonication is used to speed the protein digestion step; otherwise it takes 24-48h. In addition, it cannot be done on-line, and consequently it is hard of automation.
I.7.1.3 The use of immobilized enzymes
Enzymes, such as trypsin, can be immobilized in solid supports that can be used either for protein digestion/labeling in a single step (direct labeling) or in different ones (decoupling procedure). The main advantage of using immobilized enzymes is that once the solution is separated from the solid support, then the protein digestion is stopped and the carboxyl oxygen exchanges is slowed down to almost a negligible effect. This is very important for online approaches, where the sample will be mixed with solvents containing
16
presence of peptides coming from the autolysis of the enzyme is negligible and thus the interferences that they may cause in the subsequent measurements by mass spectrometry are avoided [59].
I.7.2 The problem of the 18O-labeling efficiency
The 18O-labeling of peptides following any of the approaches described previously, results in a mixture of non-labeled, single labeled or double labeled peptides. The efficiency in the labeling depends not only on the protocol followed, but also in different variables affecting each protocol, such as pH, type of enzyme used, peptide characteristics, labeling time and conditions of labeling. In addition, the contribution to the peak intensities from the naturally occurring isotopes, others than 18O, such as 13C and 15N, needs also to be considered.
The variability in the labeling efficiency makes extremely difficult the interpretation of data from complex protein mixtures, such as proteomes, making hard to distinguish highly up-regulated from highly down-regulated proteins or C-terminal peptides, in studies regarding differential proteomics. This problem is even worst when the direct method is the choice to perform the labeling.
To overcome the labeling efficiency problem, different algorithms have been proposed [60]. Other approaches to solve this problem focus on the sample treatment itself, trying to make the labeling as complete as possible, thus minimizing the effects on the efficiency to a residual level.
I.7.3 Variables affecting 18O labeling of proteins
I.7.3.1 The enzymes used for 18O labeling
![Table I. 1. Protein staining for gel electrophoresis-based quantification of proteins [35]](https://thumb-eu.123doks.com/thumbv2/123dok_br/16483471.732620/45.892.132.814.693.1060/table-protein-staining-gel-electrophoresis-based-quantification-proteins.webp)
![Figure I. 2. N-hydroxy-succinimidyl esters of Cy2, propyl Cy3 and methyl Cy5 used for DIGE labeling of lysine residues [37]](https://thumb-eu.123doks.com/thumbv2/123dok_br/16483471.732620/46.892.120.746.622.841/figure-hydroxy-succinimidyl-esters-propyl-methyl-labeling-residues.webp)