Feasibility of nuclear power and desalination on El-Dabaa site
Mohamed M. Megahed
Nuclear Power Plants Authority, P.O. Box 8191, Nasr City, Cairo 11371, Egypt email: [email protected]
Received 31 January 2007; accepted in revised form 17 March 2008
Abstract
Due to the limited fossil fuel energy resources and the almost fully utilized hydro energy, Egypt has been considering for sometime the various options for satisfying the increasing demand for electricity, including nuclear energy. At the same time, Egypt is largely dependent on the River Nile for the supply of its fresh water needs. The annual Nile water coming to Egypt was fixed by the Nile Water Agreement, concluded in 1959 between Egypt and Sudan to 55.5 billion m3. Due to the increase of population and the constant fresh water resources, the annual renewable fresh water per capita decreased from 2560 m3 in 1955 (classified as water abundant country) to 1123 m3 in 1990 (classified as water stressed country). In 1997, the Egyptian fresh water per capita fell below 1000 m3, indicating that it has become a water scarce country. In the past 30 years desalination plants of various sizes and technologies have been introduced to Egypt as a solution to the problem of limited natural fresh water resources in remote and isolated areas, as well as for industrial applications. Demand on desalination technologies will continue to increase in all sectors, particularly in the industrial, power and tourist sectors, and for all types of feed water including sea, brackish, industrial waste and possibly agricultural drainage water. However, desalination technologies are investment-intensive and, generally, economic on large scale. In this regard, a nuclear reactor providing electricity to the grid can in principle provide also electricity and/or heat to a desalination plant. The Nuclear Power Plants Authority (NPPA) submitted in 1997 a project request, under the IAEA regular programme of technical co-operation for 1999–2000, to carry out a feasibility study of nuclear power and desalination plant on El-Dabaa site. The feasibility study was carried out from January 1999 to May 2001 and was updated in 2003. This paper summarizes the main findings of the feasibility study.
Keywords: Nuclear desalination; Feasibility study; Egypt
1. Introduction
Demand for energy and electricity continues to grow in Egypt, and this must be satisfied in order to maintain economic growth. Also, in view
of the unavoidable decline in the per capita share of the more or less constant natural fresh water resources in Egypt, seawater desalination is ex-pected to play an increasing role in mitigating future deficit in potable water supply, particularly Desalination 246 (2009) 238–256
doi:10.1016/j.desal.2008.0 .03 54
239
M.M. Megahed / Desalination 246 (2009) 238–256
in remote desert areas. Because of the limited fos-sil fuel energy resources and the almost fully uti-lized hydro energy, Egypt has been considering for some time the introduction of nuclear energy for electric power generation. A nuclear reactor providing electricity to the grid can in principle provide also electricity and/or heat to a desalina-tion plant. El-Dabaa Site, on the Mediterranean Sea coast, has been selected and qualified as a site for the first Egyptian nuclear power plant.
The reasons which led the country to promote launching a nuclear power program were basically the following:
• Steadily increasing demand for energy and electricity, caused by population growth, ur-banization, industrialization, and the desire and intention to improve the conditions and the standard of living of the people;
• Inadequate and insufficient known national primary energy resources to supply on a me-dium- and long-term the increasing demand for energy and electricity; also limited potable water resources, which will require the addi-tion of new sources of supply, in particular for remote areas.
• Perception of nuclear power as a convenient, economically competitive and viable source of energy which, if introduced in the country, would not only complement the traditional energy sources, but would also promote tech-nological development and serve as an incen-tive for social and economic progress. These reasons have not only retained their va-lidity, but have been reinforced by the develop-ments which have been taking place. Currently, energy and electricity demand continues to grow faster than population, and it is recognized that no economic development can be achieved with-out satisfying this demand.
In compliance with its mission and functions assigned by the Government of Egypt, the Nuclear Power Plants Authority (NPPA) has performed a feasibility study for the first nuclear power plant
(NPP) to be implemented in Egypt for the cogen-eration of electricity and desalted water. The fea-sibility study was carried out with technical as-sistance from the IAEA during the period 1999– 2001 and updated in 2003.
The main objective of the study was to pro-vide the decision-makers with the necessary in-formation regarding the technical and economi-cal feasibility and viability of the nuclear option for electricity generation and seawater desalina-tion. In particular, the study was intended to pro-vide the following information:
• Analysis of the Egyptian economic situation and estimation of future needs for electricity and water.
• Technical and economic evaluation of nuclear power generation and desalination systems. • Evaluation of local participation capabilities
and the impacts on the Egyptian developmen-tal efforts.
• Financing requirements and methods. • The necessary conditions for launching a
suc-cessful nuclear power and desalination project. • Recommendations on the use of nuclear en-ergy for electricity generation and seawater desalination.
The main findings of the feasibility study are presented below.
2. Demographic considerations
M.M. Megahed / Desalination 246 (2009) 238–256
240
the industrially developed countries. During the period 1947–1996, the average annual growth rate was about 2.35% [1].
Despite the apparent halt in urbanization or concentration around the capital, the mal-distri-bution of population in Egypt still persists as a result of the previous high urbanization rates. In order to return to a balanced population distribu-tion pattern, radical changes have to be made, to redistribute the population. This could only be achieved through developing new areas outside of the Nile Valley and Delta. To this end, Egypt has already started two mega-projects in Sinai (north east of the country) and Toshka (south west of the country) aiming at creating new agro-in-dustrial communities capable of absorbing as much as 6 million people by the year 2017. This, however, will increase the demand for energy, particularly in the form of electricity.
3. Energy and water situation
The availability of energy is a prerequisite of any socio-economic development in all countries, developing and developed alike. One of the most important conditions for sustainable development is the proper management and development of primary energy resources. The only significant primary energy resources in Egypt are crude oil, natural gas and hydropower. Unless new discov-eries are made crude oil reserves will be depleted within the next two decades. Hydropower is nearly fully utilized. There is a potential for solar and wind energies but the technology for large-scale
electricity production is not yet economic. Egypt needs will outgrow the primary energies on its territory and risks to become energy importer in the near future (probably by the end of the study period, i.e. by the year 2020).
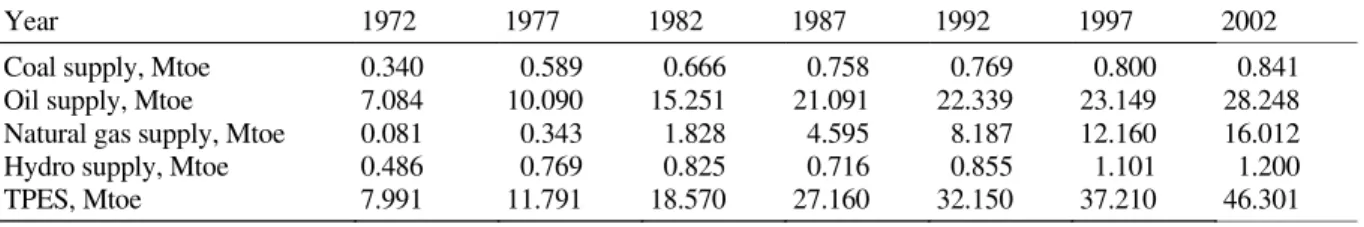
Total primary energy supply (TPES) has grown over the period 1972–2002 from7.991 million tons of oil equivalent (Mtoe) in 1972 to 46.301 Mtoe in 2002, at an average annual growth rate of 6%. Most of primary energy supply is petroleum en-ergy (i.e. oil and natural gas), the combined share of which increased from 89.6% in 1972 to 95.6% in 2002. Natural gas has played an increasing role in TPES over the past 20 years, as shown in Table 1. As a result, the share of oil supply in TPES decreased from 88.6% in 1972 to 61.0% in 2002, while the share of natural gas supply in TPES in-creased from 1% to almost 35% over the same period [2–4]. Non-commercial energy is not in-cluded in Table 1, because it is not readily quanti-fiable. The average annual growth rate of TPES over the period 1972–2002 exceeded the popula-tion growth rate but was almost identical to that of the GDP over the same period.
Table 2 depicts total final energy consumption (TFC) by source over the period 1972–2002. The TFC increased in this period at an average annual growth rate of 6.2%. In the same period, electric-ity consumption increased at an average annual growth rate of 8.3%. This is reflected in the con-tinuous increase in electricity share in TFC from 9.9% in 1972 to 17.8% in 2002. The structure of the TFC has been almost constant over the study period at 49% for industry, 23% for transport, 24%
Table 1
Egyptian energy indicators
Year 1972 1977 1982 1987 1992 1997 2002
241
M.M. Megahed / Desalination 246 (2009) 238–256
for other sectors (including agriculture, public/ commerce and residential) and 4% for non-en-ergy uses.
There are three main energy sources for elec-tricity generation in Egypt, namely: oil products, natural gas and hydro energy. Due to the increas-ing demand for electricity and the limited hydro resources, the demand has been met primarily through installation of fossil fuel thermal power plants. This led to the decline of the hydro share in total electricity generation from 69% in 1972 to about 19% in 2002.
The utilization of natural gas in electricity gen-eration increased dramatically over the past three decades. The share of electricity generated by natural gas to the total electricity generated in ther-mal power plants increased from 4% at the end of the 1970s to almost 70% in 2002 [5].
Energy demand depends in a complicated manner on the economic development, popula-tion and social development. Therefore, a mul-tiple regression analysis was carried out on his-torical data in the period 1970–2000 of TPES and GDP in constant US$ 1990, population and the percentage of female illiteracy as a measure of social development.
The resulting correlation was assumed to hold for the future energy demand under three assumed scenarios. The primary energy demand for the medium scenario is summarized in Table 3. As
Table 2
Development of total final energy consumption by source
Final energy consumption, Mtoe Structure of energy consumption, % Year
Coal Oil Gas Electricity Total Coal Oil Gas Electricity 1972 0.273 5.121 0.002 0.595 5.991 4.6 85.5 0.0 9.9 1977 0.656 7.583 0.187 1.024 9.359 6.0 81.1 2.0 10.9 1982 0.638 11.062 1.191 1.575 14.467 4.4 76.5 8.2 10.9 1987 0.666 14.601 1.871 2.365 19.503 3.4 74.9 9.6 12.1 1992 0.787 14.841 2.580 3.850 22.059 3.6 67.3 11.7 17.4 1997 0.764 17.704 3.532 4.324 26.324 2.9 67.3 13.4 16.4 2002 0.995 21.982 6.702 6.442 36.121 2.8 60.9 18.5 17.8
indicated in the table, total primary energy de-mand in the year 2020 could be as high as 95 Mtoe. Assuming that the present trends will continue in the future, the projected total final consumption (TFC) was estimated. The projected TFC by en-ergy source for the medium scenario is shown in Table 4.
Natural resources of fresh water can be classi-fied into conventional resources (renewed and fossil) and unconventional resources. Renewed freshwater resources include the River Nile, which is the only significant source in the country, rain-water run off and coastal rechargeable aquifers. Fossil resources include groundwater in the in-land desert and Sinai areas, which are character-ized by the absence of direct recharge. Uncon-ventional resources are: the Nile Valley and Delta aquifer, which is continuously recharged by irri-gation water, reused agricultural drainage water and treated waste water. Development of water resources and demand for freshwater are summa-rized in Tables 5 and 6 respectively, which show that, as of the year 2012, the available water re-sources will not be enough to meet the expected demand of consuming sectors.
consump-M.M. Megahed / Desalination 246 (2009) 238–256
242
Table 3
Projected demand of primary energy by type, Mtoe (medium scenario)
Year Coal Petroleum products Natural gas Hydro TPES
2005 0.919 29.597 19.726 2.723 52.964
2010 1.042 34.761 25.833 2.723 64.358
2015 1.184 40.947 33.416 2.723 78.270
2020 1.344 48.378 42.872 2.723 95.317
Table 4
Projection of total final energy consumption by source
Final energy consumption, Mtoe Structure of energy consumption, % Year
Coal Oil Gas Electricity Total Coal Oil Gas Electricity 2005 0.912 22.242 6.901 6.453 36.508 2.5 60.9 18.9 17.7 2010 0.989 25.766 9.653 8.098 44.506 2.2 57.9 21.7 18.2 2015 1.091 30.359 13.506 10.228 55.183 2.0 55.0 24.5 18.5 2020 1.210 35.898 18.766 12.875 68.840 1.8 52.3 27.3 18.7
Table 5
Anticipated development of freshwater supply, billion m3/y
Conventional resources Unconventional resources Year
Nile water
Rainwater run off
Rechargeable groundwater
Fossil ground-water
Nile Valley and Delta aquifer
Drainage water
Industrial waste-water
Treated sewage water
Total
2005 55.500 1.000 0.054 3.020 7.500 15.420 4.881 1.100 88.474 2010 55.500 1.000 0.056 3.603 7.500 15.420 5.332 1.300 89.710 2015 55.500 1.000 0.058 4.187 7.500 15.420 5.783 1.500 90.947 2020 55.500 1.000 0.059 4.77 7.500 15.420 6.234 1.700 92.183
Table 6
Projected freshwater supply, demand and deficit, billion m3/y
Sectorial demand Year
Irrigation Potable Industry Navigation Discharge to sea
Evaporation and losses
Total demand
Total resources
Deficit
243
M.M. Megahed / Desalination 246 (2009) 238–256
tion and reduction of distribution losses; and (iii) desalination of brackish water. Therefore, it is assumed in the present analysis that seawater de-salination will cover only 10% of the deficit in potable water supply. Desalination requirements to cover the expected deficit in potable water sup-ply are also shown in Table 7. Total capacity would increase from about 165 thousand m3/d in 2005
to more than 1.9 million m3/d in 2020. Some of
the future capacity in the years 2012 and beyond is expected to be sufficiently large in magnitude that it will support the installation of desalination production facilities larger than 100,000 m3/d.
4. Electrical system analysis
The utilization of electric energy in Egypt be-gan in 1893 with small diesel engines installed in Cairo and Alexandria to supply low voltage di-rect current electricity to some streets and houses. The first steam engine power stations were con-structed at El-Sarou, Belqas, and El-Atf in 1928 to supply the drainage pumps in North Delta. In 1959, the total installed capacity reached 511 MW. In 1960, the hydro plants were introduced with the commissioning of Aswan Dam hydro station with 345 MW installed capacity. The High Dam hydro plant was completed in 1970 with a total installed capacity of 2100 MW. By introducing the two main hydro power plants their installed
Table 7
Projected future seawater desalination inventory in Egypt
Expansion requirements of current uses Augmentation of water deficit Year
Total contracted capacity (1000 m3/d)
Actual operating capacity (1000 m3/d)
Water deficit
(1000 m3/d)
Required desalted capacity
(1000 m3/d)
Total desalted capacity
(1000 m3/d)
2005 202 165 0 0 165
2010 293 219 0 0 219
2015 401 272 6904 690 962
2020 527 326 15986 1600 1926
capacity accounted for about 65% of the total in-stalled capacity of 3775 MW in 1970.
During the period 1970–1980, the number of the thermal power plants remained relatively the same with some gas turbine installed from 1978– 1982 to meet urgent electric power requirements without any reserve capacity. During the period 1982–2002 and additional capacity of 11024 MW was added to the electrical power system to reach 16648 MW installed capacity.
The mix of the annual electrical energy gener-ated in Egypt, is approximately as follows, the details are shown in Table 8:
• 20% from hydro power plants, and
• 80% from thermal power plants (steam and combustion turbines): using heavy fuel oil and/ or natural gas as main fuel.
M.M. Megahed / Desalination 246 (2009) 238–256
244
Table 8
Development of electricity generation and peak load in Egypt (1972–2002)
Source: Egyptian Electricity Authority, Annual Statistical Report, several issues, 1976–2003.
As of FY 2001/2002 a total of 2441 GWh has been purchased from BOOT plants and 74 GWh has been purchasedf from industrial companies. A total of 251 GWh was generated by wind farms.
Electricity generation, GWh Share of electricity generation, % Thermal power plants Thermal power plants
Fiscal year
Steam turbines
Gas turbines
Combined cycle
Hydro power
Total
Steam turbines
Gas turbines
Combined cycle
Hydro power
Peak load, MW
1971/72 2176.2 79.1 0.0 5098.5 7353.8 29.6 1.1 0.0 69.3 1168.0 1976/77 4018.5 42.5 0.0 8520.2 1258.2 31.9 0.3 0.0 67.6 2097.0 1981/82 7963.5 3457.6 0.0 10474.3 21895.4 36.4 15.8 0.0 47.8 3694.0 1986/87 20396.0 5700.5 0.0 9104.7 35201.2 57.9 16.2 0.0 25.9 5803.0 1991/92 28138.7 5233.3 1905.7 10204.0 45481.7 61.9 11.5 4.2 22.4 7215.0 1996/97 30544.9 371.3 14753.5 11986.6 57656.3 53.0 0.6 25.6 20.8 9235.0 2001/02 49265.0 217.0 15553.0 15130.0 80267.0 61.5 0.3 19.4 18.8 13326.0
implies the need for substantial expansion of the electrical system, consisting mainly (more then 90%) of the installation of additional thermal gen-erating capacity, part of which could be nuclear [7].
The forecast has been developed using the econometric modeling, which uses the statistical methods to forecast load and energy as a function of economic and demographic variable. Regres-sion analysis for time series (RATS) is used to develop the forecast (based on the historical data) which relate some dependent variables to a set of independent or explanatory variables, i.e. the elec-tricity sales per class to one or more of the differ-ent econometric factors, i.e. GDP, GDP/sector, POP, GDP/POP, and the electricity price. Table 9 shows the medium scenario peak load forecasted, this values is used for the generation planning during the period 2005–2020.
5. Site characteristics and infrastructure
The El Dabaa Site (Fig. 1) was selected on the basis of a site selection study, through four steps in 1978–1979, exploring eleven pre-selected
po-tential areas on the Egyptian coasts (Mediterra-nean Sea, the Nile Delta, the Gulf of Suez and the Red Sea) [8].The site has been found adequate for installing nuclear units totaling at least 4000 MW(e) capacity. The main characteristics of El Dabaa site are the following:
• Low seismic activity of the region, the seis-mic design spectrum is scaled 0.2 g according the to USNRC Regulatory Guide 1.60. • There are neither recent or active faults in the
area.
• Suitable foundation basement for the construc-tions of the power block of the units and for the cooling water intake and discharge struc-tures.
• Suitable site topography to allow the location and arrangement of the nuclear power plant with minimum constrain and good protection against sea hazards.
• Low population density.
• Good location for electrical network and wa-ter desalination.
245
M.M. Megahed / Desalination 246 (2009) 238 –256
Table 9
Forecast of peak load — medium scenario
Year Peak load (MWe)
Rate of increase (%)
Energy (GWh)
Rate of increase (%)
Load factor (%)
2005 16648 6.0 106311 5.5 72.90
2006 17563 5.5 112698 6.0 73.25
2007 18529 5.5 118897 5.5 73.25
2008 19548 5.5 125436 5.5 73.25
2009 20624 5.5 132698 5.8 73.45
2010 21655 5.0 139333 5.0 73.45
2011 22738 5.0 146299 5.0 73.45
2012 23874 5.0 153614 5.0 73.45
2013 25068 5.0 161295 5.0 73.45
2014 26322 5.0 169822 5.3 73.65
2015 27638 5.0 178313 5.0 73.65
2016 29020 5.0 187229 5.0 73.65
2017 30471 5.0 196778 5.1 73.72
2018 31995 5.0 206813 5.1 73.79
2019 33594 5.0 217361 5.1 73.86
2020 35274 5.0 228446 5.1 73.93
M.M. Megahed / Desalination 246 (2009) 238 –256
246
less than 1/1000 of the permissible limits in regard to routine releases and less than 3% in case of accidental releases.
• The site, in addition to being suitable for nuclear power and for seawater desalination, is also favorably located with respect to the international interconnected transmission sys-tem.
The site has been allocated to the nuclear power plants programme in 1981. Since that time NPPA has developed the necessary infrastructure for the construction phase. This includes: electrical net-work, freshwater system, roads, communication system, environmental laboratories and training center. In addition, NPPA developed in coopera-tion with IAEA a master plan for developing the site during and after the construction phase.
6. Determination of plant capacity
The capacity of the nuclear power and desali-nation plant will depend on electrical grid con-siderations and projected demand of desalted water around the site. To add a new electrical ca-pacity to an existing system, the system should be capable of accommodating the added capacity safely and economically in normal and emergency operating conditions.
The largest unit capacity connected to the sys-tem is 625 MW(e) in El Korimat power station, the largest power station is High Dam station 2100 MW(e), the recorded peak load in year 2002 was 13326 MW(e) and the installed capacity is more than 16 GW. Based on a practical planning experience guidance that the added unit power should not exceed 10% of the system peak load, the system can accommodate the addition of 1600 MW at present; i.e. consider all commer-cial sizes available in the market — can be used for system expansion. This supports the findings of two pervious studies [9,10] that were carried out in 1978 and 1984 for interconnecting the
nuclear unit to the Egyptian grid. These studies concluded that the Egyptian grid, less than 10 GW at that time, could accept connecting 600 and 900 MW(e) unit sizes, for a 4000 MW(e) plant without any stability problems.
The nuclear power plant to be constructed in El-Dabaa will be a co-generation plant produc-ing both electricity and water. To assure potable water supply under all operational and mainte-nance conditions, and due to economic advan-tages, it has been found that the plant should con-sist of two identical units, to be built in sequence with a time-lag of about 2 years for LWRs or PHWRs. The electrical system could accept prac-tically any size among the available designs, nev-ertheless a unit size of the order of 600 MW(e) appears to be the preferable choice from the points of view of overall system characteristics largest unit in the interconnected grid, demand growth rate, reserve capacity requirements, system oper-ating reliability, financial risk and viability.
The town of El-Dabaa is one of the eight ad-ministrative centers that constitute the Matrouh Governorate, which includes the Mediterranean coastal area from west of Alexandria to the Libyan border. Borg El-Arab was one of the administra-tive centers of Governorate. But, as of 1 July 1993, Borg El-Arab was annexed to Alexandria. How-ever, because Borg El-Arab could be supplied by desalted water from the proposed nuclear desali-nation plant at El-Dabaa, and because the avail-able historical data for the Governorate includes the town of Borg El-Arab, it has been included in the present analysis.
To estimate the future potable water demand, the urban and rural specific water consumption in 2002 were assumed to increase with average annual growth rates of 3% and 2% respectively. The results for the area to be served by El-Dabaa desalination plant are summarized in Table10. As can be seen in the table, potable water demand will increase with an average annual growth rate of 7.6% to reach 110,000 m3/d and 190,000 m3/d
247
M.M. Megahed / Desalination 246 (2009) 238 –256
Because El-Dabaa plant is intended to replace the present potable water supply (AGWA pipe-line), it should satisfy the total demand. Assum-ing plant availability of 80%, the plant capacity has to be 20% more than the demand to assure the supply all the time. The required desalination capacities based on these assumptions are also shown in Table 10. Thus a nuclear desalination plant constructed to be operational by 2010 and beyond should be at least 120,000 m3/d. An
addi-tional capacity of about 12,000 m3/d would be
needed annually. Therefore, it is recommended to construct the plant with an overall capacity of 150,000 m3/d to accommodate the expanding need
at least for some following years.
7. Nuclear reactor market survey and selection
The survey of the world market in nuclear power plants resulted in identifying about 15 po-tential suppliers (single companies or joined in consortia), in principle willing and interested to provide Egypt with suitable nuclear reactors rep-resenting the latest state of technology. It has been found that there are several designs available which would satisfy the acceptability criteria of
Table 10
Projected potable water demand in the area served by El-Dabaa plant
Year 2005 2010 2015 2020
Urban
Population, '000 194 248 316 401
Specific water consumption, LCD 272 315 365 423
Water demand, m3/d 53000 78000 116000 170000
Rural
Population, '000 87 99 113 127
Specific water consumption, LCD 120 132 146 161 Water demand, m3/d 10000 13000 16000 21000 Total
Population, '000 281 347 429 529
Specific water consumption, LCD 193 230 273 324
Water demand, m3/d 63000 91000 132000 191000
Required desalination capacity, m3/d 76000 110000 158000 229000
Egypt regarding safety, reliability, economic com-petitiveness and financial viability.
The countries of origin of potential suppliers are: Canada, China, France, Germany, Japan, Korea (Rep. of), Russia, South Africa, Sweden and the USA. The types of power reactors include light and heavy water reactors (PWR, BWR and PHWR) in the size ranges of 600 MW(e) to 1500 MW(e). There is also a modular design high-temperature-gas-cooled reactor (PBMR) which might be offered commercially, depending on progress in the on-going development efforts. Relevant technical information on the reactors has been provided in response to an enquiry of NPPA. Nuclear power plants are reliable and have an accumulated operating experience ofmore than 12,000 reactor-years. The lessons learned have been used to improve design, construction and operation to achieve increased reliability and safety. The main criteria for acceptability of a cogeneration plant that would be operated reli-ably, safely and economically thus assuring pub-lic confidence and acceptance in Egypt are out-lined below.
(i) Reliability based on:
M.M. Megahed / Desalination 246 (2009) 238 –256
248
have its detailed design complete and be constructable anywhere. Having a plant in operation would give further assurance that the licensing and construction schedule can be met without delay.
• Proven features. Proven technology should be employed throughout plant design to minimize investment risk, control costs, take advantage of existing operating experience, and to assure its reliability. One way to assure proveness of the proposed plant design is to have a refer-ence plant.
• Operating experience and performance. The proposed reactor should have good in–service performance by applying regular improve-ments in areas like control of the outage dura-tion and spacing out of reactor refueling to-gether with high fuel reliability. This is ex-pected to result in excellent plant availability. (ii) Safety
• The proposed plant must be licensable in the vendor(s) country as an indication of its safety, and compliance with the regulations and safety standards of home country. In addition it must be licensable in Egypt and comply with the national regulations and safety rules.
• The proposed plant should be designed and built in accordance with internationally ac-cepted nuclear safety principles in addition to the national safety standards as applicable. – The safety and environmental concerns in
nuclear desalination are mainly to elimi-nate the possibility of radioactive trace pen-etration into the desalination system. – In the potable water within the levels
speci-fied by drinking water standards;
– In the brine and cooling water discharge within the levels specified in national regu-lations and international laws, as appli-cable;
– In the sea water used as feedwater within the natural background level.
(iii) Economic competitiveness
• The proposed plant must be of competitive costs and guaranteed construction time as they have strong influence on the economics. The basic analysis methodology which will be used to derive costs is that of life time levelized cost which gives the constant money price (in Cent/ kWh), that would need to be charged for each unit of electricity sent out by the plant, to ex-actly match its investment and operation costs over its working life, plus the costs of waste management and decommissioning. Adjust-ments will be made to these costs to reflect any additional costs anticipated for construc-tion in Egypt.
(iv) Financing viability
• The viability of financing at reasonable terms is a key factor, in particular with nuclear power. • It is thus essential that the financing bids be analyzed together with the economic analysis for total project evaluation.
• Also it is important that the proposed plant be of guaranteed schedule and cost, with plant de-sign based on proven technologies, licensable and tight management, to reduce the uncer-tainties and risks, for its direct influences on the financing viability.
Any reactor offered which meets the accept-ability criteria will be considered and evaluated. The following reactors were selected as candidate reactors due to the maturity of their designs and operational characteristics, leading to straight for-ward licensing and replication:
• PWR 600/1000 (by Framatom, Siemens, Com-bustion Engineering, Westinghouse and oth-ers in Russia, China, Japan and Korea). • ABWR (1100 MW(e) – class) (by Toshiba/
GE).
249
M.M. Megahed / Desalination 246 (2009) 238 –256
In addition to the above mentioned candidate reactors, other advanced reactors could be con-sidered as options if they will meet the accept-ability criteria and are commercially available for export to Egypt at the time of bidding. Advanced designs under development comprise two basic types: water-cooled reactors, utilizing water as coolant and moderator; and gas-cooled reactors, using helium gas as coolant and graphite as mod-erator.
8. Seawater desalination market survey and selection
The analysis and survey of seawater desalina-tion technologies, plants and suppliers has resulted in identifying RO, MED and MSF as suitable and commercially available technologies to be com-bined with nuclear reactors. The size as defined (150,000 m3/d) presents no technical challenge,
because the desalination plants follow in general a modular approach, combining several smaller modules to reach the overall plant capacity. There is a relatively large number of available experi-enced suppliers, and there is also experience in Egypt in desalination, which provides a good ba-sis for proceeding with project development and implementation. Regarding coupling of the power reactor with the desalination plant, there are sev-eral suitable technical solutions available to choose from, the optimal solution depending on the combination of reactor and desalination tech-nology adopted.
All commercial desalination technologies are reliable. The market share of processes is an indi-cator. Although MED is the oldest desalination process, its market share is very small compared to MSF and RO processes which dominate the market at the moment. MSF has historically dem-onstrated its effectiveness. The significant growth of RO over the past decade indicates its growing acceptability. If this trend continues in the future, RO will exceed MSF. Both thermal and membrane processes have their merits and demerits. To
se-lect the desalination technology suitable for cou-pling with a nuclear power plant on El-Dabaa site, the following criteria were considered.
(i) Assurance of potable water supply. Continu-ous supply of potable water is essential to the area. The thermal processes require stand-by boilers to operate when the nuclear power plant is down. Although this is pos-sible, it is not practical as the use of a boiler just once a year requires extreme shutdown procedures to prevent corrosion. Alterna-tively, huge unrealistic water storage would be needed. RO scores high in this respect as it can continue operation with electricity from the grid. However, if the nuclear power plant consists of two or more reactors, ther-mal processes can be used without the need for auxiliary boilers.
(ii) Cost of product water. The capital cost is lowest for RO followed by MED and MSF which is the highest. However, there is some concern regarding the frequency of mem-brane fouling in the Middle East RO plants. The recent successful use of microfiltration (MF) gives high confidence that fouling can be controlled. The cost of water produced by RO systems can be reduced by utilizing condenser’s cooling water as a feed to the RO system. However, this concept has not been validated experimentally. Therefore, NPPA is constructing an experimental facil-ity on El-Dabaa site to test this concept with technical assistance from the IAEA. (iii) Compatibility with the reactor. RO is not
M.M. Megahed / Desalination 246 (2009) 238 –256
250
may have an impact on operation of the nuclear plant. However, the experiences of Kazakhstan and Japan indicate that this is not likely to be a problem.
(iv) Local participation: This is considered a very important factor for Egypt. All processes will require importing certain key components. For example, Cu/Ni tubing for evaporation, membranes pressure vessels and high-pres-sure pumps for RO. However, it is expected that local participation in manufacturing ther-mal processes will be higher than RO. The Egyptian content in engineering, construc-tion, installation and O&M is expected to be high for both thermal and membrane pro-cesses.
(v) Assurance of spare parts: A major issue here is the availability of membranes for replace-ment since there is no local supply. Equal concern for Cu/Ni tubing, but they will not require replacement as frequently. With the large number of high quality membrane manufacturers now in business throughout the world, it is unlikely that a scarcity will exist. There is assurance that, if desired, one of several manufacturers would agree to li-censing an Egyptian company to manufac-ture the membranes as they have done al-ready in India, Spain, China, and others. (vi) Flexibility: Turndown ratio must be
consid-ered to compensate for fluctuation in de-mand. Both unit and system turndown ratio were considered. Other operational param-eters such as stability time, possibility of in-termittent operation and the size of storage reservoirs needed were also considered. These are summarized below:
Item Thermal processes RO process
Unit turndown MED: 120–45% 110–50%
ratio MSF:110–70%
System turndown MED: 120–10% 110–5%
ratio MSF: 110–20%
Coupling with Intermediate loop Mainly
NPP required electrical
Stability time MED: 3–4 h Minutes
MSF: 3–4 h (warm start) MSF:12–24 h (cold start)
Intermittent Not possible Easy
operation
Size of storage Huge Small
reservoir
(vii) Quality of product water: There are two dis-tinct qualities of water required: high purity for the nuclear power plant and WHO qual-ity for domestic drinking water. The high pu-rity water must undergo final demineraliza-tion to reach the necessary quality. At least part of the desalting capacity should be ther-mal and hybrid systems should be consid-ered.
(viii)Availability of water for construction: The water requirement for the construction pe-riod is estimated to be 12,000–15,000 m3/d.
Use of thermal processes would require con-struction of the boiler. RO uses power from the available grid and this makes more sense. It is suggested to build the infrastructure to handle the full size plant, but add one mod-ule at a time. The initial modmod-ule can be the unit used for production of construction water.
251
M.M. Megahed / Desalination 246 (2009) 238 –256
9. Socio-economic impact assessment
Implementing the nuclear power project will have major socio-economic effects on the immedi-ate vicinity of the plant. Most, but not all of them, will be positive. The largest impact will be felt dur-ing the construction period of the plant, in a similar way as it would be felt from the installation of any large industrial plant of comparable magnitude. As has been experienced in Egypt with the High Dam in Aswan and the Aluminum Complex in Nagaa Hammadi, in general, there will be a substantial impetus to local economic development, but a so-cial impact is also expected to occur, which will af-fect existing structures and traditional life styles. While most if not all will welcome the benefits of economic development, social changes might have some disturbing effects on the local population.
The major socio-economic effects derived from launching of the nuclear power program will affect Egypt on the country level. As has been experienced in countries which were at similar development levels and stages as Egypt when they have launched their nuclear power programs in the past, the effects to be expected in Egypt will be large and far-reaching. The introduction of this advanced technology will provide a major thrust to industrial, scientific and technical development. It will affect the energy and electricity sectors by promoting price stability, security of supply, di-versification of sources of supply, substitution of oil and gas, to name a few. On the whole, the nuclear power program will not only have a di-rect socio-economic impact on the country, but will also have catalytic effects, which in the long term might be even more important than the di-rect, immediate consequences. The socio-eco-nomic effects both on the vicinity of the plant and on the country level will be further analyzed, at-tempting to quantify them as much as possible.
10. Economic evaluation
The comparative economic evaluation of the
nuclear power option with fossil fuelled and other alternatives has been performed applying IAEA Desalination Economic Evaluation Program (DEEP) [11], and using the data of the IAEA, [12]. Another spreadsheet developed in NPPA was also used to calculate generating cost and to perform a cash flow analysis. The selected energy sources were generic water cooled reactors 1000 and 650 MW(e), (WCR-1000 and WCR-650), steam power plants 650 and 325 MW(e), (SPP-650 and SPP-325), combined cycle 500 MW(e), (CC-500) and integrated solar/thermal combined cycle 150 MW(e), (ISC-150). Seawater market survey iden-tified RO, MSF and MED as the most interesting large scale water production processes. In the mean time, MED has lower investment cost, and appears to be less sensitive to corrosion and foul-ing than MSF process. Therefore, MSF has been excluded from the economic assessment, having no inherent advantages over MED.
Assumptions for the economic evaluation in-cluded 10% real interest/discount rate, according to the Central Bank of Egypt, and US$ 24/bbl crude oil price with 1% real escalation. Main as-sumptions and cost input data are summarized in Table 11. The resulting levelized electricity and water costs for the coupled LT-MED and RO de-salination plants with various energy options are summarized in Table 12. It is clear from the Table that under the assumptions made, the levelized electricity costs of the nuclear options are less than other alternatives with the exception of the com-bined cycle which is in the same range as the most expensive nuclear option. The levelized water cost of desalted water by LT-MED or RO are consis-tently lower for nuclear options than fossil ones. These results are consistent with international experience and are expected to be confirmed when offers are received in response to a formal invita-tion to bid.
M.M. Megahed / Desalination 246
(2009) 238
–256
252
Table 11
Main assumptions and cost input data
Plant type WCR-1000
low cost
WCR-1000 high cost
WCR-650 low cost
WCR-650 high cost
SPP-325 SPP-650 CC-500 ISC-150
Net electrical output, MWe 975 975 650 650 325 650 476 150
Desalination plant capacity, m3/d 144,000 144,000 144,000 144,000 144,000 144,000 144,000 144,000
Reference currency US$
Currency reference year 1 January 2000
Full load operation, h/y 7500 7500 7500 7500 6500 7000 6600 7000
Power plant economic life, y 40 40 40 40 30 35 30 30
Interest/discount rate, % 10
Crude oil price, US$/bbl 24
Average cooling water temp., °C 21
MED design cooling water temp., °C 27
RO design cooling water temp., °C 18
Drinking water standard WHO
253
M.M. Megahed / Desalination 246
(2009) 238
–256
Table 12
Summary of levelized electricity and water costs
Plant type WCR-1000
low cost
WCR-1000 high cost
WCR-650 low cost
WCR-650 high cost
SPP-325 SPP-650 CC-500 ISC-150
Levelized electricity cost, mills/kWh
Capital cost 26 35 31 39 15 13 14 31
O&M cost 7 7 8 8 1 1 2 7
Fuel cost 5 5 5 5 42 42 36 30
Electricity generation cost 38 47 44 52 58 56 52 68
Levelized water cost, US$/m3
LT-MED
Capital cost 0.44 0.44 0.44 0.44 0.49 0.46 0.45 0.48
O&M cost 0.13 0.13 0.13 0.13 0.13 0.13 0.13 0.13
Fuel cost 0.33 0.33 0.32 0.35 0.47 0.43 0.40 0.51
Water production cost 0.90 0.90 0.89 0.92 1.09 1.02 0.98 1.12
Levelized water cost, US$/m3
RO
Capital cost 0.26 0.26 0.26 0.26 0.32 0.32 0.31 0.32
O&M cost 0.17 0.17 0.17 0.17 0.17 0.17 0.17 0.17
Fuel cost 0.16 0.19 0.18 0.20 0.30 0.30 0.25 0.38
M.M. Megahed / Desalination 246 (2009) 238 –256
254
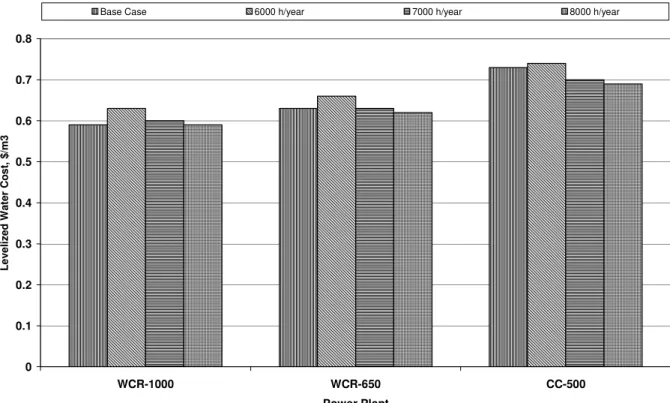
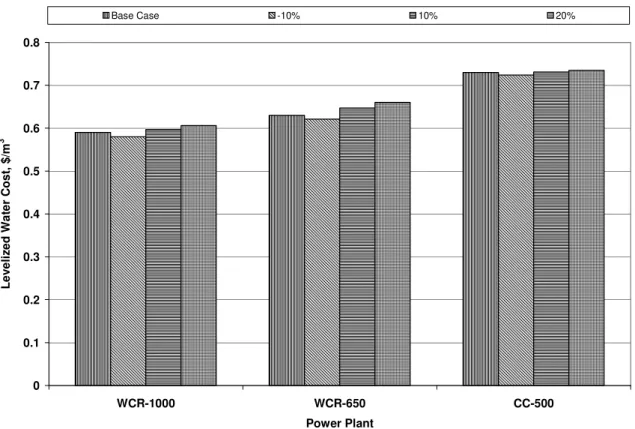
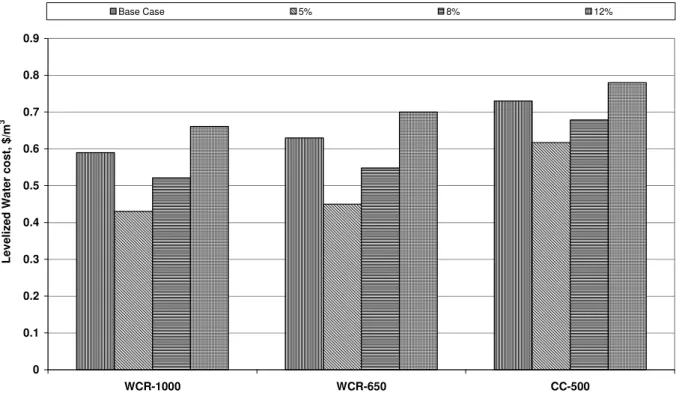
desalination plants, etc. Therefore, a limited sen-sitivity analysis was performed on annual operat-ing hours, plant cost and discount rate for the most economic nuclear and fossil options. Figs. 2–4 show the results of these sensitivity analyses for power plants coupled with RO desalination sys-tems. As shown in the figures, nuclear options remain more economic compared with fossil op-tion. This might be due to the high crude oil price assumed for the economic calculations (24 US$/ bbl). Previous studies indicated that nuclear power is expected to be economically competitive in Egypt under the assumptions adopted in the evalu-ation, for the types and sizes of reactors consid-ered and for oil prices (or equivalent gas prices) above 15 $/lb [13–15].
11. Financial viability
The financial analysis which has been
per-Fig. 2. Variation of RO desalted water cost with full load operation hours. 0
0.1 0.2 0.3 0.4 0.5 0.6 0.7 0.8
WCR-1000 WCR-650 CC-500
Power Plant
Le
ve
li
z
e
d
W
a
te
r C
o
s
t,
$
/m
3
Base Case 6000 h/year 7000 h/year 8000 h/year
formed within the scope of the feasibility study has shown the nuclear power project to be finan-cially viable, under the conditions usually obtain-able for export of nuclear power plants in a com-petitive market characterized by a relatively larger number of interested vendors than potential buy-ers. It has been assumed that about 75% of the total cost of the plant would be financed by na-tional export credit institutes of the supplier coun-try with foreign exchange loans provided under reasonably favorable terms and conditions, the rest to be financed in domestic currency by Egyptian financing institutes in conditions prevailing in the country.
12. Conclusions
Summarizing the main conclusions of the fea-sibility study, it has been found that:
255
M.M. Megahed / Desalination 246 (2009) 238 –256
Fig. 3. Variation of RO desalted water cost with percent changes in capital cost. 0
0.1 0.2 0.3 0.4 0.5 0.6 0.7 0.8
WCR-1000 WCR-650 CC-500
Power Plant
Le
v
e
li
z
e
d Wa
te
r
Cos
t,
$
/m
3
Base Case -10% 10% 20%
the El-Dabaa site, to produce electricity and potable water, is technically feasible, economi-cally convenient and financially viable. 2. The Egyptian grid could accommodate
with-out stability problems the addition of any nuclear (or otherwise) unit in the currently available power range. However, because the largest unit connected to the grid is currently 625 MW (Kuraimat), it is more suitable to have the first nuclear unit in the range 600–1000 MW.
3. For assurance of potable water supply under all operating conditions, the plant should con-sist of two identical units, and utilize a unit size of the order of 600 MW(e) appears to be the preferable choice. The installed seawater desalination capacity should be 150,000 m3/d.
4. Launching a nuclear power program with this project will benefit the country. There are
sev-eral major suppliers interested and willing to provide the plant. It is recommended to ini-tiate the preparation of Bid Invitation Specifi-cations.
References
[1] Central Agency for Public Mobilization and Statis-tics, Statistical Yearbook: 1991–1996, Cairo, June 1997.
[2] International Energy Agency, Energy Statistics and Balances of Non-OECD Countries 1971–1987, OECD, Paris, 1989.
[3] International Energy Agency, Energy Statistics and Balances of Non-OECD Countries 1992–1993, OECD, Paris, 1995.
[4] Organization for Energy Conservation and Planning, Energy in Egypt Report, Cairo, several issues 1993/ 94–2001/2002.
M.M. Megahed / Desalination 246 (2009) 238 –256
256
0 0.1 0.2 0.3 0.4 0.5 0.6 0.7 0.8 0.9
WCR-1000 WCR-650 CC-500
Power Plant
L
ev
el
iz
ed
W
a
ter
co
st,
$/
m
3
Base Case 5% 8% 12%
Fig. 4. Variation of RO desalted water cost with discount rate.
2001/2002.
[6] International Atomic Energy Agency, DECADES Tools — Users’ Manual for Version 1.0, Vienna, 1998.
[7] Y.M. Ibrahim, M.M. Megahed and S.S. Motayaser, Strategies and options for electricity generation in Egypt up to 2020, 5th International Conference on Nuclear Option in Countries with Small and Me-dium Electricity Grids Dubrovnik, Croatia, May 16– 20, 2004.
[8] Sofratome, Site selection and evaluation and inte-gration of a nuclear power unit to the grid, Synthe-sis Report of step 1, Sof.106, April 1978.
[9] Report on Study of the Steady and Transient Be-havior of the Egyptian Electrical Grid after Inter-connection the Second 600–900 MWe Nuclear Power Unit, Final Report, Egyptian Electricity Au-thority, Cairo, Egypt, Sept. 1978.
[10] Report on the Integration of Large Thermal Power Plants into The Egyptian Power System – El- Dabaa Power Plant Interconnection With The Grid,
Swedpower Study – Phase IV, Swedpower, Stockholm, December 1984.
[11] International Atomic Energy Agency, Desalination Economic Evaluation Program (DEEP), IAEA Com-puter Manual Series No.14, Vienna, 2000. [12] M. Methnany, Department of Nuclear Power, IAEA
personal communications, 2003.
[13] International Atomic Energy Agency, Technical and Economic Evaluation of Potable Water Production through Desalination of Seawater by using Nuclear Energy and other Means, IAEA-Tecdoc-666, Vienna, 1992.
[14] International Atomic Energy Agency, Potential for Nuclear Desalination as a Source of Law Cost Po-table Water in North Africa, IAEA-Tecdoc-917, Vienna, 1996.