Diana Filipa Carmo Guimarães
M. Sc. in Physics Engineering
Measurement of lead concentration in
biological tissues by atomic
spectroscopy techniques
Dissertation for the degree of Doctor of Philosophy in Physics
Supervisor: José Paulo Moreira dos Santos, Professor,
FCT/UNL
Co-supervisor: Maria Luísa Carvalho Leonardo,
Professor, FCUL/UL
Evaluation committee:
Chair: Professor Pedro Manuel Corrêa Calvente Barahona Examiner (s): Professor Luís Manuel Cerqueira Lopes Alves
Professor Mário Emanuel Campos de Sousa Diniz
Other Members: Professor Maria Isabel de Sousa Rocha
Professor Joaquim Marques Ferreira dos Santos
Diana Filipa Carmo Guimarães
Measurement of lead concentration in
biological tissues by atomic
spectroscopy techniques
Dissertation for the degree of Doctor of Philosophy in Physics
i Faculdade de Ciências e Tecnologia and Universidade Nova de Lisboa have the perpetual right and
with no geographic limitation, to archive and publish this dissertation using printed or digital
copies, or by other known, or yet to be invented, method, and to divulge it through scientific
repositories, and to admit its copy and distribution to educational or research proposes, not
commercial, if the merit is attributed and recognized to the author and editor.
Measurement of lead concentration in biological tissues by atomic spectroscopy techniques
© Copyright - all rights reserved to Diana Guimarães and FCT-UNL.
The above copyright notice applies only to Chapters I, II, III, IV and V (except 5.4). The remaining
chapters are reproduced with permission from the original editors and subject to their own
ii
iii
Acknowledgments
Finally! After four years of continuous battle this war has come into an end. Long and difficult has
been the pathway to achieve this final result but in the end what does not kill you makes you
stronger. However, this journey was not made alone and this dissertation would not have been
possible without the help, support and collaboration of the following persons and institutions.
My supervisor, Professor José Paulo Santos, who I thank for his advice, guidance, patience and
extreme rigour from the preliminary to the concluding level, as well for allowing me the room to
work in my own way and to grow as a student, a researcher and a scientist want to be.
I also offer my sincerest gratitude to my co-supervisor, Professor Maria Luisa Carvalho, whose
support, advices, encouragement, friendship and unsurpassed knowledge of X-ray Fluorescence,
had a crucial role during all the work.
I gratefully acknowledge Instituto de Medicina Molecular, namely Professor Isabel Rocha and M.
Sc. Vera Geraldes, who have provided all the samples covered in this dissertation, and were always
available to explain in detail the sampling procedures.
To the Institute for Analytical Sciences in Dortmund, namely Doctor Alex Von Bohlen and Maria
Becker a deepest thank you for giving me the opportunity to work with Total Reflection X-ray
Fluorescence. The impressive skills of Maria will not be forgotten as well as the interesting
conversations with Alex, who made us deep in the world of Photoshop while discussing physics
and eating delicious "kuchen".
I would also like to record my gratitude to Professor Luís Cerqueira, from Instituto Tecnológico
Nuclear (ITN), who gave a useful guidance in the use of the Proton Induced X-ray emission
spectrometer, always promoting a stimulating and welcoming environment.
To Professor José Capelo-Martinez, Chemistry Department (University of Vigo) an indebted thank
you by his valuable advices in science discussion and supervision in atomic absorption
spectrometry and ultrasonic solid-liquid extraction.
A big thank you to Professor Mário Diniz, Chemistry Department (FCT/UNL), who introduced me
to the world of metallothioneins, histology and histochemical analysis. Thank you for smoothing
the path into biology, for your precious help, encouragement and kind supervision.
I will not forget the help and technical support of Carla Rodrigues and Nuno Costa, from
REQUIMTE, since my first day working with the graphite furnace and strongly encouraging me
until the last. With you I learnt that analytical spectrometers have strong personalities and you have
iv I also would like to make a special reference to Professor Isabel Natário, from the Mathemathics
Department (FCT/UNL), for her clarifications about non-parametrical statistics.
I would like to acknowledge the academic and technical support of the Faculdade de Ciências e
Tecnologia - Universidade Nova de Lisboa, namely the Physics Department for their assistance
since the start of my Graduation in 2001, especially the head of Department Professor Adelaide de
Jesus. I convey special acknowledgement to the technical assistants Mrs. Maria Helena Rodrigues,
Mrs Fátima Vicente, Mrs Luiza Oliveira, Mrs Paula Correia and Mrs. Hortense Silva for their
tenderness, optimism, and indispensable help dealing with administration and bureaucratic matters.
I also express my appreciation to the financial support of the Fundação para a Ciência e Tecnologia
(FCT) for the PhD Grant (SFRH/BD/38788/2007) and for the Project No.
PEstOE/FIS/UI0303/2011, financed by the European Community Fund FEDER through the
COMPETE – Competitiveness Factors Operational Programme.
I am heartily thankful to Professor Lourdes Costa, who has always been the person I appealed in
the most difficult times. Thank you for hearing me, for being always available despite your busy
schedule, for your kindness, friendship, advices and for being a lovely Human being.
To Doctor Cláudia Quaresma, a big thank you, for the enriching discussions about statistics and
also for your support and friendly smile, full of hope and cheer, every time you saw us straggling
with our research work.
To my dear friends and PhD colleagues, M.Sc. Rui Pinto, M. Sc. Mauro Guerra, Doctor Pedro
Amaro, M.Sc. Diogo Almeida and Doctor Rodrigo Antunes, a sincere thank you! Thank you for
giving me my sanity back discussing about Physics (which sometimes seemed to be nothing more
than a distant dream) for creating such a great friendship at the office, at the table-tennis, and many
places in between. Thank you for your help during all these years, for cheering me up during my
stressful stages (almost all of them), and making part of my life. An even more special thanks to
M.Sc. Rui Pinto and M.Sc. Mauro Guerra. Guys, without our laughs, our trips, our pints and our
friendship this journey would have been way more difficult.
Talking about friendship, trips and pints, I cannot forget to thank Doctor Grant Jobbra Copeland,
my Scottish mate, who followed up close this journey helping me many times with the english
translation of some reports. I hope next time you see me talking in an conference, the lights don't
go out and the fire protections are not activated!
I would also like to thank my colleagues and friends, Doctor Marta Manso, M.Sc. Sofia Pessanha,
M. Sc. Ana Guilherme, Doctor Tânia Magalhães, Doctor Pedro Custódio, Doctor Jorge Sampaio,
v dissertations, which helped me to increase my knowledge on X-ray Fluorescence. A special thanks
to Doctor Marta Manso, M. Sc. Sofia Pessanha and M.Sc. Ana Guilherme, who often had to bear
the brunt of my frustration against spectrometers that insisted not to work and for the amazing,
professional and friendly working environment. You have been invaluable on both academic and
personal level, for which I am extremely grateful. Although it has been a great road trip, I still hate
Eyjafallajokull.
To my colleagues and chemists friends Doctor Gonçalo Vale, Doctor Ricardo Carreira and Doctor
Marco Galésio a huge thank you. The stimulating science discussions, the dry humor about
scientist's life, the growing friendship…all the time spent together was refreshing, cheering and
provided me a pleasant time during my work at the Chemistry Department. A special thanks to
Doctor Gonçalo Vale, it was a pleasure to work with you, you are really an atomic absorption geek!
Above all, I would like to thank my family. My dear parents, Pedro Guimarães and Cecília
Guimarães, for their unflinching encouragement, support, and for their gently and caring love,
without which I would not be the person I am today. Thank you for your patience and for always
believing in me. This work is dedicated to you! My dear grandparents, Armando Guimarães and
Maria Tomásia Guimarães, for their indissoluble support and prayers, love and tenderness. Also to
my uncles, Victor Guimarães and Fernando Carmo, and aunts, Maria José da Silva and Fernanda
Pimentel, and to my beloved sister, Sara de Oliveira, a big thank you for being an inspiration in my
life and making me stronger each day. To my other half, Bruno Dias Guedes, a thank you for
showing me that there are far much more important things in life. Your confidence in me, patience,
friendship and love have taken the load off my shoulder. It is a pleasure to share my future with
you.
To all my friends, and they know who they are, a big thank you for all the relaxing times, fun and
support, as well as my apology that I could not mention personally one by one. However a special
mention has to be made to Diana Eugénio and Maria Pereira. Diana, thank you from the heart for
your dedication, constant support and care. You make me a stronger person and your friendship is
irreplaceable. Maria, you are simply the best! Thank you for making me laugh constantly and for
being such a good friend. An exceptional thanks as well, to that special Friend that is always with
vi
Abstract
Lead is a toxic element that has no biological role. To increase the knowledge of the mean lead
concentrations accumulated and excreted by the organism, a study was developed to measure lead
concentrations, using different atomic spectrometry techniques, in several tissues and excretions of
Wistar rats. These rats were divided in two groups: one exposed to lead since foetal period, by lead
acetate in drinking water, and a control group, not exposed to lead. By collecting samples of rats
with different ages it was also studied the influence of age in lead concentrations. The studied
organs and excretions were: iliac bone, tibia-fibula, femur, skull, liver, kidney, urine and faeces.
When conducting a study like this, the analytical techniques used the knowhow and the ability to
understand the physical processes occurring are also of major relevance. In this work it was used
the Energy Dispersive X-ray Fluorescence (EDXRF) technique to analyze the solid samples and
the Electro Thermal Atomic Absorption Spectrometry (ETAAS) technique to analyze the urine. To
carry on with the urine analysis it was developed an Ultrasound Solid-Liquid Extraction (USLE)
procedure. This procedure was also applied to analyse brain samples. The Total Reflection X-ray
Fluorescence (TXRF) technique was also used to study urine samples and to assess some of the
results obtained with ETAAS.
In this work, several correlations between the different tissues were found. A possible evidence of
pre-natal exposure was verified because the samples belonging to rats with 1 month old presented
much higher mean lead concentrations than the concentrations, measured in works of other authors,
of rats exposed to lead but not from foetal period. Furthermore, this study seems to corroborate that
lead ingestion decreases with age, once it was measured a decrease of lead excretion by faeces with
age. It was observed that lead concentration in tissues depends on the type of tissue. Mean lead
concentrations measured were higher in bones (iliac, femur, tibia-fibula>skull) - hundreds of ppm,
then in kidney - dozens of ppm and finally in liver on the order of ppm. The urine samples had the
lowest mean lead concentrations on the order of hundreds/thousands of ppb, and faeces the highest
mean lead concentrations, with values of dozens of thousands of ppm. One of the main
contributions of this work was to show that lead accumulation and excretion decreases with age by
plateaus in all tissues except in the kidneys.
vii
Resumo
O chumbo é um elemento tóxico sem função biológica no organismo. Para melhorar o
conhecimento relativamente às concentrações acumuladas e excretadas pelo organismo, foi
elaborado um estudo para medir a concentração de chumbo, utilizando diferentes técnicas de
espectrometria atómica, em vários tecidos e excreções de ratos Wistar. Estes ratos foram divididos
em dois grupos: um exposto ao chumbo desde o período fetal, através de acetato de chumbo
dissolvido na água que ingeriam, e um grupo controlo, não exposto ao chumbo. A recolha de
amostras de ratos com idades diferentes permitiu também estudar a influência da idade na
concentração de chumbo. As concentrações de chumbo foram medidas e quantificadas nos ossos
ilíacos, tíbia-perónio, fémur, crânio, fígado, rim, urina e fezes.
Quando se conduz um estudo com esta dimensão é necessário ter em conta as técnicas de análise
utilizadas, o know-how e a capacidade de compreender os processos físicos que ocorrem. Neste
trabalho utilizou-se a técnica de Fluorescência de Raios-x Dispersiva em Energia (EDXRF) para
analisar as amostras sólidas e a técnica de Espectrometria de Absorção Atómica Electrotérmica
(ETAAS) para analisar a urina. Para se efectuar a medição das amostras de urina foi necessário
desenvolver um procedimento de Extracção Assistida por Ultra-Sons (USLE). Este procedimento
foi também usado na análise de amostras de cérebro. A técnica de Fluorescência de Raios-x por
Reflexão Total (TXRF) foi também utilizada para medir amostras de urina e verificar alguns dos
resultados obtidos por ETAAS.
Neste trabalho, constatou-se a existência de várias correlações entre os diferentes tecidos. Foi
também observada uma possível evidência da exposição materna durante a gravidez, uma vez que
as amostras pertencentes a ratos com 1 mês de idade apresentaram concentrações médias de
chumbo muito maiores que as concentrações encontradas em trabalhos de outros autores feitos em
ratos expostos ao chumbo, mas não desde período fetal. Verificou-se uma diminuição, ao longo da
idade, da concentração de chumbo excretada nas fezes o que poderá corroborar o facto de que a
quantidade de chumbo ingerida diminui com a idade. Constatou-se que a concentração de chumbo
nos tecidos depende do tipo de tecido. As concentrações médias de chumbo medidas foram mais
altas nos ossos (ilíaco, fémur, tíbia-perónio > crânio) - centenas de ppm; seguindo-se o rim -
dezenas de ppm; e, finalmente, o fígado na ordem dos ppm. A urina apresentou a menor
concentração de chumbo medida, na ordem das centenas/milhares de ppb, e as fezes a mais alta,
com valores nas dezenas de milhares de ppm. Uma das principais contribuições deste trabalho foi
mostrar que, ao longo do tempo, existe um a diminuição na acumulação e excreção de chumbo que
é feita por patamares em todos os tecidos, excepto nos rins.
Palavras-chave: EDXRF, ETAAS, TXRF, USLE, chumbo, amostras biológicas, dependência com
viii
Table of contents
Acknowledgments ... iii
Abstract ... vi
Resumo ... vii
Table of contents ... viii
List of Figures ... xi
List of Tables ... xiii
Acronyms and abbreviations ... xv
Symbols ... xvii
CHAPTER I - INTRODUCTION ... 1
1.1. General study: outline and goals ... 2
CHAPTER II - LEAD ... 5
2.1. Lead in the Environment: A worldwide problem ... 6
2.2. Lead intake and distribution ... 7
2.3. Lead toxicity and intoxication ... 9
2.3.1. Lead in faeces ... 10
2.3.2. Lead in urine ... 11
2.3.3. Lead in kidneys and liver ... 11
2.3.4. Lead in bones ... 12
2.4. Current spectroscopic techniques for the analysis of lead in biological samples... 12
CHAPTER III - X-RAY SPECTROMETRY ... 16
3.1. X-ray production ... 17
3.2. X-ray interaction with matter ... 18
3.2.1. Reflection and Refraction ... 20
3.3. X-ray Spectrometry Techniques ... 23
3.3.1. X-ray Fluorescence ... 23
3.3.1.1. Energy Dispersive X-ray Fluorescence ... 23
3.3.1.1.1. The X-ray Tube ... 24
3.3.1.1.2. The secondary target method and tri-axial geometry ... 25
3.3.1.1.3. The detection system ... 28
3.3.1.1.4. Data Analysis: X-ray spectra ... 30
3.3.1.1.5. Quantitative Calculations ... 31
3.3.1.1.6. Analytical Figures of Merit ... 34
3.3.1.2. Total Reflection X-ray Fluorescence ... 35
3.3.1.2.1. Quantification ... 37
ix
CHAPTER IV - ATOMIC ABSORPTION SPECTROMETRY ... 40
4.1. Principles of Atomic Absorption ... 41
4.2. Linewidth ... 42
4.3. Atomic absorption spectroscopy instrumentation ... 44
4.3.1. Radiation sources ... 44
4.3.2. Atomizer ... 45
4.3.3. Selection System ... 48
4.3.4. Detection System ... 49
4.3.5. Interferences ... 49
4.3.5.1. Background correction by Zeeman effect ... 52
4.3.6. Graphite Furnace Atomic Absorption Spectrometry (GFAAS) ... 53
4.3.6.1. Matrix modifiers ... 54
4.3.6.2. Thermal Program ... 55
4.3.6.3. Data Analysis: output signal ... 56
4.3.6.4. Quantification ... 57
4.3.6.5. Analytical figures of merit ... 57
4.3.6.6. Sample Preparation ... 58
4.3.6.6.1. Ultrasonic solid-liquid extraction ... 58
CHAPTER V - EXPERIMENTAL PROCEDURE ... 61
5.1. Animals and Experimental design ... 62
5.2. Sample preparation ... 64
5.2.1. Sample treatment for EDXRF ... 64
5.2.2. Sample treatment for TXRF ... 65
5.2.1. Sample treatment for ETAAS ... 66
5.2.1.1. Formaldehyde ... 67
5.2.1.2. Urine ... 67
5.2.1.3. Brain ... 68
5.3. Spectrometers used ... 69
5.3.1. EDXRF Spectrometer ... 69
5.3.1.1. Dection limits and accuracy ... 71
5.3.2. TXRF Spectrometer ... 72
5.3.2.1. Detection limits and accuracy ... 72
5.3.3. ETAAS Spectrometer ... 73
5.3.3.1. Detection limits and accuracy ... 73
5.4. Validation of the USLE methodology developed for urine and brain samples ... 75
5.4.1. Ash/Atomization curves ... 75
x
5.4.3. Analysis of lead in brain rats tissue ... 78
5.4.4. Analytical results and conclusions ... 79
5.5. Statistical Analysis ... 80
CHAPTER VI - RESULTS AND CONCLUSIONS ... 82
6.1. Results and discussion ... 83
6.1.1 Urine and faeces ... 83
6.1.1.1. Urine lead analysis ... 83
6.1.1.2. Faeces lead analysis ... 85
6.1.1.3. Correlation between lead concentration in urine and faeces ... 86
6.1.2. Liver and kidneys ... 88
6.1.2.1. Liver lead analysis ... 88
6.1.2.2. Kidney lead analysis ... 90
6.1.2.3. Correlation between lead concentration in kidney and liver ... 91
6.1.3. Bones: iliac, femur, tibia-fibula and skull ... 93
6.1.3.1. Bones lead analysis ... 93
6.1.3.2. Correlations between lead concentration in bones ... 97
6.1.4. Correlations between all excretions and organs ... 98
6.1.5. Formaldehyde lead measurements ... 99
6.2. Conclusions ... 101
ANNEX ... 105
Annex 1 – Quantum numbers ... 106
Annex 2 – X-ray spectra nomenclature ... 107
Annex 3 – Histological examination and histochemical analysis of lead in NTS and HDA ...108
Annex 4 – Mean lead concentrations values measured in the several organs and excretions ... 111
Annex 5 - PIXE measurements ... 116
xi
List of Figures
Figure 1: Soil contamination by lead in 2005...7
Figure 2: Deceleration of high energy particle illustration with emission of a photon (green)……17
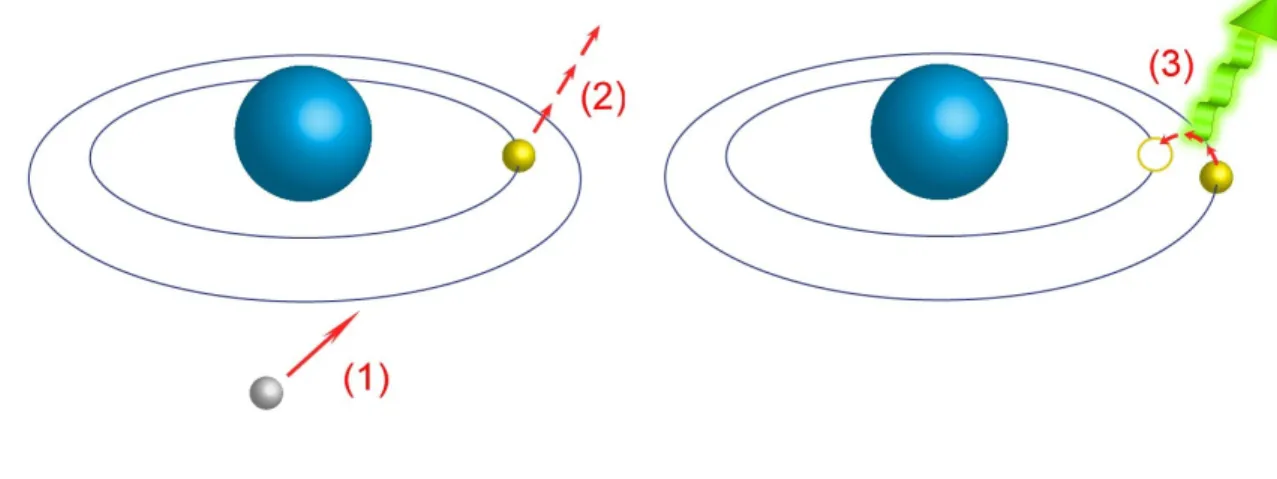
Figure 3: Characteristic X-ray emission illustration. 1) incident electron; 2) inner shell electron injection; 3) outer to inner shell electron transition with characteristic X-ray emission (green)...18
Figure 4: Variation of Pb mass attenuation cross section for several effects with the energy of the incident photon .. ... 20
Figure 5: Reflection and refraction of an incident beam. ... 21
Figure 6: Mo anode X-ray tube spectrum as a function of the applied voltage at a constant filament temperature (adapted). ... 25
Figure 7: EDXRF with triaxial geometry, elimination of the Bremsstrahlung radiation from the X-ray tube due to the 90º arrangement. ... 27
Figure 8: EDXRF spectrum measured in primary mode; in secondary mode with no triaxial geometry and a Y secondary target, and with triaxial geometry and boron carbide as secondary target ... 28
Figure 9: Spectrum from a liver sample of a Pb contaminated Wistar rat obtained by a tri-axial EDXRF spectrometer with a Mo secondary target (Centro de Física Atómica FCUL/UL). ... 31
Figure 10: TXRF schematics (by kind permission of Institute for Analytical Sciences, ISAS, Dortmund). ... 36
Figure 11: Illustration of the definition of linewidth. ... 42
Figure 12: Schematic design of a graphite tube furnace ... 47
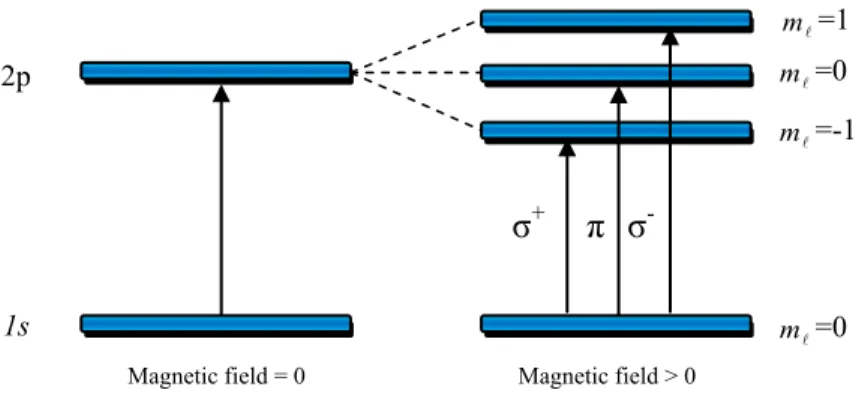
Figure 13: The effect of a strong magnetic field on atomic transitions. ... 52
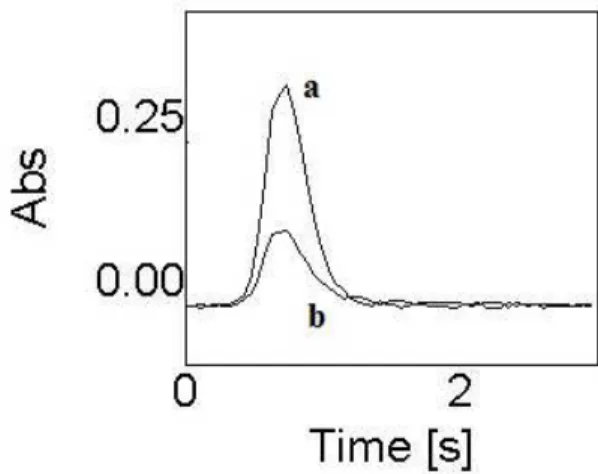
Figure 14: Pb Absorption profiles for aqueous calibration standard (18 µg L-1 Pb). a) atomic absorbance profile; b) background absorbance profile. ... 56
Figure 15: Comprehensive scheme of an ultrasonic probe (adapted with kind permission of J.L. Capelo) ... 59
Figure 16: Bone pellet placed on the sample holder before EDXRF measurement. ... 65
Figure 17: Quartz carriers with urine samples being dried before TXRF analysis. ... 66
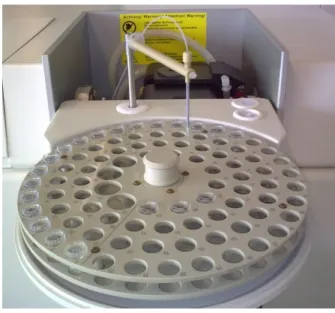
Figure 18: Autosampler detail. ... 67
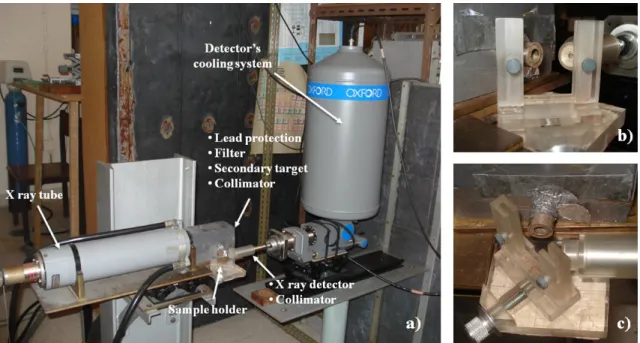
Figure 19 a) EDXRF spectrometer; b) sample holder seen from the front; c) sample holder seen from above ... 69
xii Figure 21: Pb Absorption profiles for: (A) Aqueous calibration Standard (18 µg L-1 Pb); (B) formaldehyde containing NTS control brain sample (24 µg L-1, Pb was spiked); (C) HDA exposed rat brain sample after USLE (5.4 µg L-1 Pb); (D) Urine of exposed rat after USLE (6.7 µg L-1 Pb;).. ... 76 Figure 22: Comparison of Pb concentration obtained in urine for exposed and non-exposed rats. All
samples were measured by ETAAS except for 7.5; 9 and 10 months which were
measured by TXRF ... 84
Figure 23: Comparison of Pb concentration obtained by EDXRF in rat faeces from exposed and
non-exposed group. ... 86
Figure 24: Fecal/urinary lead concentration ratio values as function of age of rats from 10 different
collections (n= 20). ... 87
Figure 25: Comparison of Pb concentration obtained by EDXRF in rat livers from exposed and
non-exposed group. In the control rats * corresponds to BDL < 2 µg g-1. ... 89 Figure 26: Comparison of Pb concentration obtained by EDXRF in rat kidneys from exposed and
non-exposed group. In the control rats * corresponds to BDL < 2 µg g-1. ... 91 Figure 27: Relationship between median kidney and liver lead concentrations for contaminated rats over time ( ; n=3). ... 92
Figure 28: Kidney/liver lead concentration ratio values as function of age of exposed rats from 10 different collections ( ; n=3). ... 92
Figure 29: Comparison of Pb concentration obtained by EDXRF in rat iliac bones from exposed
and non-exposed group. ... 94
Figure 30: Comparison of Pb concentration obtained by EDXRF in rat femurs from exposed and
non-exposed group. ... 95
Figure 31: Comparison of Pb concentration obtained by EDXRF in rat tibia and fibulas from
exposed and non-exposed group. ... 95
Figure 32: Comparison of Pb concentration obtained by EDXRF in rat tibia and fibulas from
exposed and non-exposed group. ... 95
Figure 33: Distribution of mean lead concentrations (µg g-1) over age on iliac bone, femur, tibia-fibula and skull. ... 97
Figure 34: Histochemical detection of Pb granules in Wistar rat brain tissues. Legend: A – HDA
from exposed group; B – HDA Control; C - NTS from exposed group; D - NTS
Control………..109
Figure 35: Wistar rat brain tissues stained by Hematoxilin and eosin. A – HDA exposed group; B –
xiii
List of Tables
Table 1: Comparison of the lead concentration (µg g-1) in the standard reference materials obtained in this work with the respective certified values . ... 72
Table 2: Heating program for determination of Pb in urine. ... 73
Table 3: Limits of detection and limits of quantification for the different sample treatment methods
assessed. ... 75
Table 4: Lead concentration found in the liquid fraction of the urine of rats before and after
treatment with ultrasonic energy ( ±SD, n=3, µg L-1).. ... 77 Table 5: Lead content in the formaldehyde and in the total mass of brains in each vessel containing
formaldehyde, for exposed and non-exposed rats ( ±SD, n=3, µg). ... 78
Table 6: Concentration of lead found in urine ( ±SD, mg L-1; n=3) and brain ( ±SD, µg g-1; n=3) samples treated with the USLE protocol. Formaldehyde ( ±SD, µg L-1; n=3) was measured directly by ETAAS. ... 79
Table 7: Comparison of Pb concentration values for urine samples measured by TXRF and ETAAS
techniques. ... 83
Table 8: Spearman correlation matrix for the average Pb concentrations in urine and faeces for the
10 collections. The correlations are significant at p<0.03 if marked with a, and significant at p<0.001 if marked with b. ... 87 Table 9: Spearman correlation matrix for the average lead concentrations in kidney and faeces for
the 10 collections. ap=0.001; bp> 0.800. ... 93 Table 10: Mean lead concentration of the plateaus of accumulation for the several bones. Kruskal
Wallis test p-values between the collections that form each plateau of lead accumulation
for the four types of bone. * values are in µg g-1. ... 96 Table 11: Spearman correlation matrix for the mean lead concentrations in bones for the 10
collections. The correlations are significant at p<0.01 if marked with ª. ... 98
Table 12: Spearman rs correlation values for the average lead concentrations in all the organs and excretions studied, and the corresponding p-values. ... 99
Table 13: Concentration values of lead in soft tissues, bones and in the formaldehyde used to
preserve the samples, measured by EDXRF and ETAAS, respectively. ... 100
Table 14: Different temporal range of the plateaus of accumulation of lead concentration in the
several organs measured. ... 103
Table 15: Quantum numbers description ... 106
Table 16 - Some of the transitions of series and . ... 107
Table 17: Concentration of lead (µg L-1) in the urine of Wistar rats. All samples were measured by ETAAS except for 7.5; 9 and 10 months which were measured by TXRF. ... 111
xiv Table 19: Concentration of lead (µg g-1) in the liver of Wistar rats measured by EDXRF... ... 113 Table 20: Concentration of lead (µg g-1) in the kidney of Wistar rats measured by EDXRF. ... 114 Table 21: Lead concentration (µg g-1, dry weight) in the bones of Wistar rats measured by EDXRF . ... 115
Table 22: Comparative study of faeces, kidney and liver samples measured using the PIXE and
xv
Acronyms and abbreviations
AAS - Atomic Absorption Spectrometry
ATSDR -Agency for Toxic Substances and Disease Registry
AXIL - Analysis of X-ray Spectra by Iterative Least Squares
BCR - Community Bureau of Reference
BDH - British Drug Houses
BDL - Below Detection Limit
BQL - Below Quantification Limit
c.f. - confer (consult)
CV -Coefficient of Variation
CVAAS - Cold Vapour Atomic Absorption Spectrometry
DATTPIXE - Data Analysis Thick Target Proton Induced X-ray Emission
DFC - Digital Film Camera
DL - Detection Limit
DPX - Distyrene Plasticizer Xylene
e.g. - exempli gratia (for example)
EDL - Electrodeless Discharge Lamps
EDXRF - Energy Dispersive X-ray Fluorescence
EPA - Environmental Protection Agency
et al. - et alii (and others)
ETAAS - Electrothermal Atomic Absorption Spectrometry
FAAS - Flame Atomic Absorption Spectrometry
FCT/UNL - Faculdade de Ciências e Tecnologia/Universidade Nova de Lisboa
FCUL/UL - Faculdade de Ciências/Universidade de Lisboa
FWHM - Full Width at Half Maximum
GFAAS - Graphite Furnace Atomic Absorption Spectrometry
HCL - Hollow Cathode Lamp
HDA - Hypothalamic Defense Area
HGAAS - Hydride Generation Atomic Absorption Spectrometry
HPGe - High Purity Germanium
ICP-AES - Inductively Coupled Plasma Atomic Emission Spectrometry
ICP-MS - Inductively Coupled Plasma Mass Spectrometry
ICP-OES - Inductively Coupled Plasma Optical Emission Spectrometry (same as ICP-AES)
IQ - Intelligence Quotient
ISAS - Institute for Analytical Sciences
xvi LOD - Limit of Detection
LOQ - Limit of Quantification
m/m - mass (of solute) per mass (of solvent)
m/v - mass (of solute) per volume (of solvent)
MWD - Microwave Digestion
NBS - National Bureau of Standards
NTS - Nucleus Tractus Solitarius (or Nucleus of the Solitary Tract)
PIXE - Proton Induced X-ray Emission
ppb - parts per bilion
ppm - parts per milion
PTFE- Polytetrafluoroethylen
ROI - Region of Interest
RSD - Relative standard deviation
SD - Standard deviation
SDD - Silicon Drift Detector
SRXRF - Synchrotron Radiation X-ray Fluorescence
TXRF - Total Reflection X-ray Fluorescence
USLE - Ultrasound Solid-Liquid Extraction
v/v - volume (of solute) per volume (of solvent)
w/v - weight (of solute) per volume (of solvent)
w/w - weight (of solute) per weight (of solvent)
WHO - World Health Organization
XRF - X-ray Fluorescence Spectrometry
xvii
Symbols
K - A series of orbitals with the principal quantum number equal to 1
L - A series of orbitals with the principal quantum number equal to 2
- refractive index of the medium i
- velocity of the radiation in the medium i
- velocity of the radiation in vacuum
- incidence angle
- reflection angle
- refraction angle
- imaginary component of the refracting index for X-ray radiation
- decrement of the refracting index for X-ray radiation
- Avogadro's number
- classical electron radius
- density
- atomic number
- mass number
- wavelength
- linear absorption coefficient
- critical incidence angle
- glancing angle
E - energy of incident beam
- intensity of characteristic lines from the X-ray tube
- critical voltage
V - applied X-ray tube voltage
- current through the X-ray tube
- constant that depends on the emission characteristic X-ray radiation
- short wavelength limit for the X-ray tube continuous radiation
- total intensity of the continuum X-ray spectrum
k - constant that includes the current of the X-ray tube
- Chi square function
- the more intense lines of K series
- the second more intense lines of K series
- the more intense lines of L series
- the second more intense lines of L series
xviii 0
I
- intensity of incident beami
K
- calibration factori
c
- concentration of the element im - sample thickness
i
C
- self attenuation factor- factor that encloses the attenuation of incoming radiation and outgoing characteristic radiation
j mE
1,
- mass attenuation coefficient for element j at the incident X-ray energy
i j mE
,
- mass attenuation coefficient for element j at the characteristic X-ray energy for elementi
- angle for incoming radiation on the sample
- angle for emitted radiation from sample
- ionization cross section of an element i
- fluorescent yield for element i
- transition probability from level n to m, in element i
- absorption of radiation in air and detector window for element i
- detector efficiency for element i
- detector solid angle
NT- total accumulated counts of X-ray photons corresponding to a certain region of interest - standard deviation associated to NT
- standard deviation associated to the element peak counts
- standard deviation associated to the background
NP - counts referring to the element peak
NB - counts referring to the background
- net intensity of the principal peak of the analyte
- absolute sensitivity particular of element
- the relative sensitivity of element
- reference element
- volume of the internal standard
- volume of the sample
- internal standard
- standard deviation associated to the peak counts of a blank sample
- transmittance
I - intensity of attenuated beam
xix - thickness of the sample
- absorptivity
- linewidth
- mean value of the variable X R2 - coefficient of determination
2
1.1. General study: outline and goals
Lead has no physiological function in the organism and represents a problem to the public health
[1]. Its toxicity is mainly due to the affinity for sulfidric groups, inhibiting enzymes activity, and its
ability to replace calcium. Lead intoxication symptoms range from common symptoms, as nausea
and fatigue in the beginning of intoxication, to severe manifestations as peripheral neurophaty,
saturnine colic, dementia and even death.
Lead is a soft, ductile and malleable material with high density and very resistant to corrosion. Due
to these properties it plays a significant role in modern industry, being the most widely used
nonferrous metal [2]. Generally, human exposure to lead comes from the following main sources:
leaded gasoline, lead-based paint; lead pipes in water supply systems; processes such as lead
mining, smelting, and coal combustion. It is also used in ceramic glazes, batteries, and cosmetics
[3, 4].
Even with the recent efforts being made to reduce the lead (Pb) concentrations in the environment,
intoxication by this poisonous element is still a current problem. Several
recommendations/regulations have been developed by agencies of environmental and public health
protection, such as Environmental Protection Agency (EPA), World Health Organization (WHO)
and Agency for Toxic Substances and Disease Registry (ATSDR). These agencies have established
limit values of mean lead concentration in blood, water, air and soil. The established threshold
concentration of lead for children in blood is 10 µg dL-1 while for exposed workers is 30 µg dL-1. The lead concentration in public air should be no higher than 1.5 μg m-3 averaged over 3 months, while in workroom the limit is 50 μg m-3for an 8-hour workday. Regulations also limit lead in drinking water to 1 000 μg dL-1, although the goal is drinking water free of lead. For residential soils, the value is 400 μg g-1, although only soils with concentrations below 50 μg g-1 are considered not contaminated [5].
The debate on the level from which the concentration of lead ingested starts producing adverse
effects has not reached an agreement. With increasingly sensitive methods, lower and lower doses
effects have been identified, suggesting there is no threshold for lead toxicity [6].
Besides all the studies made there is still a major lack of information concerning the correlation of
lead concentration in the several biological tissues and its effects.
The main goal of this work is to increase the knowledge of lead accumulation and excretion in the
organism, through the analysis of lead concentrations in several tissues and excretions of exposed
rats, developing new sample treatment methodologies whenever needed. Comparing the mean lead
3 excretions and tissues and study the influence of age and pre natal exposure in lead concentrations
are the principal objectives.
The novelty of this study lies in the fact that it is assessed, for the first time, the influence of age in
such large number of organs and excretions on the same group of rats exposed since the foetal
period.
Two groups of Wistar rats were used, one exposed to lead since foetal period (n=30) and other, a
control group (n=20), not exposed to lead. The measurements were made in several tissues and
excretions of rats ageing between 1 and 11 months, with about 1 month interval. To determine
mean lead concentrations of the samples two principal techniques were used Energy Dispersive
X-ray Fluorescence (EDXRF) for liver, kidney, bones (skull, iliac, femur, tibia-fibula) and faeces, and
Electrothermal Atomic Absorption Spectrometry (ETAAS) for the urine samples.
ETAAS was also used in some analysis made in brain, namely two specific brain areas Nucleus
Tractus Solitarius (NTS) and Hypothalamic Defence Area (HDA), responsible for the arterial
pressure control. This last study was made without considering the age of the rats and mainly to
develop a method to extract lead from brain tissues using ultrasonic solid-liquid extraction.
The liquid urine samples were analyzed by ETAAS and Total Reflection X-ray Fluorescence
(TXRF) essentially due to the small volume and amount of lead concentrations present in the
samples.
The TXRF technique provides multi-elemental and non-destructive analysis, and it is of common
use in trace element determinations in environmental and biomedical samples study. Due to the
high reflectivity of the sample holder almost eliminating the spectral background, the detection
limits of this technique are in the order of µg L-1 [7-10].
The most widely used technique to measure lead in urine is the ETAAS, and several analytical
methods have been described for urine analysis using this technique [11-13]. Nevertheless, it was
developed a sample treatment method based in the ultrasonic solid-liquid extraction [14-16], to
assure that the measurement of the lead concentration concerns not only the liquid part, but also the
solid part (precipitation) of the urine. The detection limits of this technique are in the order of 0.1
µg L-1.
The EDXRF is a widespread fully matured instrumental analytical method. This analytical method
plays an important role in biological samples analysis once it provides multi-elemental analysis, for
all the elements with atomic number higher than 13, in a wide range of concentrations [17]. The
EDXRF has the advantages of performing non-destructive analysis independently of the chemical
form of the samples, rapidly at relatively low costs and high precision. To improve the accuracy of
4 This dissertation is divided into six main Chapters: Chapter I consists in some general facts about
lead and an introduction to the work and main goals; Chapter II is dedicated to the history of lead,
its intake and distribution in the organism, toxicity in the main organs and excretions studied in this
work, as well as a review about the
current spectroscopic techniques for lead analysis in
biological samples; Chapter III relies in the fundamental principles of X-ray Spectrometry, giving
especial attention to EDXRF and TXRF; Chapter IV contains the fundamental principles and mainfeatures but of Atomic Absorption Spectrometry (AAS), giving emphasis to ETAAS, more
specifically to graphite furnace devices; Chapter V contains the description of the experimental
procedure and includes the sample collection, sample treatment procedure development,
experimental setups and a small introduction to the statistical tests used, and finally Chapter VI that
6
2.1. Lead in the Environment: A worldwide problem
Lead occurs naturally in the Earth crust, and is usually found combined with other elements to form
lead compounds, for example lead sulphide (PbS) and more rarely lead carbonate (PbCO3) and lead
sulphate (PbSO4) [5]. Due to its valence shell configuration 6s2 6p2, lead can be found in three
oxidation states: Pb0, the metal; Pb2+ that exists primarily in the environment; and Pb4+ that is only formed under extremely oxidizing conditions [19].
This heavy metal was widely used by mankind for 6000 years. The history of lead poisoning is
nearly 2500 years old with the earliest written accounts of lead toxicity found in Egyptian papyrus
[20]. It was also commonly used by the Romans and Greeks for glazing pottery, kitchenware, lead
seals attached to messages and merchandise and for plumbing [19]. During the Middle Ages lead
was commonly used for medicinal purposes and alcoholic beverages, in which large amounts of
lead were added intentionally to sweeten the wine and ciders [19, 21]. The use of lead continued to
spread over the centuries and only in the 15th century appeared the first prohibition laws, with the Spanish and the French governments prohibiting the use of lead in wine, despite it continued being
used with other purposes as paint pigments and moveable type for the printing press. This heavy
element continued being used through the centuries and it is appointed as the main cause of death
of several famous painters, as for example the Spanish painter Francisco Goya (18th-19th centuries) and the Dutch painter Van Gogh (19th century), who used lead pigments on their paintings [22, 23]. With the industrial revolution the amount of industrial waste increased, in particular waste products
with high concentrations of heavy metals from mining and sewage sludge. These waste water
sludges are still commonly used in agriculture as fertilizers that contaminate the soils and increase
the exposure to lead in the environment (c.f. Figure 1).
In the last decades, a lot of efforts have been done in order to reduce the high lead levels that
humans are exposed to. Safety procedures as the withdrawal of lead in gasoline, the removing of
lead solder in food-containing, the prohibition of household paints with high lead concentrations,
the control in the process of producing and recycling batteries, the improvements in vigilance
guidelines to detect lead in toys, in plastics and in cosmetics, as well as the severe legislation in the
use of hazard substances to produce electrical and electronic equipment, have been implemented in
7 Figure 1: Soil contamination by lead in 2005 25].
However, lead blood levels are usually greater than 10 µg dL-1 in children younger than 2 years of age that live in urban areas of developing countries [26]. In China a review of 17 studies from
different industrial and heavy traffic areas of the country found that between 65% and 99.5% of
children had blood lead levels above 10 µg dL-1. Even outside of those high-risk areas, about 50% of China’s children had high blood lead levels [27]. In Nigeria, despite the lower levels of industrialization and car usage, it is estimated that 15% to 30% of the children living in urban areas
have blood lead levels greater than 10 µg dL-1 [28].
Despite the efforts to reduce lead exposure, the human being is still exposed to lead levels 100- to
1000-fold higher than pre-industrial humans [29]. Saturnism, intoxication by lead, is still one of the
most significant occupational and environmental health problems.
2.2. Lead intake and distribution
The absorption of lead into the body has three main intake routes: through the skin, by inhalation
and by ingestion. The intake of lead by dermal exposure is a much less efficient route than
inhalation and ingestion. In exposure through the skin several layers of cells have to be crossed to
reach the capillary vessels where the absorption of lead occurs. Consequently, this process is much
more effective for liposoluble substances, such as organic lead compounds (tetraethyl lead and
8 In air, metals may occur as aerosols and, in some instances, as vapour. The amount of lead inhaled
depends on the number of breaths per minute, the volume breathed per day (an increase in
workload will determine a greater absorption of lead) and age-related factors that determine
breathing patterns (e.g., nose breathing vs. mouth breathing and air-stream velocity within the
respiratory tract) [31]. After inhalation, the metal will be deposited on the walls of the airways. The
amount deposited will depend on the particle size and solubility. Lead in submicron size particles
can be almost completely absorbed through the respiratory tract, whereas larger particles may be
swallowed [32]. In general, particles larger than 2 µm are trapped in the mucus of the respiratory
system and are removed to the mouth, or through the glottis into the stomach. Smaller particles,
less than 1 μm, are deposited in the bronchiolar and alveolar regions of the respiratory tract and
absorbed into the systemic circulation. The very small particles, less than 0.01 μm, can penetrate
deep into the lungs but end up being almost in its entirety, expelled by exhalation [5]. The
absorption via respiratory system is about 10 times more efficient than the absorption in the
gastrointestinal tract, about 50% of the inhaled lead is absorbed by blood in adults [33].
In contrast to the extensive studies in the lung, absorption of metal in the gastrointestinal tract is
less well understood. In general population, the contribution of the gastrointestinal route to the total
lead absorbed is greater than the respiratory one and is the responsible for most of children
intoxications.
Several factors may affect absorption and consequently the fraction of metal that is absorbed, such
as the chemical form of the compounds ingested, the pH of the stomach, the size of the
contaminated particles, the age (children absorbs ~40% and adults ~10%; absorption rate is also
higher in younger animals [34-36]), the meal status (e.g. fed vs. fasted) and the simultaneous
ingestion of nutrients that affect the solubilisation and binding of Pb (Fe and Ca deficiency may
result in higher absorption of lead) [5, 37].
Once lead has been taken into the gastrointestinal tract through food or drinking water, the process
of absorption is initiated in the stomach, where food is digested by enzymatic hydrolysis to produce
small molecules that are easily absorbed. The digested material moves into the duodenum and
small intestine. The materials on the surface of the gastrointestinal tract can be absorbed into the
walls and hence the blood chain [38].
After being absorbed to the blood, lead is distributed to all the organs. Blood contains lead bound
to erythrocytes, as a non-diffusible form, and in plasma as a diffusible form. Over 90% of total
blood lead is bound to erythrocytes cells because of its high affinity and capacity to hold lead.
However, it is the interstitial plasma that contains the biologically available fraction of lead and the
main role on its distribution to the different tissues [19, 24]. The half-time of lead in blood is
approximately 30 days [39]. Once distributed by blood, lead is accumulated in body organs and
9 70% in young children, with a half-life in the order of years to decades [40-44]. Lead competes
with Ca for the formation of the primary crystalline matrix of bone, hydroxyapatite. The fixation of
this heavy metal in bone is seen as a protective mechanism that limits its distribution to more
sensitive tissues [44-46]. However, accumulation is still made in the soft tissues, though in a minor
scale and with lead biological half-times of approximately 3-4 weeks [35, 39]. In general, among
soft tissues, the higher percentage of lead is accumulated in kidney followed by liver and other
organs as heart and brain [19]. However, skeleton can't be considered an inert repository for lead.
Gradual release from the bone serves as a persistent source of toxicity even after the end of external
exposure. This mobilization can be increased by several factors like age, sex, nutritional status and
by some special conditions associated with bone turnover, such as pregnancy, lactation,
menopause, osteoporosis, immobilization, and hyperthyroidism and bone fractures [47, 48].
Absorbed lead that is not stored in the tissues is filtered and excreted through the main excretory
routes: kidney to urine (about 76%), and liver to bile and then to faeces (about 16%). Small
amounts are also excreted through other minor routes of excretion, such as sweat, saliva, hair, nails
(about 8%). Lead is also excreted in breast milk. [5, 49, 50].
There are several models of lead toxicokinetics that have been proposed to characterize parameters
as retention of lead in various tissues and relative rates of distribution among the tissue groups.
However, there is no consensus among researchers regarding the use of a certain metabolic model.
The daily exposure limit for lead with no increases in the body lead load corresponds to the
absorption of 600 µg in adults, and 300 µg in children. Below this threshold, there appears to exist
a balance, between absorption and excretion, so that the amount of lead excreted corresponds to the
amount absorbed [38].
2.3. Lead toxicity and intoxication
Lead toxicity is mainly due to three biochemical factors. The first is lead ability to bind to
important molecules, namely the sulfhydryl (-SH) and amide groups, common components of
enzymes, changing their configuration and decreasing their activities. Two of the enzymes in the
heme biosynthetic pathway that are inhibited by lead are the δ-aminolevulinic acid dehydratase
(ALAD) and the mitochondrial enzyme ferrochelatase that catalyzes the incorporation of Fe in the
porphyrin ring. Their inhibition will be reflected in the accumulation of intermediates of the heme
pathway, respectively, aminolevulinic acid (ALA) and erythrocyte zinc protoporphyrin because the
10 may reflect in a decrease in heme synthesis and consequently in hemoglobin [5, 19].
The second factor is lead ability to compete with essential metallic cations for binding sites
inhibiting their action. This behaviour is particularly concerning in the case of Ca due to the
increase of lead affinity to the bone tissue. The third factor is lead capacity to interfere with vitamin
D metabolism, inhibiting the production of the active form of this vitamin [51].
Depending on the exposure period, lead poisoning intoxication can be described as acute (less than
15 days), intermediate (15-364 days) and chronic (more than 365 days) [5].
One of the principal problems concerning lead intoxication is that the early symptoms are common
to other diseases. This increases the difficulty of diagnose without medical testing, what suggests
that subclinical lead toxicity can be more prevalent than is recognized. Differences in the IQ of
children and in their behaviour [52], in hearing thresholds and in height [53, 54], fatigue, sleep
disturbances and headaches, irritability, loss of appetite and nausea are some of the subclinical
symptoms already detected [55]. These symptoms are only considered signs of intoxication if the
blood test analysis, or work conditions, indicate an increased exposure to lead.
After a long exposure time, or exposure to abnormally high lead concentrations, the symptoms
became clinical and may cause severe impairments in hematopoietic, central nervous, reproductive,
gastrointestinal, cardiovascular, renal and hepatic systems [36, 56, 57]. Among the clinical
symptoms there are: acute gastrointestinal colic and abdominal pain known as saturnine colic [58];
peripheral neuropathy - wrist and foot drops [59]; Burton's Line - bluish line in the bottom of the
gum resulting of lead sulphite accumulation [60]; functional and morphological renal changes [61];
fertility problems [62] and lead encephalopathy (delirium, seizures and even lapse into coma) [63].
There are also some studies that indicate appearance of malignant and benign tumours in rats and
mice. However, there is no conclusive evidence of carcinogenic properties of lead in humans
[64-66].
In the following Sections it will be referred the effects of lead poisoning in all the tissues studied in
this work as well as some particularities of lead excretion by faeces and urine.
2.3.1. Lead in faeces
The mechanisms for faecal excretion of absorbed lead are still not clear. However, it is believed
that pathways of excretion may include secretion into the bile and passing directly by blood to
intestine walls [67]. Faeces have normally the highest lead concentrations, corresponding to the
majority of the lead that is not absorbed into the blood. It is known that, in adults more than 90% of
11 waste [5]. The upper limit of lead concentration considered acceptable in humans is about 50 µg g-1 in dry faeces [68].
2.3.2. Lead in urine
The lead excretion in urine is mainly through glomerular filtration [69]. Due to the easy
non-invasive sample collection and to the absence of health risk, urine is one of the most convenient
samples for human biomonitoring [70-72]. However, urine mean lead concentration measurements
do not reflect the body lead burden. This is in part due to the wide variation in renal excretion rates,
the large dilution effects in the bladder and the high nephrotoxic lead exposures that may induce
potential alterations in kidney function on excretion [12, 73]. Thus, the 24 h urinary lead is an
important aspect of monitoring recent exposure lead poisoning. Nevertheless, the urine complex
composition, the variability of the matrix and the tendency for some constituents to precipitate out
of solution also contribute to difficult lead analysis in this sample [12, 74]. The upper limit of
acceptable lead concentration in human urine is 10 µg dL-1 [68].
2.3.3. Lead in kidneys and liver
Among the soft tissues, liver and kidneys are the ones that show substantially higher lead
concentrations [35, 75]. These organs, which play a vital part in the detoxification and metabolism
of toxic substances, are under risk of damage due to the oxidative reaction of lead [76, 77]. The
lipid peroxidation of cellular membranes has a crucial role in the mechanisms of hepato- and
nephrotoxic action of lead, and is a consequence of accumulation of δ-aminolevulinic acid (δ
-ALA), which undergoes a process of inducing free radicals [77, 78]. The accumulation of δ-ALA is
a reflection of the inhibition of the sulfhydryl-containing enzyme δ-aminolevulinate dehydratase (δ-ALAD) caused by the strong affinity of lead to the thiol groups (SH) of aminoacids [76, 79]. The lead intoxication in the kidneys may cause proximal tubular dysfunction or irreversible
nephropathy depending on the exposure regimens. These facts, along with the oxidative stress,
have been implicated as a contributing factor in lead-associated renal injury and dysfunction [76,
77, 80]. Intranuclear inclusion bodies have been observed in kidneys at lead concentrations of 10
µg g-1 [81, 82].
Liver is responsible for the detoxification and biotransformation of toxic substances, and
morphological lesions were found in rats exposed sub chronically to low doses of lead, confirming
the hepatoxicity of lead [83].
Despite the lack of information about lead dose-relationships in liver and kidneys, concentrations
12
2.3.4. Lead in bones
Due to the continuous remodelling process of bone, this tissue is considered not only as a target of
lead contamination from the environment (referred to as external dose) but also as a source of lead
contamination due to the mobilization of lead stores to soft tissues, resulting in toxic manifestations
(referred to as internal dose). This fact is particularly dangerous during pregnancy because lead
accumulated in bone is transferred to the foetus during the resorption of maternal bone for the
production of the foetal skeleton [85, 86]. Approximately 80% of cord blood lead appears to be
from maternal bone lead stores [87]. Once lead is slowly eliminated from bone, bone lead
concentration may serve as a long-term exposure biomarker, and also a better predictor of some
health effects than blood lead (approximately 30 days half life) [39].
The distribution of lead in bone, however, is not homogeneous and depends on the type of bone:
trabecular (spongy) or cortical (compact). In childhood lead accumulation will occur predominantly
in trabecular bone, and during adulthood in both cortical and trabecular bone [88]. Nevertheless,
the cortical bone may be a better indicator of long-term cumulative exposure to lead than trabecular
bone, once the last exchanges lead more actively with blood [39, 89].
Bone lead has been associated with several health problems, namely elevations in blood pressure
and hypertension [90, 91], increased risk of Parkinson's disease [92] and poor cognitive test
performances [93]. It is also known that bone lead accumulation may impair bone growth and
remodelling with occurrence of decreased bone density and increased bone resorption activity
[94-96].
Although there is no defined limit for the lead concentration in bones and health outcomes, recent
studies provide evidence for adverse effects of lead concentrations above 10 µg g-1 [5].
2.4. Current spectroscopic techniques for the analysis of lead in biological
samples
To overcome the insufficient knowledge about lead metabolism in the organism, studies
concerning human biomonitoring, lead concentrations in several organs and their relation, and the
influence of several factors, are useful tools. New insights about factors that influence the
bioaccumulation of lead in the organism, such as age, dietary constituents, exposure regimen and
nutrient-lead interactions, should be provided.
To achieve these goals, the choice of the most appropriate spectroscopic technique and analytical
13 sample. In some samples, such as blood or urine, direct lead determination is possible, whereas for
others, such as soft tissues, hair and bones, a preliminary step of sample treatment may be
necessary. Depending the amount of the samples there are also more adequate methods than others.
Another important parameter is the detection limit, once the level of lead present in biological
samples often varies between ppm to ppb, and sometimes the use of a more sensitive analytical
techniques is needed [19, 32].
For the determination of lead total concentration, the most commonly used spectroscopic
techniques are AAS, inductively coupled plasma mass spectrometry (ICP-MS), inductively coupled
plasma atomic emission spectrometry (ICP-AES, also known as ICP-OES inductively coupled
plasma optical emission spectrometry) and X-ray Fluorescence spectrometry (XRF).
Several works have been conducted using AAS and have demonstrated the suitability of this
technique in determining the mean lead concentration of several biological samples. Multiple
studies were made using the Flame Atomic Absorption Spectrometry (FAAS): analysis of human
nails using them as bio-indicators of exposure to heavy elements [97]; analysis of lead content in
hair of exposed workers [98]; development of new procedures for determination of Pb and Cd in
hair samples [99]; improvement of a rapid method (less than 5 minutes) to determine lead in blood
[100]; study of the age influence in teeth lead accumulation [101] and of the relation between skull
and femur in rat bone samples, measured after microwave digestion [46]. The simplicity,
effectiveness, and relatively low cost make this elemental technique very appealing. However, the
sensitivity is usually insufficient for many samples, about 10-100 µg L-1 for lead. Thus, it is convenient to use ETAAS that has lower detection limits, about 0.05-0.5 µg L-1 for lead and allows lead determination in samples of small portions (20 µL) [102].
There are several studies measuring lead in blood using ETAAS [103-105]. Actually, it is the most
used technique in the diagnosis of workers lead poisoning. Studies made in urine range from the
development of a fast analytical method to determine lead in this sample [106], the participation in
an interlaboratory study to determine urine lead concentration [12], and to the direct measurement
of these samples with no digestion procedure [107]. Lead concentration study in the hair of young
children has also been conducted using ETAAS [108, 109], as well as in other routes of excretion
of humans and animals (nails, urine, hair, faeces) [110-112]. This technique has also been used for
the analysis of soft tissues and bones, namely in the determination of cadmium and lead in several
porcine [113], in kidney and liver of silver foxes to observe the content of lead, cadmium and
mercury in relation to age and reproduction disorders [114], in several soft tissues and bones of rats
that were ashed in order to measure the increase of lead retention in rats when exposed to lead in
early stages of life [47], and in different types of bone of non-exposed workers concerning their
14 The use of ICP-MS in the biological field studies, namely in trace analysis, is very popular due to
the excellent detection limits (ng L-1) and its ability to analyze multiple metals and performing isotopic measurements. However, its applications may be more sparse than AAS because of the
high cost of the instrumentation [5, 102]. The ICP-MS has been applied in the study total lead and
cadmium mean concentration and lead isotope ratios in whole blood [116-118]. It was also used in
the measurement of Cd, Cu, Mn, Ni, Pb and Zn in nails [111] and in the study of nails as a
biomarker of metal exposure [119]. Other studies relate the use of this technique in hair lead
determination and hair suitability as a tool for biomonitoring [120], as well as the relationship
between continuous lead exposure and the concentration of this metal in rat fur [121]. Several urine
lead concentration measurements have also been made using this technique [12, 122, 123]. It was
also used in archaeological bones analysis with the aim to use trace elements as indicators of
dietary habits, nutrition and disease [124] and in multi-elemental characterization of soft biological
tissues [125].
With a sensitivity lower than ICP-MS, but higher than FAAS, the ICP-AES is also a powerful tool
for lead analysis. It is normally used for multi-elemental measurements, being very economical for
a large quantity of samples. A major study made by Hee and Boyle [126] showed the suitability of
this technique in multi-elemental analysis of a large amount of samples: leaded paint, human blood
and excretions and Sprague Dawley rat soft tissues and excretions. The ICP-AES as also been used
to analyze hair for lead in children of two Sardian towns [127] and in the study of the relation with
cognitive functioning tests [128]. Hair, nails and teeth Pb and Cd concentrations in environmentally
exposed people were also conducted by ICP-AES [129]. The concentration of lead in blood, as also
been determined as a part of an environmental impact study about a lead smelter in Sweden [130].
Analysis of 14 elements in Taiwanese bones was also successfully achieved with the use of this
technique [131].
The XRF has also given great contribution to the analysis of lead in biological samples with
minimal sample pre-treatment. With detection limits in the order of µg g-1,the EDXRF has been applied to study trace elements in liver, brain and kidneys of patients with cirrhosis [132], and other
human tissues as blood, bone, hair, liver and kidney [133-135]. Once this technique is non
destructive, it is widely used in vivo studies to analyse the distribution of lead in bone [136-138]
and even it relation to Parkinson disease [92]. With lower detection limits, in the order of ng g-1, the TXRF has also been largely used in the study of lead in biological samples. Elemental constitution
of cancerous tissues, namely colon, breast, uterus [139], lung, prostate and intestinal tissue, rectum
and stomach [140], and also the analysis of human soft tissues for cancer recognition [141] have
been performed giving importance to lead. Other studies also have been reported among which
15 and in human amniotic fluid and placenta in order to study child weight and maternal age
dependence [143].
Synchrotron radiation X-ray Fluorescence (SRXRF), with detection limits between EDXRF and
TXRF ones, was used to determine multi-element concentration of lead and several elements in of
the small mammals diet and tissues [144], in humans placenta, blood and hair, and animal hair,
16

![Figure 6: Mo anode X-ray tube spectrum as a function of the applied voltage at a constant filament temperature (adapted from [154])](https://thumb-eu.123doks.com/thumbv2/123dok_br/16543074.736820/46.893.254.655.399.808/figure-spectrum-function-applied-voltage-constant-filament-temperature.webp)

![Figure 15: Comprehensive scheme of an ultrasonic probe (adapted from [16] with kind permission of J.L](https://thumb-eu.123doks.com/thumbv2/123dok_br/16543074.736820/80.893.241.676.779.1045/figure-comprehensive-scheme-ultrasonic-probe-adapted-kind-permission.webp)