The trilogy of distance, speed and time
David Banister
Transport Studies Unit, School of Geography and the Environment, Oxford University, UK
a r t i c l e
i n f o
Keywords:
Sustainable transport Shorter distances Slower travel
Social constructs of time
a b s t r a c t
Over the recent past there has been a dramatic increase in travel, mainly driven by the desire to move faster and over ever greater distances. This growth is unsustainable, and the continued growth in levels of mobility needs to be reassessed through substantially reducing the levels of consumption (energy and carbon) in transport. This means that travel activities should be based on shorter distances and slower speeds, with a more flexible interpretation of time constraints. Transport geographers should have a strong and instrumental role to play in this debate. This paper outlines the changing patterns of move-ment, before concentrating on urban areas where most daily travel takes place, and it examines the tril-ogy of distance, speed and time. The focus of the paper is on distance, and the role that land use planning and development, and technology can play in encouraging new forms of travel in cities, but there are strong implications on the ways in which speed and time are conceptualised. The conventional transport paradigm is heavily embedded in the belief that travel time needs to be minimised and consequently speeds need to be increased. The resulting impacts on travel distances have not been part of that debate, but reducing travel distances is central to sustainable transport.
Ó2010 Elsevier Ltd. All rights reserved.
1. Introduction
Distance travelled has grown dramatically over the recent past, and all activities depend on travel and movement to get people and goods to where they are needed. Present lifestyles depend on travel and there are huge benefits from this increased mobility. Transport geography is concerned about the volumes and patterns of move-ment of people and goods, the price of transport, and the role of transport in economic, political, and social development. But this is a rather narrow view of the role that it could play, as there is a newer more modern literature about distance, speed and time, and the role that transport geographers can and should play in strengthening the theoretical and conceptual basis of transport.
It is ironic that geography must be central to transport and transport to geography, yet the two have not been closely linked in transport studies, and the dominant economic paradigm in transport has been the neo-liberal thinking about market-based approaches, embedded in notions of rational behaviour1. Recent debates within the geographical literature have been initiated by interests in the geography of networks and their impacts (Rodrigue et al., 2009) and in the notion of travel spaces (Shaw et al., 2008), but there is still a ‘divide’ between transport geography and other
geographical research. Goetz et al. (2009) have proposed a more innovative approach that embraces alternative research methods in mainstream transport geography. But the insularity within the discipline needs to be addressed, and the strengths of transport as an interdisciplinary subject reinforced through substantially raising its profile (Hall, 2010).
Similarly, the understanding of time has been commodified through the argument that regulation and exploitation of labour re-sults in higher profit through saving time, so that ‘‘when time is money, then faster is better’’ (Adam, 2004, p. 39). Time compression has become a key concern in capitalist economies in the search for greater productivity from labour (Harvey, 1989). Social scientists have also become more interested in travel and transport with key inputs from psychology (Levine, 2006), anthropology (Clifford, 1997) and sociology (Urry, 2007). For example Urry has argued that mobility should be seen as a central integrating construct for soci-ology. Yet, inputs from geographers have been limited, even though the spatial aspects of transport are hugely important.
In this paper, the changing patterns of movement are outlined, together with explanations of the reasons behind the enormous growth in mobility over the last 150 years. This provides the con-text within which to question the current consumption led growth in distance and speed travelled, as constrained by a fixed travel time budget. The argument presented here makes a case for lower levels of consumption (energy and carbon) within transport, through travelling shorter distances at slower speeds, within a more flexible interpretation of time constraints. Transport geographers should
0966-6923/$ - see front matterÓ2010 Elsevier Ltd. All rights reserved. doi:10.1016/j.jtrangeo.2010.12.004
E-mail address:[email protected]
1 See also the similar debates on transport geography and the ‘new’ mobilities, and
how ‘‘the two glide past each other and never become fully engaged’’ (quoted inShaw and Hesse, 2010, p. 310).
Contents lists available atScienceDirect
Journal of Transport Geography
have a strong and instrumental role to play in this debate, so that sustainable transport becomes a central concern.
2. Lessons from history
Distance travelled seems to have been increasing over time as faster transport has replaced slower forms of transport, but it has only been in the last 50 years that real growth in both speeds and distances have taken place. Until about 150 years ago (1860), daily travel distance was limited to travel by foot and on horse-back, but the railway changed that with speeds increasing from 5 km/h (walk) and 10 km/h (horse) to over 40 km/h (rail). By 1900, daily travel distances had increased to about 1 km per person per day according to theGrübler (2004)analysis in France (Fig. 1). It then increased to 10 km by 1960, and to 50 km by 2000. The question here is where does this exponential increase end or is the only logical conclusion that there are no limits to the distance that can be travelled?
The conventional view from geographers is that transport is an enabling technology that facilitates mass production and globalisa-tion (Knowles, 2006), and that time–space convergence has led to centralisation and specialisation of all forms of economic activity in those locations that offered a comparative advantage (Janelle, 1969). These views have been contested in the New Economic Geography (Krugman, 1994), where it has been argued that increasing returns to scale and competitive advantage drives eco-nomic growth, not comparative advantage. In both cases the role of transport was not considered important because transport costs were low and decreasing, and transport only makes a small contri-bution to total production costs.
The focus of this paper is on urban areas, as the same trends can be observed, but on a more modest scale, and as this is where most daily travel takes place. The figures for London give a slightly dif-ferent picture, asGreen’s unique study (1988)of commuting for workers to the Bespoke Tailors Henry Poole’s illustrates (32 Savile Row) for the 1850s and 1890s. For these skilled artisans or the new middles classes, the average trip length increased from 2.2 km to 4.5 km over the 40 years, with a very different distribution of dis-tances (Fig. 2,Table 1). In 1857–1877, the maximum figure was about 7 km, with 95% travelling less than 5 km to work, but by 1890–1999, the maximum distance was over 10 km and under a half travelled less than 5 km. London had expanded over this per-iod and travel was no longer undertaken on foot (or by bicycle), but by bus, tram and rail. In addition, the number of journeys in
London rose from 256 m (1880) to 819 m (1900), and this increase was far higher than that attributable to population growth. The number of journeys per person rose from 55 to 126, and this growth was given impetus by the ‘‘improved methods of transport provided for the development of the Victorian suburb’’ (Green, 1988, p. 191). The close relationship between workplace and home was undermined as a result of the increasing distance travelled to work. AsGreen (1988, p. 192)concluded: ‘‘A once thriving compet-itive political culture, focussed on the workplace, was replaced by a conservative ‘culture of consolidation’ centred on the music hall and the privacy of family and the home.’’
This transformation can be linked to the changing distribution of population in London, and it also encapsulates the transition from the industrial to the post-industrial city (Table 2). The popu-lation of London has grown rapidly over the last 200 years, increas-ing by more than 4.4 million people in the 19th Century, peakincreas-ing in 1951 and then declining until recently (ONS, 2005). In 2007, the population exceeded 7.5 million (Table 2). Densities have also grown rapidly to 1901 and then stabilised, but even today they are high at 12,240 people per sq mile (4726 per sq km). The Inner London densities have also risen to peak at 38,476 people per sq mile in 1901, and then have fallen with the out migration and changes of land use, but even here there have been signs of change with a recent (2007) increase to 25,420 people per sq mile (9814 per sq km). The densities were comparatively low in Outer London until 1901, but stabilised from 1951 onwards, with a cur-rent level of 9145 people per sq mile (3530 per sq km).
The final statistic worth pointing out is the proportion of the population of London living in the Inner and Outer areas and how this has changed over time. In 1801, 87% of London’s popula-tion lived in the Inner area, and this proporpopula-tion has reduced over time to 70% in 1901 and 45% in 1951. The current level is 40% in
Source: Grübler, A. (2004) Technology and Global Change, Cambridge: Cambridge University Press (139).
1800 1850 1900 1950 2000
0.01 0.1 1 10 100
Km
Total Waterways
Horse power Rail Two wheeler Car and bus
Aviation
Fig. 1.Distance travelled in France during the last two centuries (km/person/day).Source:Grübler (2004). Table 1
Henry Poole’s employees distance to work in 1857–1877 and in 1890–1899.
Distance (m) 1857–1877 1890–1899
Number % Number %
0–999 46 28.4 12 11.9
1000–1999 38 23.5 12 11.9
2000–4999 70 43.2 23 22.8
>5000 8 4.9 54 53.4
Total 162 100.0 101 100.0
the Inner area and 60% in the Outer area, which accounts for 80% of the land area. The density ratio2is currently 2.8–1, and this is re-flected in the modal shares for the two types of location (Table 3). Suburbanisation has been going on for 200 years, but it was in the period 1850–1900 that the suburban population grew from 10% to over 30% of the total population of London. This was the period of the expansion of the public transport network in London. Further
growth in Outer London to 55% (1951) and to 60% (1971) of the total population, all came before the growth in private motorisation. It cannot be concluded that the development of Outer London and the suburbs result from motorisation, as it predated the rise of mass car ownership.
Such a commentary is reinforced byHartog, 1999andHartog, 2005 in his ongoing studies of 40 European cities over time. He took a measure of space (square metres) per head of population, concluding that medieval cities gave a generous space allowance to each person and that movement was mainly by foot. The indus-trial cities were worst in terms of their space allocation, but this
Fig. 2.Henry Poole’s employees’ distance to work.
2
The density ratio measures the ratio of the density of Inner London to that of outer London –Table 3.
Table 3
Trips per day in London (2007–2008).Source:TfL (2009), based on Table 3.1.
Trips within inner London (19% of area) Trips within outer London (81% of area)
6,470,000 Trips (35% of total) 8,449,000 trips (46% of total)
Walk and cycle 45% Walk and cycle 35%
Public transport 34% Public transport 14%
Car 21% Car 51%
Trips between Inner and Outer London Trips between London and the rest of Britain
2,450,000 Trips (13% of total) 1,046,000 Trips (6% of total)
Walk and cycle 5% Walk and cycle 2%
Public transport 35% Public transport 17%
Car 60% Car 81%
Table 2
The growth, decline and growth of London.Source: Based onONS (2005)and updated.
Total – 621 sq miles Inner London – 118 sq miles Outer London – 503 sq miles
Population Density Population Density Population Density
1801 1096784 1764 959310 8137 137474 273
1851 2651939 4266 2363341 20045 288598 573
1901 6506889 10466 4536267 38476 1970622 3912
1951 8196807 13185 3681552 31226 4515255 8962
1971 7368693 11852 2959315 25100 4409378 8752
1991 6679699 10744 2504451 21242 4175248 8288
2001 7172036 11536 2765975 23460 4406061 8746
2007 7557000 12240 3000000 25420 4557000 9145
has now improved with most medium sized European cities having about 270 m2 per person, falling in the largest cities to about 200 m2 per person (London’s density was 224 m2/pers in 2001 and Paris was 190 m2/pers in 2001). The allocation of space in London has increased from 32 m2per person in 1832 to 112 m2 per person in 1950, and the current level of 224 m2, a doubling in just 50 years due mainly to the spreading of the city and the decline in population from 1950–1990 (Table 2).
3. Distance
Two separate dimensions of distance in the city are identified, both of which are central to the geographer’s concern over space. First, space and place are seen as distance with a physical measure of travel. Within the sustainable mobility paradigm (Banister, 2008), planning has an instrumental role in reducing trip lengths so that proximity or closeness becomes a key consideration in the location of new activity or in the reorganisation of existing activities. This objective is a reversal of the Victorian separation of workplaces from homes, and it recognised the role that mixed land uses can play in maintaining and enhancing local services and facilities – accessibility. Second, there is considerable debate over the use of new technologies in city transport to reduce its dependence on carbon based energy sources. Distance is seen here as a limitation, as the range of new vehicles is constrained (electric vehicles at present have a range of 100–150 km between charges), and so shorter distances together with new types of city vehicles means that the role of the car in the city may need to be reinterpreted.
3.1. Land use planning and development
Trying to unravel the complexities of the interrelationships be-tween travel distance, urban form and sustainable development is difficult. Underlying the discussion is the requirement to have some vision of the city in its desired form – it should be viable (economic justification), have vibrancy (cultural diversity, inclu-siveness and fairness), and it should have vitality (high quality of life, health and environmental quality). Transport provides an essential element in city viability, vibrancy and vitality, maintain-ing the quality of urban life, urban plannmaintain-ing and sustainable devel-opment, where mixed uses, high densities and good environmental conditions are seen as being central to both improving economic performance, diversity and the quality of city life.
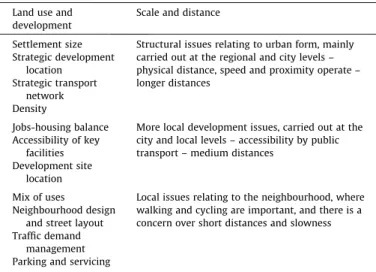
Table 4clearly illustrates the physical planning dimensions of the debate with a series of different factors that influence physical distances at different scales from the regional through the city to the local level (CfIT, 2009). However, in addition to this rather structural interpretation of the relationships between the key ele-ments, there is evidence of inconsistency, as the objectives of pol-icy are contradictory with speed being seen as a positive element
at the more strategic scale, but as a more negative element in local decisions. This apparent inconsistency may relate to how people view their community (sense of nearness) and their region or city (sense of remoteness), and the different roles that they play con-cerning local values and individual responsibilities on the one hand and more general values and delegated responsibilities on the other hand.
Much has been written at the more strategic level on the impor-tant role that land use and development decisions can play in reducing travel distance, but maintaining and enhancing quality of life in the city (Banister, 2011; Cabinet Office, 2009a; TRB, 2009; CfIT, 2009). The conclusion here is that planning can and should have a positive contribution to make in reducing vehicle miles travelled by car and that shorter distances encourage a great-er range of modes to be used. It also helps create bettgreat-er quality ur-ban environments that are more cohesive and more diverse. Most importantly though, it directly tackles the question as to the own-ership of the street and how transport can contribute best to the quality of city life (Table 5).
Several important issues are raised in Table 5 that begin to question the function of the street as a place for people or a route for movement, and how the most appropriate balance can be established between these competing uses. The new Manual for Streets 2 (DfT, 2010b) helps to resolve the conflict between place and movement, but in all cases it is the trade off between distance, speed and time. The travel and transport elements must be firmly embedded in the structure of the city, the needs of the people and the overall quality of both place and space. There are now huge opportunities to make much more flexible use of city space
Table 4
Land use and development, scale and distance.Source: Based onCfIT (2009). Land use and
development
Scale and distance
Settlement size Structural issues relating to urban form, mainly carried out at the regional and city levels – physical distance, speed and proximity operate – longer distances
Strategic development location
Strategic transport network Density
Jobs-housing balance More local development issues, carried out at the city and local levels – accessibility by public transport – medium distances
Accessibility of key facilities Development site
location
Mix of uses Local issues relating to the neighbourhood, where walking and cycling are important, and there is a concern over short distances and slowness Neighbourhood design
and street layout Traffic demand
management Parking and servicing
Table 5
Policy analysis of urban transport.Source: Based onCabinet Office (2009a, p. 41).
Policy area Desired policy outcome Impact on quality of life
Economic prosperity Health outcomes Enjoyment of space
Roads and streets An optimal balance between movement and place functions of roads and streets
Congestion reduction and increased reliability
Increased walking and cycling and less emissions
Easier to navigate and more enjoyable streets
Modal shift Enable a wider choice of mode of travel than just the car – active travel and benefit to health and
environment
Congestion reduction through increased bus use
Increased walking and cycling and less emissions
Appreciation of local community and environment
Spatial planning Encourage the use of spatial planning to develop well connected mixed use urban areas
Reduce need to travel Agglomeration effects
High quality street designs encourages more people to walk and cycle, and less emissions
according to time of day and day of week, and to encourage spontaneous activities. Shorter journeys offer the opportunity to use a wider range of modes of transport, including more use of public transport, walking and cycling. These are the sociable modes of transport that place a higher value on people and the community rather than self and individualism.
The pioneering work of Jan Gehl and others (e.g. Terry Farrell) have tried to push the urban debate towards involving the people. They have argued for improving the quality of the pedestrian net-work and for giving clear priority to people with more attractive spaces for gatherings, as this generates more activity (Gehl, 2004). The key here is to promote shorter journeys in the city through a combination of locating new development and in trans-forming existing development, so thatproximitybecomes a central determinant of land use policy. It is pushing the concepts of the new urbanism much further than in the USA (Southworth, 2003), as it takes these discussions to the local and human scales (Marshall, 2005andMarshall, 2009). The flexible use of space gives clear priority to the creation of quality spaces and places in cities so that people can take ownership and hence enhance their own quality of life. It is only through these social processes that the potential conflicts between the engineers (building roads), urban designers (use of space), planners (arbiters), and the local commu-nities (self and collective interests) can be resolved. This is the true meaning ofaccessibility, as it relates directly to what people can and want to do, rather than being only concerned with the physical properties of the urban structure.
3.2. Technology
Innovative thinking on the important role that clean technology can play in reducing transport’s dependence on oil is providing much needed momentum in thinking about transport futures. In the past, energy has not been seen as a problem in transport, as oil was ubiq-uitous and cheap, but this has changed with increasing concerns over energy security and the debate on the future of oil (Gilbert and Perl, 2010). The growth in travel distances has meant that more energy and carbon has been used in transport (Table 6). As distance has increased there has been a greater dependence on faster modes of transport, and this has resulted in an increase in energy use per km, even though there has been some efficiency improvement.
In the more dispersed rural locations, distances are greater and the potential for new technologies are rather limited, and it is likely that the conventional Internal Combustion Engine (ICE)3 and the Hybrid Electric Vehicle (HEV) will continue to dominate with little change in the supporting infrastructure. In urban areas, where there is potential for shorter distances and greater concentration of activities, the Electric Vehicle (EV) and the Plug-in Hybrid Electric Vehicles (PHEV)4have a much greater role to play. Most travel in cities is short distance (for example in London where over 70% of
trips are less than 5 km –Woodcock et al. (2007)), and carried out at lower speed, so there are substantial opportunities for very efficient ICEs (over 100 mpg or 3 l per 100 km) or small EVs with a range of 100 km between charges or PHEVs in the largest cities. In all cases, only the most efficient cars would be allowed into the city, and this would also enhance the environmental quality, reduce emissions and have substantial health benefits (Woodcock et al., 2009).
In the city, public transport (and taxis) could accommodate all travel needs, with a much greater degree of local movement possi-ble by walk and cycle. In the past the car has been owned and it is a multi-purpose vehicle, adaptable for all uses. A city vehicle could be small, slow, and efficient with a limited range. It need not be owned, but leased for each specific purpose so that the best possi-ble vehicle is being used on each occasion. This means that the ideal vehicle could be hired for each type of out of town journeys, rather than the current situation where the car is chosen as a com-promise between several different uses, few of which make opti-mal use of the car in terms of its size and performance. There would also be substantial benefits from the release of space within the cities, currently used for parking. This space would be returned to the people (Gehl, 2004), and it is consistent with his formula of ‘‘first life, then spaces, then buildings’’. A fourth dimension could be added to this formula, namely ‘‘and lastly transport’’.
Previously, distance has been seen as a limitation on the poten-tial for the use of slow city vehicles with a modest range. Provided that the electric energy needed to power EVs can be generated from renewable sources, there is now a new opportunity, as many city-based journeys are short and could be made by ‘‘clean’’ vehi-cles. But there is still a considerable degree of optimism in techno-logical views of the future, as diffusion of innovation is assumed to occur rapidly with high take up rates. There is little acknowledge-ment of the impacts on distance travelled, the rebound effects, the reactions of different sectors of the population to innovation, and the co-evolution of technological and social processes.
3.3. Comments on distance
The creation of safe urban environments for mass active travel means that a much greater emphasis should be given to the rela-tionships between the built urban form and the use of space (Gehl and Gemzoe, 2001). There needs to be a clear separation between the different types of space and the use of those spaces, with fun-damental questions being asked about the role of the car in the city. In turn this debate links back to planning for the convenience of shorter distances, the mixing of sizes, densities and uses of land in the cities so that the physical distances are lowered rather than increased – urban form matters.
The potential role of technology is more ambivalent, as the objective should not be to increase travel distances, but to rein-force the move towards shorter distances and more active trans-port (walk and cycle). The new forms of slow and clean vehicles, with novel ownership patterns provide the potential for comple-mentary change, but this is not a solution on its own, even though it may have a key contribution to make. The economic rationale for a change in thinking is also compelling, as the co-benefits of the reductions in travel distances are also substantial (Cabinet Office, 2009bandTable 7).
The promotion of shorter distances in cities through physical and technological measures is complemented by the social con-cerns over health. Recent research on London and Delhi (Woodcock et al., 2009) carried out a comparative risk assessment that exam-ines the changes in the disease burden resulting from technological innovation and an increase in active travel. Through the use of technology and a substantial increase in active transport, challeng-ing reductions in carbon emissions can be achieved in cities. The
Table 6
Carbon dioxide emissions from transport.Source:Givoni et al. (2010)andEurostar (2008).
High speed rail and air (London–Paris) Conventional rail and car (GB)
gCO2/
seat gCO2/
passenger gCO2/
pass-km
Conventional rail
60 gCO2/
pass-km
High speed rail 7000 5000 17 Car (1.6 pass) 104 gCO2/pass-km
Aircraft 45,000 30,000 168 Car (3.0 pass) 57 gCO2/pass-km
Notes: UK values on electricity mix used, but load factors and capacity of modes also crucial to emissions levels – the high speed rail data has come from Eurostar figures.
3
ICE – fuel consumption is related to speed and acceleration – also the cold start problem that has implications for efficiency and emissions.
4
effectiveness can be reinforced through measures that improve the quality of the local travel environment (e.g. safety, pollution, and priority use of space), and through making the use of motor vehi-cles less attractive, so that substantial co-benefits can be realised. For example, the health benefits of enhancing the quality of spaces so that it is possible to walk (up to 2 km) and cycle (up to 5 km) mean that some of the health related outcomes of car dependence can be addressed. These outcomes include reductions in levels of obesity, dementia, cardiovascular diseases, diabetes and some types of cancer (Woodcock et al., 2009).
There seem to be a strong case for promoting proximity and nearness, to embracing the limitations of distance in some new forms of technology, and to enhancing accessibility, healthy trans-port and the quality of life in cities (Banister, 2005). Although dis-tance has been identified as of particular interest to geographers, it is part of the central nexus that also includes time and speed. The conventional transport paradigm is heavily embedded in the belief that travel time needs to be minimised and consequentially speeds need to be increased. The resulting impacts on travel distances have not been a central part of that debate.
4. Concepts of speed and time
Travel time has been at the centre of transport analysis, and this concept has been built around travel as a derived demand, suggest-ing that the costs (widely interpreted) of gettsuggest-ing to a destination are more than outweighed by the benefits received at the destina-tion. The thinking here is that travel is a means to an end and that distances should be as short as possible. Yet the empirical evidence is clear and contradictory, namely that travel distances have in-creased over time. It is not that we are doing more in terms of par-ticipating in more activities, but that we are travelling further to get to a similar range of activities.Table 8shows the summary tra-vel data for Great Britain over the last 35 years, with the growth in average trip distance per person (this rose by nearly 60% to 2002, but has then been stable), and the stability in the numbers of trips made and the travel times per trip and per year. This means that speed has increased by 44%.
The economic interpretation of these patterns of travel is based on the concept of choice, as it is assumed that more choice brings greater societal welfare (Metz, 2008a). As people become more mobile, they choose to travel further as they have a greater choice of destinations (work, school, hospitals, shops etc.) and that there is a consumer benefit (otherwise they would not do it). There are also strong economic incentives for such a change, as it leads to economies of scale and the provision of a wider range of services and facilities, at least for those who can travel those longer distances.
However, there are also serious limitations to this line of argu-ment, as it assumes that more choice is better, but this might not necessarily be true (Banister, 2008). The data (Table 8) also suggest that the huge growth in travel has been moderated in the last 10 years, as travel patterns have stabilised (Metz, 2010). Travel times and speeds have not increased, and so distances have stabi-lised at about 7 miles per trip (11.2 km). There are also strong so-cial limitations, as not all people have access to the car, and not all want to or can afford to travel long distances (Knowles, 2006). Although society as a whole may be car dependent, there are still a large number of people (about 30% of the total population) that will never be able to drive a car as a consequence of limitations such as age, disability and cost, and even choice (Banister, 2009). So the more choice argument and the wider range of alternatives can be seen as a means to increase the mobility for many, but de-crease in the opportunities for others if alternatives to the car are not available.
To achieve substantial reductions in energy use and carbon emissions in transport, it is accepted that fundamental behavioural change is required, as well as seeking the most energy efficient technological solutions (House of Lords, 2010). Transport needs to ‘decarbonise’ its operations over the next 20 years to become ‘clean’, but even this will not be enough as some longer distance transport will still be heavily dependent on carbon based energy sources. The options available are to reduce the number of trips that are made, to shorten the trip lengths, or to switch to the most efficient (public transport) and clean modes of transport. This means a fundamental rethink of the priorities for the transport sys-tem, as in the past the emphasis has been on providing additional capacity to accommodate faster and longer journeys. There is now a realisation that demand will always exceed supply, and that in a well developed transport network additional capacity induces additional travel, but does little to enhance accessibility (Goodwin, 1999; Docherty and Shaw, 2011). There needs to be a debate over what transport infrastructure is actually needed (however de-fined), and then to allocate priority to different users and uses through strong physical planning measures supported by demand management. The ubiquitous availability of technology (ICT and ITS)5allows space and time sensitive uses to be allocated and to give directions in real time directly to users, so that the whole network begins to operate more like the railways (with time and route spe-cific slots).
The central concept in all transport analysis has been desire to ‘save travel time’. Transport appraisal is almost totally (80%) dependent on the user benefits resulting from travel time savings and hence the overwhelming desire to speed up traffic. This in turn reinforces the comments made in the previous section on the social and environmental problems that are created. In the past, when there were clear objectives about the merits of a car owning soci-ety, with cheap energy and unlimited space, the imperative of fol-lowing the industry led view of high levels of cheap travel seemed to be very attractive. Current concerns over the limits of mobility and the much greater awareness of the social and climate changes costs, together with new issues relating to peak oil, energy secu-rity, high and volatile prices, and fuel poverty, all suggest that these priorities should change.
One very powerful argument that has been central to transport thinking is the notion of travel time budgets (in the UK it is about 62 min per person per day –DfT (2009, Table 3.6)) and that these levels have remained constant over time. This means that with fas-ter travel one can get to more destinations (choices) within the available budget. There is a long history here going back to the
Table 7
Costs of urban transport externalities in England.Source: Based onCabinet Office (2009b).
London ITAs All urban areas
Excess delays (2009) £3.9 billion £3.7 billion £10.9 billion Accidents (2008) £2.1 billion £3.0 billion £8.7 billion
Air quality (2005) N/A N/A £4.5–
£10.6 billion Physical inactivity (1998) £2.2 billion £2.7 billion £9.8 billion Greenhouse gas emissions
(2003)
N/A N/A £1.2–
£3.7 billion
Noise – amenity (2006) N/A N/A £3.0–
£5.0 billion
Notes: Price levels in brackets. ITAs are the Integrated Transport Authorities – these cover the former metropolitan counties of Merseyside, Greater Manchester, South Yorkshire, Tyne and Wear, West Midlands and West Yorkshire. Urban areas are classified as those with more than 10,000 population. N/A means not currently available.
5
work ofZahavi (1982), and more recently to Marchetti (1994)6, Hupkes (1982)andSchäfer (2000). Even though there is clear empir-ical evidence, there are also questions that need to be raised, relating to the accuracy in the recording of time (5 or 10 min chunks), recall of activities (in the UK National Travel Survey (NTS) a 7 days travel diary is used but in the UK time use survey a 1 day activity diary is used), the variations between the different groups in society or locations, and the use of averages, rather than median values or dis-tributions of values. For example, on any given day, not all people travel and in some datasets short trips are ignored and access trips are under recorded. But even given these caveats, the empirical evi-dence is powerful, when looking at data from the UK NTS over the recent past.
The UK Time Use Survey (Lader et al., 2006) produces a higher figure of 87 min per person per day than the UK NTS (62 min) for those who travel and are over 16 years of age. If this figure is ftored to compensate for those who do not travel and to take ac-count of the younger population (who travel less), the global figure is reduced to about 72 min per person per day. This is still 16% (10 min) higher than the NTS figure. The difference may relate to the survey method (1 day and not 7 days), and to the use of an activity diary where all the time during the day is accounted for. The actual figure may be even higher7(the Marchetti Constant is 90 min), and key discussions still remain over the distribution of vel time use between different groups in society, the stability of tra-vel time over time, and international tratra-vel time that is currently not included in the accounting framework.
Even though the empirical evidence may give one picture, the question still remains over whether there is any inherent physio-logical reason why time use for travel should be fixed. Given the 24 h in a day and certain allocations to particular activities (sleep, work and eating), there are clear constraints on the maximum time
available for travel. This travel time could be divided into support-ing essential activities (fixed) and as part of ‘free’ activities (flexi-ble). Fixed and flexible time is likely to vary for each individual over time (weekday and weekend), and over their lifetime. Surely it would be more appropriate to think about travel time as it varies between individuals and over time in a much more flexible and creative way?
The way in which travel time savings are used in transport ap-praisal and more generally in modelling is key to demand forecasts and to the evaluation of investment alternatives. The values of time used are limited in their appropriateness, as they only cover work and non-work activities, with an emphasis on only a few modes of transport, and the equal importance given to small time savings for large numbers of travellers (Buchan, 2009). Issues relating to the opportunity costs of the time savings, and whether the time sav-ings in one form of travel just means more travel in other ways (the travel time budget argument) suggest that there is circularity in the argument. There is a clear need to save travel time by invest-ing in better transport, but this means that additional travel is gen-erated to use the ‘saved time’. Yet travel time savings and speed have been the overriding concerns of transport planning for the last 50 years.
This argument is based on the rationale that all travel is ‘waste-ful’ (Hamilton, 1989) and that travel time ought to be minimised, and it is complemented by a slightly weaker argument that greater choice is beneficial. Hence a better transport system provides the wider range of destinations, but it also raises the issue about the marginal benefit of increased choice in spatial opportunities. The inevitable consequence of this thinking is to promote speed as the clear primary objective of transport systems to ‘save time’. This leads to longer travel distances, it has distributional outcomes (greater inequality), and it results in greater use of resources, as higher speed increases energy consumption and carbon emissions. Perhaps the real contribution that geographers make here is to strengthen the focus on the distance element, and to explore the means by which travel distances can be reduced. This may result in reductions in travel time and in travel speed, and this would be beneficial in terms of travel time saving and reductions in the use of energy (and carbon). There may also be social benefits as it would be easier to provide high quality public transport and the full range of local services. This in turn would provide a major contribution to the achievement of a sustainable transport system.
Table 8
The changes in travel distance in Great Britain (1972/1973–2009) (trips/miles/h/min/number)Source:DfT (2010a),Table 2.1. Year Number of trips per person per year
All tripsa
Trips of 1 mile or more
Distance travelled (miles)
Time taken (h) Average trip length (miles)
Average trip time (min)
1972/1973 956 594 4476 353 4.7 22.2
1975/1976 935 659 4740 330 5.1 21.2
1978/1979 1097 736 4791 377 4.4 20.6
1985/1986 1024 689 5317 337 5.2 19.8
1989/1991 1091 771 6475 370 5.9 20.4
1992/1994 1053 742 6439 359 6.1 20.5
1995/1997b
1086 794 6981 369 6.4 20.4
1998/2000 1071 810 7164 376 6.7 21.1
2002 1047 819 7135 380 6.8 21.8
2003 1034 812 7192 381 7.0 22.1
2004 1026 806 7103 382 6.9 22.3
2005 1044 818 7208 385 6.9 22.1
2006 1037 812 7133 383 6.9 22.2
2007 972 786 7103 377 7.3 23.3
2008 992 800 6923 376 7.0 22.7
2009 973 774 6775 372 7.0 22.9
a
There is an apparent under-recording of short walks in 2002 and 2003 and short trips in 2007 and 2008 compared to other years.
b
Data from 1995 onwards has been weighted, causing a one-off uplift in trip numbers, distance travelled and time taken between 1992/1994 and 1995/1997.
6
Marchetti’s Constant is a term for the average amount of time spent travelling each day, which is approximately one and a half hours. Developed by Venetian physicist CesareMarchetti (1994), it posits that although forms of urban planning and transport may change, and although some live in villages and others in cities, people gradually adjust their lives to their conditions (including location of their homes relative to their workplace) such that the average travel time stays approximately constant. He also introduced the notion of the ‘cave instinct’ in that people wanted to return to their homes at the end of each day.Hägerstrand (1985)introduces a related principle, which he calls the principle of return.
7
5. Time as a social construct
Since the 1970s the use and experience of travel time have been examined by academics. Much of this work draws (loosely) on psychological theories and concentrates on travel-lers’ mental experience of travelling (Dobson et al., 1978; Ory and Mokhtarian, 2009). Sociologists have also turned to analys-ing the social dimension of travel time, conceivanalys-ing of travel as a means to achieve face-to-face contact and as a place where people encounter and interact with other people and a host of objects and devices (Jain and Lyons, 2007; Watts and Urry, 2008). Rather than understanding travel time as the minimisa-tion or optimisaminimisa-tion of effort, travel time can be seen as a so-cial construct, the quality of which should be maximised and more highly valued (Cresswell, 2006; Cresswell, 2010). There needs to be a greater understanding of how people use and experience travel time, and this can be achieved in three re-lated ways.
Firstly, travel can be seen as beingembodied and relational, as it is concerned with what we do and what is experienced with and through ourselves. It also relates to what we think about it as part of our social networks and encounters with other people, as alter-native means of transport, and our associations with infrastructure, signs, rules, laws, etc. This perspective affords detailed understand-ings of what people actually do when they travel, and their expe-riences in terms of what is enjoyed or disliked. It has implications for the quality of the transport service, for example how train compartments, car interiors, bus stops and stations can all be better designed, so that travellers can use their travel time more effectively.
This social experience is linked to the more physical travel prac-tices that are more time dependent. These experiences reflect on past travel, including the activities that are enjoyed at the destina-tion, and the movements of goods, images and information (including virtual and communicative travel). This integrative per-spective enables a deeper understanding of how travelling helps people to maintain spatially extended social networks and also how it is instrumental to wellbeing.
Secondly, travelling and travel time areculturally constructed, as meanings and values are inscribed through popular media, science and policy-making and everyday conversation. One way to better understand how people think and experience travel time is to sys-tematically analyse issues such as the representation of (the time spent in) travel in the popular media (TV programs, advertise-ments, widely read (non)fiction books). Important here is an understanding of how people talk about travel time and use meta-phors related to travelling in everyday conversations. This would include the genealogy of contemporary western understandings of time and travel time, and how those understandings differ from knowledges about time and travelling in non-Western and/or pre-Industrial societies.
Thirdly, travel is a space–time in whichsocial differencesare constructed in various ways, including the operation of regulatory, financial, physical, cultural and other mechanisms through which certain people are excluded from travelling in a certain manner. However, differentiation and ‘othering’ also take place through gestures, looks and practices of travellers sharing a transport space and through other logics.
The benefits of placing travel and travel time within a wider context is that it extends and enriches our understanding of the human processes behind travel, and it begins to make more expli-cit the real reasons for the differences in behaviour. It is not just a matter of time and speed that determine the value of travel, but important personal (emotional, relational and experiential factors), cultural (societal factors) and social factors that are also instru-mental in everyday decisions about travel.
All of these departures need to be thought of as part of a holistic agenda that can then be related more precisely to the reinterpreta-tion of the current rather narrow economic conceptualisareinterpreta-tion of travel time and the importance of speed. It also links in with the impact of distance on the understanding and experience of travel, as much of the cultural construction of transport is based on a par-ticular representation of travel as embodied in the car. This is cen-tral to Urry’s views on automobility as a complex self organising system, where he identifies six elements that dominate current interpretations of mobility (Urry, 2007, pp. 115–118).
The commodification of time has led to just one aspect of time, namely travel time savings, being emphasised over all other as-pects of time. There is a huge literature on the concept of time that relates to time as counting, clock time, mobilising world time, and instantaneous time (Adam, 2004). Perceptions about the pace of life speeding up are common, and technology is seen as being the main driver. But these relationships are not simply uni-directional (acceleration), as there are new complex linkages being established between technological innovation and the use of time, and time practices change (Wajcman, 2008). Part of the underlying rationale here is that through the compression of time (mainly achieved through higher speeds)8, time savings can take place and this has value, as there will be increases in output, which in turn leads to a reorganisation of activities temporally and spatially (Taylorism and Fordism). This overriding concern with time savings needs to be balanced with a richer interpretation of the many different constructs of time that might begin to increase our understanding of travel decisions, the quality of time and the benefits of slower not faster movement.
6. Conclusions
Transport geography is at the centre of a set of traditional and new paradigms, and it has a potentially instrumental role in mov-ing the debate in new directions. The traditional positivist ap-proach to transport analysis is now being questioned, as travel can no longer only be seen as a derived demand with no positive value in the activity of travel. Both the empirical and theoretical evidence challenges the continued emphasis over the need to speed up transport to ‘save time’ and the assertion of constant aggregate travel time budgets (Metz, 2008b). Travel has a sub-stantial (and increasing) value, and that other value systems relating to experience, reliability and quality have important im-pacts on the nature of travel. This means that transport geogra-phers should break away from the narrow ‘economic’ concerns over time and speed, and explore the richer issues of travel dis-tance that can be firmly embedded in an understanding of behav-iour and culture.
The focus of this paper has been on the distance element, as it is concerned with the spatial implications of the speed and time rela-tionship. Building on the sustainable mobility paradigm, the case has been made for slower travel that places a higher value on the quality of the experience, as well as the embodied and relational aspects. This in turn means that travel in the city is seen as consist-ing of a multitude of shorter journeys, usconsist-ing a combination of ac-tive transport modes (walk and cycle) and public transport. The need for private transport is reduced, and in all cases the best avail-able technology is used. This in turn suggests limited ownership of private transport and the use of innovative leasing and renting opportunities to ensure the most appropriate form of transport is used for each activity. It challenges the future of the car culture in its current form.
8
Such a vision would result in a spectrum of alternatives avail-able to all, and policy issues about differential access to transport would be substantially reduced. It would address most of the social barriers currently facing transport decision makers in balancing the complexity of conflicting social, environmental and economic objectives. To move the debate away from the current political, economic and public attachment to car based travel is a difficult challenge, but it needs to be undertaken to address the environ-mental and social problems that have been created. By including the distance dimension much more explicitly into the debate, it would both reduce environmental impact through less travel and produce other benefits (Table 7), and it would help to provide alternatives to the car for those that cannot or do not want to de-pend on it.
This means that the growth in travel distance needs to be reas-sessed with a view to reducing it, as shorter distances and slower travel have positive co-benefits for the environment (including safety), energy (and carbon), social inclusion, wellbeing (including health) and the economy. It is quality of the travel experience that needs to be addressed, as well as the means of travel. Speed and time have dominated the debate on transport to the exclusion of distance, which has only been seen as the consequence of decisions made in the transport sector. It is now opportune to reassess the dominant paradigm and to look at the means by which travel dis-tance can be shortened, through slower travel to more local activ-ities, through travel as a quality experience, through taking responsibility and ownership of the urban environment, and through exploring the means by which all people can increase their accessibility. Transport geographers have a major role to play in the reorientation of priorities for transport planning.
Acknowledgements
This paper has benefited from Tim Schwanen’s comments and from the audience at the RGS/IBG Hoyle Lecture on 1st September 2010 in London, when it was first presented. Thanks also to the constructive comments from the referees and to Jon Shaw for his comments as Associate Editor.
References
Adam, B., 2004. Time. Polity Press, Cambridge.
Banister, D., 2005. Unsustainable Transport: City Transport in the New Century. Routledge, London.
Banister, D., 2008. The sustainable mobility paradigm. Transport Policy 15 (1), 73– 80.
Banister, D., 2009. Rural transport. In: Kitchen, R., Thrift, N. (Eds.), International Encyclopedia of Human Geography, vol. 11, pp. 460–464.
Banister, D., 2011. Cities, Mobility and Climate Change. Journal of Transport Geography.
Buchan, K., 2009. Investing in Transport: Making the Change, Report by the Metropolitan Transport Research Unit for the Green Alliance, London (November). <http://www.green-alliance.org.uk/uploadedFiles/Our_Work/ Investing in transport-Makingthechange.pdf>.
Cabinet Office, 2009a. An Analysis of Urban Transport. Produced by the Cabinet Office Strategy Unit, London (November).
Cabinet Office, 2009b. The Wider Costs of Transport in English Urban Areas in 2009. Paper Prepared by the Cabinet Office Strategy Unit, London (November). Clifford, J., 1997. Routes: Travel and Translation in the Late Twentieth Century.
Harvard University Press, Boston.
Commission for Integrated Transport (CfIT), 2009. Planning for Sustainable Travel: Summary Guide, Report Prepared for the CfIT by the Halcrow Group, Oxford Brookes University and the University of Oxford (October) <http:// www.plan4sustainabletravel.org>.
Cresswell, T., 2006. On the Move: Mobility in the Western World. Routledge, London.
Cresswell, T., 2010. Towards a politics of mobility. Environment and Planning D 28 (1), 17–31.
Department for Transport, 2009. Transport Statistics Bulletin: National Travel Survey 2008. The Stationery Office, London.
Department for Transport, 2010a. National Travel Survey 2009. The Stationery Office, London (September,Table 2.1).
Department for Transport (DfT), 2010b. Manual for Streets 2. The Stationery Office, London (October).
Dobson, R., Dunbar, F., Smith, C.J., Reibstein, D., Lovelock, C., 1978. Structural models for the analysis of traveler attitude–behavior relationships. Transportation 7 (3), 351–363.
Docherty, I, Shaw, J., 2011. The transformation of transport policy in Great Britain? ‘New Realism’ and New Labour’s decade of displacement activity. Environment and Planning A.
Eurostar, 2008. Greener than Flying. Based on Research Conducted for Eurostar by An Independent Consortium of Paul Watkiss Associates and AEA Technology Environment. <http://www.berr.gov.uk/files/file39387.pdf>.
Gehl, J., 2004. Towards a Fine City for People–Public Spaces – Public Life – London 2004. Transport for London and the Central London Partnership, London. Gehl, J., Gemzoe, L., 2001. Public Spaces–Public Life. Danish Architectural Press,
Copenhagen.
Gilbert, R., Perl, A., 2010. Transport Revolutions: Moving People and Freight Without Oil. New Society Publishers, Vancouver.
Givoni, M., Brand, C., Watkiss, P., 2010. Are railways ‘Climate Friendly’? Built Environment 35 (1), 70–86.
Goetz, A., Vowles, T., Tierney, S., 2009. Bridging the qualitative–quantitative divide in transport geography. The Professional Geographer 61 (3), 323–335. Goodwin, P., 1999. Transformation of transport policy in Great Britain.
Transportation Research A: Policy and Practice 33 (7/8), 655–669.
Green, DR., 1988. Distance to work in Victorian London: a case study of Henry Poole, Bespoke Tailors. Business History 30 (2), 179–194.
Grübler, A., 2004. Technology and Global Change. Cambridge University Press, Cambridge.
Hägerstrand, T., 1985. Time-geography: focus on the corporeality of man, society and environment. In: The Science and Praxis of Complexity. The United Nations University, Toyko.
Hall, D., 2010. Transport geography and new European realities: a critique. Journal of Transport Geography 18 (1), 1–13.
Hamilton, B.W., 1989. Wasteful commuting again. Journal of Political Economy 97, 1497–1504.
Hartog, R., 1999. Growth without limits: some case studies of 20th century urbanisation. International Planning Studies 4 (1), 95–130.
Hartog, R., 2005. Europe’s Aging Cities. Verlag Müller and Busmann KG. Harvey, D., 1989. The Condition of Postmodernity. Blackwell, Oxford.
House of Lords, 2010. Behaviour Change – Travel-mode Choice Interventions to Reduce Car Use in Towns and Cities. House of Lords Science and Technology Select Committee Inquiry (Chair Baroness Neuberger).
Hupkes, G., 1982. The law of constant travel times and trip rates. Futures 14 (1), 38– 46.
Jain, J., Lyons, G., 2007. The gift of travel time. Journal of Transport Geography 16 (1), 81–89.
Janelle, D., 1969. Spatial reorganisation: a model concept. Annals of the American Association of Geographers 59, 348–364.
Knowles, R., 2006. Transport shaping space: differential collapse of time–space. Journal of Transport Geography 14, 407–425.
Krugman, P., 1994. Peddling Prosperity. Norton, New York.
Lader, D., Short, S., Gershuny, J., 2006. The Time Use Survey 2005: How We Spend Our Time. Office for National Statistics, London.
Levine, R., 2006. Geography of Time: The Temporal Misadventures of a Social Psychologist or. . .. Oneworld, Oxford.
Marchetti, C., 1994. Anthropological invariants in travel behaviour. Technological Forecasting and Social Change 47 (1), 75–88.
Marshall, S., 2005. Streets and Patterns. Spon Press, London. Marshall, S., 2009. Cities. Design and Evolution. Routledge, London. Metz, D., 2008a. The Limits to Travel. Earthscan, London.
Metz, D., 2008b. The myth of travel time saving. Transport Reviews 28 (3), 321–336. Metz, D., 2010. Saturation of demand for daily travel. Transport Reviews 30 (5),
659–674.
Office of National Statistics, 2005. Population Forecasts for 2005–2010. ONS, London.
Ory, DT., Mokhtarian, P., 2009. Modeling the structural relationships among short-distance travel amounts, perceptions, affections, and desires. Transportation Research Part A 43 (1), 26–43.
Rodrigue, J-P., Comtois, C., Slack, B., 2009. The Geography of Transport Systems. Routledge, London.
Schäfer, A., 2000. Regularities in travel demand: an international perspective. Journal of Transportation and Statistics 3 (3), 1–31.
Shaw, J., Hesse, M., 2010. Transport, geography and the ‘new’ mobilities. Transactions of British Geographers 35 (3), 305–312.
Shaw, J., Knowles, R.D., Doherty, I., 2008. Introducing transport geographies. In: Knowles, R.D., Shaw, J., Doherty, I. (Eds.), Transport Geographies: Mobilities, Flows and Spaces. Blackwell, Oxford, pp. 3–9.
Southworth, M., 2003. New urbanism and the American metropolis. Built Environment 29 (3), 210–226.
Transport for London (TfL), 2009. Travel in London: Key Trends and Developments. Report 1, TfL, London.
Transportation Research Board (TRB), 2009. Driving and the Built Environment: The Effects of compact Development on Motorized Travel, Energy Use and CO2
Emissions. Transportation Research Board Special Report 298 (August). Urry, J., 2007. Mobilities. Polity, Cambridge.
Watts, L., Urry, J., 2008. Moving methods, travelling times. Environment and Planning D 26 (6), 860–874.
Woodcock, J., Banister, D., Edwards, P., Prentice, AM., Roberts, I., 2007. Energy and transport. The Lancet 370, 1078–1088.
Woodcock, J., Roberts, I., Edwards, P., Armstrong, B., Banister, D., Beevers, S., Chalabi, Z., Cohen, A., Franco, O., Haines, A., Hickman, R., Lindsey, R., Mittal, I., Mohan, D.,
Tiwari, Tonne, C., Woodward, A., 2009. Impact on public health effects of strategies to reduce greenhouse gas emissions: urban land transport. The Lancet 374 (9705), 1930–1943 (5 December).