Mestrado em Ciência dos Materiais
Dissertação para obtenção do Grau de Doutor em Nanotecnologias e Nanociências
Orientador: Doutor Rodrigo Ferrão de Paiva Martins, Professor Catedrático, Faculdade de Ciências e Tecnologia da Universidade Nova de Lisboa
Co&orientador: Doutor Pedro Viana Baptista, Professor Associado com Agregação, Faculdade de Ciências e Tecnologia da Universidade Nova de Lisboa
Doutor Hugo Águas, Professor Auxiliar, Faculdade de Ciências e Tecnologia da Universidade Nova de Lisboa
Júri:
Presidente: Doutora Ana Maria Félix Trindade Lobo, Professora Catedrática da Faculdade de Ciências e Tecnologia da Universidade Nova de Lisboa Arguentes: Doutor João Lemos Pinto, Professor Catedrático da Universidade de
Aveiro
Doutora Graça Maria Henriques Minas, Professora Associada da Escola de Engenharia da Universidade do Minho
Vogais: Doutor Rodrigo Ferrão de Paiva Martins, Professor Catedrático da Faculdade de Ciências e Tecnologia da Universidade Nova de Lisboa Doutora Elvira Maria Correia Fortunato, Professora Catedrática da Faculdade de Ciências e Tecnologia da Universidade Nova de Lisboa Doutor Adélio Miguel Magalhães Mendes, Professor Associado com Agregação da Faculdade de Engenharia da Universidade do Porto Doutor Pedro Miguel Ribeiro Viana Baptista, Professor Associado com Agregação da Faculdade de Ciências e Tecnologia da Universidade Nova de Lisboa
Doutora Maria Goreti Ferreira Sales, Professora Adjunta do Instituto Superior de
Engenharia do Porto do Instituto Politécnico do Porto
Doutor Abel González Oliva, Investigador Auxiliar do Instituto de Tecnologia Química
Design and development of a microfluidic platform for use with colorimetric gold nanoprobe assays
Copyright: Iwona Bernacka&Wojcik FCT/UNL e UNL
Acknowledgements
I am very grateful to all the people that contributed and supported me directly and indirectly during this PhD studies.
To Prof. Rodrigo Martins, for enabling me to carry a new research area within the group, for providing all necessary facilities, for possibility to present the results on international meetings and for all provided support.
To Prof. Pedro Viana Baptista, for your constructive critics, possibility to work with your truly golden DNA detection method, for showing wider aspect of the issues and for all your help.
To Prof. Hugo Águas, for the countless emails and hours of discussions and personal support.
To Prof. Elvira Fortunato for the ideas, effort to provide all needed help, time spent for papers improvement.
To co(workers that provided me their expertise in various areas: Dr. Paulo Lopes, Dr. Abel Oliva, Dr. Loic Hilliou, Dr. Sergej Filonovich, Dr. Rohan Seneedera, for all the discussions and co( operation.
To my co(workers, MSc. David Barata, MSc. Fabio Pereira, Dr. Leonardo Silva, BSc. Teresa Lobato, MSc. Pedro Urbano Alves, MSc. Ana Catarina Vaz and MSc. Iracema Martinho, for brainstorming, for your ideas, for sharing the joy of successful experiments and cheering after the worse ones.
To my co(workers from Life Science Department: MSc. Bruno Veigas, MSc. Fabio Carlos and Dr. Gonçalo Doria, for sharing with me your gold and for fruitful discussions and cooperation.
To all the members from MEON group, for the help and support that I received from you during the PhD studies, specially to MSc. António Vicente, MSc. Mafalda Costa, Dr. Daniela Gomes, Dr. Luis Pereira, Dr. Pedro Barquinha, MSc. Sonia Pereira, MSc. Alexandra Gonçalves, Dr. Rita Branquinho, Dr. Gonçalo Gonçalves, Dr. Tito Busani, Dr. Joana Vaz Pinto, MSc. Raquel Barros and Dr. Ana Pimental.
To Ricardo Fereira, Carlos Alcobia, Salomão Lopes, Manuel Quintela, for the professional help with technical tasks.
To Carla Saldanha, MSc. Paulo Manteigas, Sara Oliveira, Susana Mendes, Valéria Gomes, Patricia Carrão and Sonia Seixas, for the help with administrative issues.
I would like to thank Portuguese Science Foundation (FCT(MCTES) for financing my work through the PhD grant (SFRH/BD/44258/2008) and to “SMART(EC” project.
The PhD studies time was made enjoyable in large part due to the many friends that became a part of my life.
To Dr. Vitor Figueiredo, MSc. Jonas Deuermeier, MSc. Ricardo Correira, MSc. Kasra Kardarian, MSc. Bertrand Soulé, MSc. Paolo Sberna, MSc. Michele Pavan, MSc. Diana Gaspar, MSc. Javier Contreras, Dr. Andriy Lyubchyk and MSc. Ana Baptista, for the huge doses of humour and our open( minding meetings.
To Katarzyna Karpowicz(Osowska, Maciej Osowski Maria Osowska and Iza Stąpor, for your friendship that was really priceless during this PhD studies. You are like family to me.
I would like to take this opportunity to express my gratitude to those that make my life better and more beautiful before I started this stage of my life.
To Dominika Dyminska, Ewelina Kaczmarczyk and Katarzyna Maksymow for being my beloved soul( mates.
To people that play very special role in my life: Roksana Jamska, Anna Waksmundzka, Katarzyna Salwa, Monika Lefek, Agata Gądek, Mari Carmen Guisande, Moncho Fernàndez, Iris Fernàndez Guisande, Isabel Iglesias, Maria Montero, Ewa Heda, Joanna Winnicka(Bilska, Rafał Szymkowiak, Andrzej Kania, Wiesław Michalek, Oliwia Puczyłowska, Agata Stępień and Sebastian Jary. I am very grateful that I have met you.
To whole my wonderful family, you are so many that I have no space to name you all! For the way that you all support each other and for our fun together.
To all the Wójciks, my in(laws, for making me part of the family.
If I have forgotten anyone in the above then I am sincerely sorry, please remind me the first chance you get.
There are a few people for whom thanks seem never enough.
To my parents, Maria Bernacka and Andrzej Bernacki: Mum and Dad, you keep surprising me with the greatness of your love. I cannot find words to express my gratitude…
Ola, “my little sis”, for being my person and for your special skills in cheering me up.
Pawel, for your love, friendship and support in the difficult moments. For your passion that you put in nearly everything you do, for sharing with me your talents that make my life much more colorful and better.
Aniela, I thank you for melting my heart, for coloring my life, for your juicy kisses and re(discovering the world beauty with you. You are my Miracle!
The last, but not the least,
‘Thank You just for being
for the impossibility of grasping You with our too nervous hearts
for our doing nothing for You, but everything thanks to You’
Resumo
Devido à importância das análises de ADN, existe uma necessidade premente de desenvolver biossensores capazes de as tornar disponíveis no mercado a baixo custo, de forma a que sejam acessíveis a todos. Assim, o objectivo desta tese de Doutoramento é o de optimizar um biosensor colorimétrico de ADN com base em nanossondas de ouro partindo da tecnologia desenvolvida e existente no CEMOP.
Numa primeira fase, conseguiu'se reduzir o custo do biossensor, substituindo os fotodetectores de Si por fotodectores que utilizam TiO2 como material semicondutor (células sensitizadas por corante).
Para além disso, o novo método de microfabricação, utilizandoa tecnologia de impressão, desenvolvida para este trabalho, permitiu o aumento da área superficial do fotodetector, bem como a redução de custos na fabricação do biosensor.
Numa segunda fase procedeu'se à optimização do biosensor de ADN utilizando técnicas de microfluidica que permitiram a sua miniaturização, um menor consumo de amostras/reagentes e um aumento do desempenho e funcionalidade do sistema ao integrar diferentes componentes numa única plataforma. O percurso óptico foi estendido de forma a permitir uma leitura ao longo do microcanal, e a luz utilizada para a detecção óptica é transmitida através de fibras ópticas. Os chips de microfluidica foram fabricados em PDMS a partir de moldes em SU'8. Conseguiu'se obter estruturas com elevados rácios (~13) eparedes lisas e verticais. Os testes efectuados com nano'sondas de ouro na plataforma aqui descrita permitiram a detecção de Mycobacterium tuberculosis usando 3 8l de solução de ADN, um volume 20 vezes menor que o mencionado no último estado da arte. A plataforma bio' microfluidica foi optimizada em termos de custo, processamento de sinal eléctrico e sensibilidade à variação de cor, tendo sido verificada uma melhoria de 160% na analise colorimétrica de nano'sondas de ouro.
Numa terceira fase, foram incorporadas no chip microlentescom o objectivo de colimar a luz de saída da fibra óptica na câmara de detecção e focá'la no núcleo da fibra óptica de colecção da luz. Isto permitiu aumentar em 6 vezes a razãoentre o sinal'e o ruido do dispositivo. Esta plataforma optimizada permitiu a detecção de um polimorfismo de nucleótido único associado com o risco de obesidade (gene FTO), usando concentrações de ADN alvo abaixo do limite de detecção das microplacas de leitura convencionais (15 ng/8l) e volumes 10 vezes menores de solução (3 8l). A combinação das propriedades únicas das nanossondas de ouro com a plataforma de microfluídica resultou num sensor preciso para a detecção de nucleótidos de polimorfismo únicos usando baixos volumes de solução e sem a necessidade de funcionalizar a plataforma ou de utilizar instrumentação sofisticada.
eficiência de mistura, menor quebra de pressão e menor distância de mistura. Para Re = 0.1, obteve'se valores de 80%, 33 Pa e 2.5 mm, respectivamente, satisfazendo os requisitos para a aplicação da plataforma microfluidica em análise de ADN.
Palavras Chave: microfluidos, biosensor de ADN, PDMS, SU(8, fibras ópticas, micromixing, TiO2,
Abstract
Due to the importance and wide applications of the DNA analysis, there is a need to make genetic analysis more available and more affordable. As such, the aim of this PhD thesis is to optimize a colorimetric DNA biosensor based on gold nanoprobes developed in CEMOP by reducing its price and the needed volume of solution without compromising the device sensitivity and reliability, towards the point of care use.
Firstly, the price of the biosensor was decreased by replacing the silicon photodetector by a low cost, solution processed TiO2 photodetector. To further reduce the photodetector price, a novel fabrication
method was developed: a cost'effective inkjet printing technology that enabled to increase TiO2
surface area.
Secondly, the DNA biosensor was optimized by means of microfluidics that offer advantages of miniaturization, much lower sample/reagents consumption, enhanced system performance and functionality by integrating different components. In the developed microfluidic platform, the optical path length was extended by detecting along the channel and the light was transmitted by optical fibres enabling to guide the light very close to the analysed solution. Microfluidic chip of high aspect ratio (~13), smooth and nearly vertical sidewalls was fabricated in PDMS using a SU'8 mould for patterning. The platform coupled to the gold nanoprobe assay enabled detection of Mycobacterium tuberculosis using 3 8l on DNA solution, i.e. 20 times less than in the previous state'of'the'art. Subsequently, the bio'microfluidic platform was optimized in terms of cost, electrical signal processing and sensitivity to colour variation, yielding 160% improvement of colorimetric AuNPs analysis. Planar microlenses were incorporated to converge light into the sample and then to the output fibre core increasing 6 times the signal'to'losses ratio. The optimized platform enabled detection of single nucleotide polymorphism related with obesity risk (FTO) using target DNA concentration below the limit of detection of the conventionally used microplate reader (i.e. 15 ng/Fl) with 10 times lower solution volume (3 Fl). The combination of the unique optical properties of gold nanoprobes with microfluidic platform resulted in sensitive and accurate sensor for single nucleotide polymorphism detection operating using small volumes of solutions and without the need for substrate functionalization or sophisticated instrumentation.
Simultaneously, to enable on chip reagents mixing, a PDMS micromixer was developed and optimized for the highest efficiency, low pressure drop and short mixing length. The optimized device shows 80% of mixing efficiency at Re = 0.1 in 2.5 mm long mixer with the pressure drop of 6 Pa, satisfying requirements for the application in the microfluidic platform for DNA analysis.
Keywords: microfluidics, DNA biosensor, PDMS, SU(8, optical fibres, micromixing, TiO2
Table of contents
Chapter 1. General introduction ... 5
Summary ... 5
1.1. Biosensors ... 5
1.2. DNA biosensors based on gold nanoparticles ... 6
1.3. Microfluidic devices ... 10
1.4. Fluid behaviour at microscale ... 12
1.5. Microfluidics materials ... 14
1.5.1. Silicon and glass ... 15
1.5.2. Polymers ... 15
1.5.3. Paper ... 20
1.5.4. Materials overview ... 21
1.6. Nanofluidics ... 22
1.7. Miniaturisation of absorbance,based detection ... 25
1.8. Motivation and objectives ... 27
1.9. Thesis outline ... 28
1.10. List of publications ... 29
1.11. List of presentations ... 29
Chapter 2. Fabrication and characterisation techniques ... 37
Summary ... 37
2.1. Fabrication techniques ... 37
2.1.1. “Doctor blade” method ... 37
2.1.2. Inkjet printing ... 38
2.1.3. Spin coating ... 40
2.1.4. Photolithography... 40
2.1.5. Replica moulding soft'lithography ... 42
2.2. Chip fabrication ... 43
2.2.1. Before the SU'8 processing ... 45
2.2.2. SU'8 spin coating ... 45
2.2.3. Soft bake ... 46
2.2.4. Exposure ... 47
2.2.5. Post bake ... 54
2.2.6. Development ... 54
2.2.7. Casting of PDMS mould ... 55
2.2.8. Casting of epoxy mould ... 56
2.2.9. Casting of PDMS chips ... 56
2.2.10. Sealing of PDMS chips ... 57
2.3.2. Spectrophotometry ... 62
2.3.3. Stylus profilometry ... 64
2.3.4. Determination of features’ thickness using optical microscopy ... 65
2.3.5. Confocal scanning microscopy ... 66
Chapter 3. Inkjet printed and “doctor blade” TiO2 photodetectors for DNA biosensors ... 71
Summary ... 71
3.1. Introduction ... 71
3.2. Experimental section ... 74
3.2.1. Fabrication of photodetectors ... 74
3.2.2. Characterisation of photodetectors ... 77
3.2.3. Preparation of DNA'functionalized gold nanoparticles ... 77
3.2.4. Detection procedure ... 77
3.3. Results and discussion ... 78
3.3.1. Photodetectors’ fabrication and characterisation ... 78
3.3.2. Colorimetric AuNPs analysis... 80
3.3.3. Detection of DNA from M. tuberculosis ... 81
3.3.4. Optimization of inkjet printed TiO2 photodetector ... 82
3.4. Conclusions ... 87
Chapter 4. Bio,microfluidic platform for gold nanoprobe based DNA detection— application to ... 93
Summary ... 93
4.1. Introduction ... 93
4.2. Experimental details ... 99
4.2.1. Fabrication of macro'machined PDMS containers ... 99
4.2.2. Fabrication of microfluidic chip ... 99
4.2.3. Opto'electronic set'up ... 100
4.2.4. Sample DNA preparation ... 101
4.2.5. Au'nanoprobe synthesis and characterisation ... 102
4.2.6. Au'nanoprobe colorimetric assay ... 102
4.2.7. Detection procedure and analysis ... 103
4.3. Results and discussion ... 103
4.3.1. Development of macro'machined PDMS containers ... 103
4.3.2. Microfluidic chip development ... 108
4.3.3. Optical performance ... 113
4.3.4. M. tuberculosis detection via the microfluidic platform ... 115
4.4. Conclusions ... 118
Summary ... 125
5.1. Introduction ... 125
5.2. Experimental details ... 127
5.2.1. Fabrication of microfluidic chip ... 127
5.2.2. Opto'electronic set'up ... 128
5.2.3. Sample DNA preparation ... 129
5.2.4. Au'nanoprobe synthesis and characterisation ... 129
5.2.5. Au'nanoprobe colorimetric assay ... 129
5.2.6. Detection procedure and analysis ... 130
5.3. Results and discussion ... 130
5.3.1. Set'up optimization ... 130
5.3.2. Microlenses design and fabrication ... 132
5.3.3. Effect of microlenses on colorimetric AuNPs analysis ... 137
5.3.4. SNP detection using the optimized system ... 139
5.4. Conclusions ... 144
Chapter 6. Experimental optimization of a passive planar rhombic micromixer with obstacles for effective mixing in a short channel length ... 149
Summary ... 149
6.1. Introduction ... 149
6.2. Experimental details ... 153
6.2.1. Fabrication of microfluidic device ... 153
6.2.2. Assessment of mixing efficiency ... 154
6.2.3. Pressure drop measurements ... 155
6.2.4. Statistical analysis ... 155
6.3. Results and discussion ... 156
6.3.1. Mixer design and fabrication ... 156
6.3.2. Mixing efficiency and mechanism ... 158
6.3.3. Pressure drop ... 162
6.3.4. Statistical analysis of the results ... 165
6.4. Conclusions ... 171
Chapter 7. General conclusions ... 177
Summary ... 177
7.1. Conclusions ... 177
7.2. Future work ... 179
7.2.1. Integration of microfluidic waveguides to facilitate the chip exchange ... 179
7.2.2. Integration of the optical detection chip with the micromixer ... 180
7.2.3. Miniaturization of further laboratory tasks towards “bleed and read” device ... 180
List of Figures
Fig. 1.1. Schematic representation of biosensor principle: specific interaction of bioreceptor with analyte results in physical or chemical change analysed by transducer and then converted into measurable signal. Adapted from (Martins et al. 2013). ... 6 Fig. 1.2. Colours of gold nanoparticle solutions; corresponding absorption spectra and transmission
electron micrographs showing their inter'particles distance: (A) monodispersed AuNPs solution and (B) aggregated AuNPs solution. Adapted from (Schofield et al. 2007). ... 7 Fig. 1.3. Principle of colorimetric DNA detection method based on non'cross'linking hybridisation of
Au'nanoprobe at high salt concentration (Baptista et al. 2005). After salt addition, only the presence of complementary DNA target prevents the Au'nanoprobe aggregation remaining the red colour of the solution. ... 8 Fig. 1.4. (A) Colour wheel presenting the relationship between a colour of object and its absorption of
light. (B) Schematic representation of biosensor used for detection of colorimetric changes of DNA solution. The light from green LED is transmitted through the solution and then is detected by photodetector. The light allowed through the solution reaches the sensor that generates a photocurrent. ... 9 Fig. 1.5. Portable, integrated biosensor for colorimetric DNA detection based on non'cross'linking
aggregation of Au'nanoprobes. The light from RBGA LED is transmitted through the solution and then is detected by amorphous/nanocrystalline silicon photodetector generating photocurrent. The analog signal is filtered, amplified, converted to a digital signal and transmitted to a computer via a serial communication protocol. Adapted from (Silva et al. 2011). ... 10 Fig. 1.6. Lab'on'chip concept: scaling down of several laboratory processes on a chip'format
(http://Lab'on'Chip.gene'quantification.info retrieved in 2014.03). ... 11 Fig. 1.7. Evolution of the number of (A) publications and (B) citations in the microfluidics field
indexed within Web of Science Core Collections from 2004 to 2013 (query: ‘microfluidics’). The number of publications increases linearly with time, while the citations’ number—exponentially.12 Fig. 1.8. (A) Reynolds’ sketch of his 1883 experiment that allowed observation and explanation of
various flow regimes: a dye'coloured water was injected with various velocities into clear water. (B) Laminar flow: smooth, ordered with constant fluid velocity.(C) Transitional flow: intermittent pulses of turbulence. (D) Turbulent flow: disorganised with with the formation of eddy current. Retrieved from (Reynolds 1883). ... 13 Fig. 1.9. Market share of materials used in microfluidic devices field in 2010 (retrieved from (Yole
applications involving more aggressive chemicals, silicon, metal and ceramics are more commonly used. ... 15 Fig. 1.10. PDMS cross'linking: linear vinyl ended PDMS polymers react with curing agent in the
presence of platinum catalyser forming a cross'linked network (Esteves et al. 2009). ... 17 Fig. 1.11. (A) Chemical structure of compounds of SU'8 photoresist: SU'8 epoxy resin molecule;
cyclopentanone—solvent used in SU'8 series 2000 (in conventional SU'8 series, gamma' butyrolacton is used) and photoiniciator: triarylium'sulfonium salt. Eight reactive epoxy functionalities allow a high degree of cross'linking after photoactivation. (B) Chemical reaction for photoacid generation upon UV exposure. The generated acid acts as a catalyst in the cross'linking of the epoxy molecules. Adapted from (Al'Mumen et al. 2013). ... 19 Fig. 1.12. The most promising materials for microfluidic chip fabrication and comparison of the
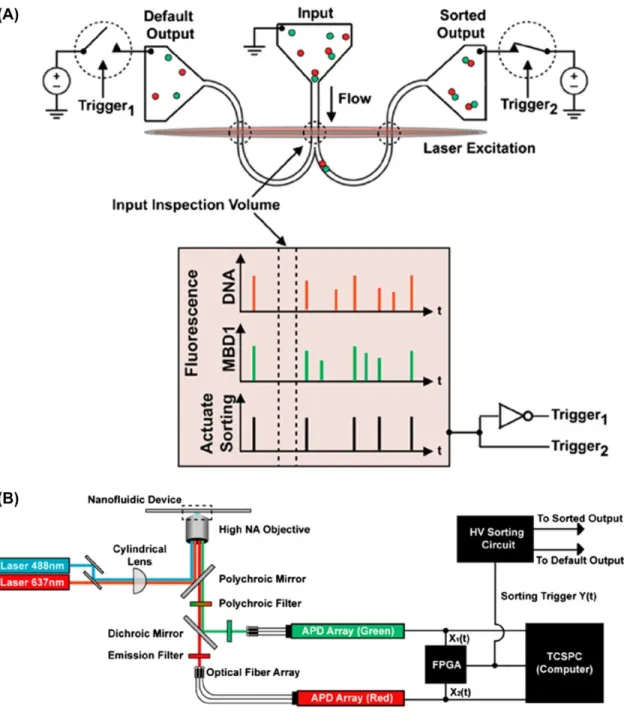
resulting devices’ cost. Retrieved from (Ren et al. 2013). Thermosets, inorganic materials and hydrogels have properties suitable for the research level use, while paper may constitute the most spread material in commercial microfluidics. ... 21 Fig. 1.13. (A) Principle of the single DNA molecule detection and sorting. As each fluorescently
labelled molecule passed through the input inspection volume its fluorescence signature was detected, evaluated in real time and used to actuate a sorting trigger to electrically direct the flow towards the sorted output. (B) Nanofluidic platform: nanofluidic device was mounted onto a confocal fluorescence microscope and illuminated by two overlapped lasers to excite molecule fluorescence simultaneously. Single molecule fluorescence was imaged using an optical fibre array connected to single photon counting avalanche photodiodes (APDs). Real'time fluorescence analysis at the input inspection volume was performed and used to trigger a high voltage (HV) sorting circuit to direct the electrokinetic flow of a molecule to the sorted or default output. Adapted from (Cipriany et al. 2012). ... 24 Fig. 1.14. Photograph of the lab'on'chip for absorbance measurements with integrated microfluidic
dye laser, waveguides, microchannels and photodiodes. All the optical and fluidic components were fabricated in SU'8, while planar c'Si n'type diodes are embedded in a c'Si p'type substrate. This device proves the feasibility of fully'integrated lab'on'chip for absorbance measurements, however its cost is relatively high due to use of c'Si and SU'8 as structural material. Retrieved from (Balslev et al. 2006). ... 26 Fig. 2.1. Principle of “doctor blade” method: suspension of ceramic particles (e.g. TiO2) with
Fig. 2.2. Main characteristics, requirements, possibilities and challenges of the inkjet printing technology. Retrieved from (Teichler et al. 2012). ... 39 Fig. 2.3. Photographs of inkjet printers used in this work: (A) desktop printed (Canon PIXMA
IP4500) used for fabrication of the TiO2 photodetector prototype and (B) lab'scale printer (LP50
PixDRO) used in the TiO2 optimization. ... 39
Fig. 2.4. (A) Schematic representation of spin coating process: the sample is rotated at high speed spreading the material and forming thin film layer. (B) The thickness distribution of spin coated layer showing the edge bead formed along wafer borders. Retrieved from (Nima 2013). ... 40 Fig. 2.5. Principle of the photolithography process: irradiation through a mask a photosensitive resist
layer. The irradiation initiates physico'chemical reactions in the polymer, which enable selective removal of resist in the development. In positive resists, the exposed areas become more soluble in the developer, and in negative resists, the exposed parts become insoluble (http://www.objactive.com/metaldeposition retrieved in 2014.03). ... 41 Fig. 2.6. (A) Mask aligner MA6 used for the SU'8 photolithography: the sample is placed on the
substrate chuck, while the mask is placed in the mask holder and i'line filter is inserted into the UV400 optics to cut off radiation below 365 nm. After alignment process, the sample is UV exposed. (B) Layout of the photolithographic mask used for micromixers fabrication: dark mask regions define SU'8 regions that are dissolved in the developer. ... 42 Fig. 2.7. Photographs of fabrication of PDMS microfluidic chip by replica moulding technique. A
liquid mixture of PDMS pre'polymer and curing agent is poured on top of the SU'8 master and then cured. After cross'linking, the replica is peeled off the mould. ... 43 Fig. 2.8. Schematic representation of the SU'8 master fabrication: after SU'8 spin coating, the
samples are soft'baked to evaporate solvent and then UV irradiated to initiate the cross'linking process that is thermally accelerated during the post bake. The unexposed SU'8 regions are removed in the developer bath and on the end, the samples are isopropanol rinsed and dried (http://www.elveflow.com/microfluidic'reviews'and'tutorials/su'8'baking retrieved in 2014.03). 44 Fig. 2.9. (A) SU'8 2050 dispensed on a substrate prior to spin coating process. (B) Film thickness as a
function of spin speed at ambient temperature of 21 °C (http://www.microchem.com retrieved in 2014.03). To obtain a desired spin speed, the values suggested in the manufacturer datasheet should be experimentally optimized. ... 46 Fig. 2.10. (A) Transmission spectrum of 1 mm thick unexposed SU'8 (Gersteltec's courtesy); (B)
whole SU'8 layer, a filter should be used to eliminate the light of wavelength below 350 nm emitted by the UV400 optics. Adapted from the mask aligner and filter datasheets. ... 48 Fig. 2.11. Scanning electron micrographs of SU'8 features (20 Fmhigh on glass substrates): top view
of samples exposed (A) without filer (7 s) and (B) with i'line filter (18 s) and cross'section of SU' 8 channel exposed (C) without filter indicating the negative side walls and (D) through the i'line filter indicating nearly vertical side walls (89 degrees). ... 49 Fig. 2.12. The microscopic images of SU'8 microchannels cross section (20 × 20 Fm2 on silicon
wafer) fabricated using chromium mask: (A) 100× magnification and (B) 200× magnification. The microchannels were fabricated on silicon wafers exposing through the i'line filter. The use of the high resolution and high contrast mask enabled to eliminate the irregularities on the channels bottom visible in Fig. 2.11 and Table 2.1. ... 51 Fig. 2.13. SEM images of ~125 Fm high SU'8 features fabricated with exposure dose of 309 mJ/cm2 on silicon wafer: (A) top view indicating good features definition; (B) profile indicating smooth and nearly vertical side walls (87.8 degrees) and (C) zoom on the interface SU'8 / wafer indicating good adhesion. ... 54 Fig. 2.14. The process of the chip microfabrication: the moulding process starts with the fabrication of
the SU'8 master mould (A), then instead of casting PDMS repeatedly from this mould, PDMS is casted once (B) and used as mould for the patterning of an epoxy mould (C), which can then be used to produce many PDMS replicas (D) without suffering delamination problems. ... 57 Fig. 2.15. (A) Schematic illustration of sealing of PDMS chips. The reversible sealing can be obtained
basing on PDMS elasticity, while proper PDMS oxidation enables its irreversible sealing: generated highly active oxygen species remove the methyl groups from the PDMS surface forming polar silanol groups. When plasma treated surfaces are brought into contact, the condensation reaction occurs forming covalent bonds between those surfaces, sealing them irreversibly. Adapted from (Sun and Rogers 2007). (B) Photograph showing the strength of the PDMS sealing based on the oxidation process: it is easier to break PDMS than separate it from glass. ... 59 Fig. 2.16. Acquisition of solution spectra by miniature fibre optic spectrometer integrated with
microfluidic chip. (A) The automatic measurement mode (absorbance wizard) was used to determine the optimum integration time. (B) Spectra were acquired using a manual measurement mode to enable more freedom during tests. After the dark and light reference spectra were stored in the intensity mode, the solvent and sample absorption spectra were acquired. ... 63 Fig. 2.17. Characterisation of the SU'8 feature by stylus profilometry. For such high thickness range
Fig. 2.18. Determination of features’ thickness using optical microscopy: PDMS slab was immobilized perpendicularly under microscope using a bigger block of PDMS and the feature height and sidewall angle were measured. ... 66 Fig. 3.1. (A) Working principle of dye sensitized photodetector/solar cell: 1. dye photo'oxidation; 2.
injection of the exited electron to the semiconductor conduction band; 3. percolation of the electron through porous semiconductor layer towards transparent conductive oxide layer and to counter electrode through external load; 4. injection of electron to a redox system of electrolyte; 5. reduction of the dye to its original state by the electrolyte (http://www.solaronix.com/technology/dyesolarcells retrieved in 2014.03). (B) Photograph of dye sensitized solar cells module fabricated using sensitizing dyes of various colours (http://www.solarisnano.com retrieved in 2014.03). ... 73 Fig. 3.2. Schematic of the TiO2 photodetector fabrication by “doctor blade” and inkjet printing
technique. The scanning electron micrograph presented the surface morphology of the TiO2 film
prepared by inkjet printing technology after sintering at 450 °C. The film is about 4 8m thick, no cracks on the surface are observed which indicates a very high inter'particle connectivity. The average diameter of TiO2 particles is 25 nm. ... 76
Fig. 3.3. Incident photon to current conversion efficiency (IPCE) of the photodetector obtained by “doctor blade” method (DBP) and by inkjet printing (IPP). The TiO2 layer of DBP is about 1.75
times thicker than in the case of the IPP, which may explain the observed difference at the IPCE. Inset: Absorption spectrum of the ethanol solution of Ruthenium N3 dye... 79 Fig. 3.4. Responses of the sensor with (A) “doctor blade” photodetector and (B) inkjet printed
photodetector for different AuNP concentrations. Non–aggregated (red squares) and aggregated by salt addition (blue circles). The detection response (Rdet)—difference in the photocurrent densities
generated by photodetector when illuminating through the reference solution and through the sample solution. Measurements using a high power LED with 530 nm and 35 nm spectral half' width. Inset: Corresponding spectrophotometric measurements: absorption peak area integral from 520 to 540 nm as a function of AuNP concentration. Standard deviation bars were determined from 6 independent measurements. ... 81 Fig. 3.5. (A) Schematic representation of DNA detection of the developed biosensor (Wi—the photon
flux and Rdet—detection responses. (B) The Au'nanoprobe based assays for M. tuberculosis DNA
with the novel sensors with DBP and IPP: POS—complementary DNA target; NEG—non' complementary DNA target; Rdet—difference in the photocurrent densities generated by
allow better colour change visualization. DNA detection was carried out with the appropriate oligonucleotide target at a final concentration of 1.33 FM and Au'nanoprobes at a final concentration of 2.5 nM. Standard deviation bars were determined from 6 independent measurements... 82 Fig. 3.6. Profiles and optical micrographs of TiO2 layers of various thicknesses fabricated using the
Solaronix paste by (A) “doctor blade” and (B) inkjet printing technique with sintering ramp of 10 °C/min and (C) 50 °C/min. During the inkjet printing process, the stage was heated to 70 °C. The TiO2 films that resulted in functioning devices were labelled in green, while the malfunctioning—
in red. ... 84 Fig. 3.7. SEM images of TiO2 films fabricated using the Solaronix paste by (A) “doctor blade” (3.4
8m thick) and (B) inkjet printing technique (1.6 8m thick) with sintering ramp of 10 °C/min. The higher porosity of the inkjet printed TiO2 films is most probably caused by the solvent evaporation
during the droplet fly from the nozzle to the substrate that is additionally enhanced by the applied heating of printing stage (70 °C). ... 85 Fig. 3.8. Energy conversion efficiency of photodetectors incorporating TiO2 films fabricated using the
Solaronix paste by (A) “doctor blade” and (B) inkjet printing technique (the connecting lines are for eyes guidance only). ... 87 Fig. 4.1. (A) Schematic representation of the DNA detection method based on non'cross'linking DNA
hybridisation of Au'nanoprobes. (B) Diagram of the developed microfluidic platform. Solution to be analysed is dispensed into the inlet well and injected to the channel by the withdrawing from the outlet using a syringe pump. Optical fibres guide the light from the LEDs to the microfluidic detection channel and then to the photodiode. The bulk part of the PDMS is not shown to not darken the image. ... 95 Fig. 4.2. Absorption spectra of disperse and aggregated MTBC Au'nanoprobes solution (2.5 nM Au' nanoprobe in 10 mM phosphate buffer (pH 8)) attained via standard 384 well micro'plate. The aggregation was induced by salt addition [MgCl2] = 0.04 M. Spectra values are normalised, i.e.
spectrum of aggregated solution was shifted for the same absorbance value at λ = 400 nm as disperse solution. The dashed lines correspond to the dominant wavelengths [530 nm (green) and 625 nm (red)] of the LEDs used in the detection and for determination of RS ratio. ... 96
Fig. 4.4. Circuit diagram used for optical'to'electrical signal conversion and amplification. The electrical signal from the photodiode was provided to the input of operation amplifier circuit with a feedback loop resistance of 20 M` and supplied by ± 15 V. ... 101 Fig. 4.5. Portable, integrated colorimetric DNA biosensor with chip carrier for insertion of
photodetector and macro'machined PDMS containers. The light from RBG LED is transmitted vertically through the solution placed in PDMS container and afterwards is detected by photodetector placed underneath the container. The photocurrent generated by photodetector is filtered, amplified, converted to a digital signal and transmitted to a computer via a serial communication protocol. Adapted from (Silva 2010). ... 104 Fig. 4.6. Design of (A) the macro'machined polyacetal mould and (B) the resulting PDMS containers
to be used in the colorimetric DNA biosensor. ... 105 Fig. 4.7. Absorption spectra of dispersed and aggregated AuNPs (~2.5 nM) in various containers.
Reference: air in the water spectrum and respective container filled with water for AuNPs spectra. ... 107 Fig. 4.8. Absorption spectra of the Au'nanoprobe assay for M. tuberculosis detection in the macro' machined PDMS container (optical path: 2 mm, volume of the solution: 50 8l): probe; blank (without DNA), POS—complementary DNA target; NEG—non'complementary DNA target. The spectra were taken 30 min after salt addition using a container filled with phosphate buffer (pH 8, 10 mM) as a reference. [Au'nanoprobe] = 2.5 nM; [MgCl2] = 0.04 M; [oligonucleotide target] =
1.33 FM. ... 108 Fig. 4.9. SEM characterisation of microfluidic chip. SEM images showing: (A) side wall angle of the
SU'8 feature (achieved aspect ratio: 12) and (B) microchannel in PDMS patterned by the SU'8 mould. Perfectly flat and smooth walls are clearly visualised. ... 109 Fig. 4.10. (A) Profilometer measurement of a SU'8 mould feature with 126 8m of height. (B) Optical
specular transmittance of PDMS slabs of various thicknesses. ... 110 Fig. 4.11. Fabrication process. Microscopic images of top views and cross sections of the test features
fabricated in each fabrication step (scale bar length: 100 Fm). The smallest feature is 10 Fm wide with aspect ratio of 12. ... 111 Fig. 4.12. Fabrication process. Confocal scanning microscope images, showing the definition obtained
alignment with each other and with the detection channel. The funnel shape of the entrance facilitates the insertion and reduces probability of fibre breaking. ... 113 Fig. 4.14. Optical sensing with the microfluidic platform. (A) Output voltage generated by the
platform for the chip of 2 mm long microchannel filled with water as a function of LEDs current; (B) sensitivity of the developed microfluidic platform defined as a difference between the detection responses (calculated from equation (4.1)) for the non'aggregated and aggregated AuNPs solutions. The tests were done for various optical path lengths (OPL) with LEDs powered with 300 mA and 920 mA. The data points represent the average of three readout measurements and the error bars indicate the standard deviation (the connecting lines are for eyes guidance only)... 114 Fig. 4.15. (A) Estimation of the beam width at the end of the chamber containing the microfluidic
channel of a length of 0.5 mm. This estimation is intended for power loss evaluation. (B) Percentage of available power reaching the collecting optical fibre as a function of the optical path length in the developed microfluidic chips (for NA = 0.275 and n = 1.33). ... 114 Fig. 4.16. M. tuberculosis detection via proposed bio'microfluidic platform. Au'nanoprobe assay
mixtures (2.5 nM Au'nanoprobe 30 ng/Fl of sample DNA in 10 mM phosphate buffer (pH 8)) after 15 min of incubation following salt addition [MgCl2] = 0.04 M. Results obtained using: (A) PDMS
microfluidic platform with LEDs powered with 300 mA and (B) with 920 mA (see eq. 4.1). The bars represent the average of independent measurements and the error bars indicate standard deviation. The horizontal line represents the threshold of 1 considered for discrimination between positive and negative. Statistical analysis was performed using Prism 5 graph pad, using one'way ANOVA with Tukey's Multiple Comparison test; ***=p<0.0001, n ≥ 5. ... 116 Fig. 4.17. Microplate reader results of Au'nanoprobe assay for MTBC detection: MTBC standard
assay performed in a microplate reader. Au'nanoprobe aggregation as measured by ratio of aggregation for the assay mixtures [2.5 nM Au'nanoprobe, 10 Fg/ml of sample DNA in 10 mM phosphate buffer (pH 8)] after 15 min of incubation following salt addition [MgCl2] = 0.04 M. The
bars represent the average of independent measurements and the error bars indicate standard deviation. The horizontal line represents the threshold of 1 considered for discrimination between positive and negative. Statistical analysis was performed using Prism 5 graph pad, using one'way ANOVA with Tukey's Multiple Comparison test; ***=p<0.0001, n ≥ 5. ... 117 Fig. 4.18. The detection response (Rs; eq. 4.1) as a function of the gold nanoparticles concentration.
The detection response increases linearly with AuNPs concentration (adjusted R'square coefficient = 0.95937). The measurements were taken with the LEDs powered with 400 mA. ... 118 Fig. 5.1. Principle of colorimetric DNA detection method based on non'cross'linking hybridisation of
Fig. 5.2. (A) Emission spectra of SMD LEDs used for the colorimetric analysis. The spectra were acquired using miniature fiber optic spectrophotometer (Ocean Optics USB4000) integrated with an empty microfluidic chip (integration time: 8 ms; LEDs supplied with 0.4 A). (B) Circuit diagram used for optical'to'electrical signal conversion and amplification. ... 128 Fig. 5.3. 2D schema of light propagation in PDMS chip of 2 mm long optical path: (A) uncollimated;
(B) with input and output air lenses and (C) with PDMS input lens and output air lenses (to scale). ... 133 Fig. 5.4. (A) 3D schema of light propagation in chip of 2 mm long optical path without lenses and (B)
with 2D air microlenses (the schema is drawn to scale; only the light propagation in the plane of the channel is considered as the light in vertical direction remains diverged). (C) Top view microscopic images of channel filled with water illuminated by green LED (0.9 A) in chip without lenses and (D) with 2D air microlenses. ... 135 Fig. 5.5. Scanning electron micrographs of the PDMS chip: (A) main chip features; (B) input air
microlens; (C) input PDMS microlens and (D) output air lenses. The images B – D were taken with the stage 20 degrees tilted to visualize better the aspect ratio. ... 136 Fig. 5.6. Confocal microscope images of fabricated 2D microlenses: (A) input air lens; (B) input
PDMS lens and (C) output air lenses. ... 136 Fig. 5.7. (A) The detection response (Rs, eq. (5.1)) of the microfluidic platform for dispersed (in red)
and aggregated (in blue) AuNPs solutions using microfluidics chips without lenses (before and after system optimization described in section 3.1), with air microlenses and with PDMS microlenses (LEDs powered with 0.4 A). The horizontal dashed line represents the threshold of 1 considered for discrimination between red and blue colour solutions. (B) The propagation of the signal'to'loss ratio along the channel in chip without lenses and chip with the air microlenses based on the analysis of the pixels intensity in Fig. 5.4C and D. ... 138 Fig. 5.8. Absorption spectra acquired using miniature fibre optic spectrophotometer integrated with a
microfluidic chip (‘chip’; 3 Fl; 2 mm long optical path; integration time: 610 ms) and using conventional microplate reader (30 Fl; 10 mm long optical path). (A) Spectra of the dispersed and aggregated AuNPs (3 min after salt addition). (B) Spectra of the Au'nanoprobe assay for the FTO single nucleotide polymorphism detection: blank (without DNA), positive (POS) and negative (NEG) assay (30 ng/Fl of target DNA). The spectra were taken 30 min after salt addition. The absorption spectra of blank, POS and NEG were shifted for the same absorbance value at λ = 400 nm as probe, so as to allow better visualisation. ... 139 Fig. 5.9. Transmission spectra of green and red LEDs acquired using miniature fiber optic
nanoprobe and blank (8 min; 15 min and 30 min after salt addition; the samples were injected into the channel directly after salt addition). LEDs powered with 0.4 A; reference: empty chip; integration time: 8 ms. ... 141 Fig. 5.10. Results of the colorimetric DNA detection (eq. 5.1) of the FTO single nucleotide
polymorphism using Au'nanoprobes and the optimized bio'microfluidic platform with chip with air lenses using 3 Fl of solution with 15 and 30 ng/Fl of target DNA. The horizontal dashed line represents the threshold of 1 considered for discrimination between positive and negative. ... 142 Fig. 5.11. Microscopic images of chip with air microlenses illuminated by halogen lamp taken in dark
conditions using Stereo Microscope and Pentax K100 camera with long exposure time (30 s). (A) AuNPs 10 to 60 min after salt addition (the solutions were injected into the channel directly after salt addition). (B) The positive and negative colorimetric Au'nanoprobe assays for FTO single mismatch detection (target DNA concentration: 30 ng/Fl) taken 30; 40 and 50 min after salt addition (the solutions were injected to the channel 26 min after salt addition). ... 143 Fig. 6.1(A) Schematic diagram of the designed rhombic micromixer with stepped diamond'shaped
obstacles and rectangular contractions between rhombi. (B) PDMS micromixer fabricated using SU'8 mould and epoxy mediating mould. (C) Optical microscopy images taken at different locations along a micromixer with wt = 100 Fm and d = 140 Fm at Re = 8.2. Mixing efficiency was
analysed along the channel in the middle of the first contraction, M(1), second contraction, M(2) and third contraction, M(3), as indicated by the vertical dotted lines. ... 158 Fig. 6.2. Optical microscopy images taken at the first contraction for various flow conditions. (A)
Influence of the contraction width (wt) on fluid mixing at Re = 1.2; Re = 5.9 and Re = 88.2, in
mixers with inter'obstacles distance d = 140 Fm. At lower wt and higher Re, strong acceleration
and subsequent deceleration of flows leads to formation of vortices. (B) Comparison of vortices generated at Re = 28.4; Re = 58.8 and Re = 117.6 in mixer with wt = 100 8m. (C) Influence of the
inter'obstacles distance (d varying from 60 8m to 140 8m) for micromixers with wt = 400 8m at
Re = 5.9. For d = 60 8m, the fluids flow mainly next to the channel walls due to low inter' obstacles channel width. ... 161 Fig. 6.3. Experimental mixing efficiency (M; given in %) of mixers with various configurations at the
middle of the first contraction (M(1); red line), second contraction (M(2); blue line) and third contraction (M(3); green line). Data points labelled a and b were determined from two different images taken from the first chip, while data points labelled c and d were determined from two different images taken from the second chip. Connecting lines are for eye guidance only. ... 162 Fig. 6.4(A) Shear rate dependence of the shear viscosity computed from the pressure drop (dP) and
the volumetric flow rate (Q) measured with chip of wt = 100 Fm; d = 60 Fm for two values of the
indicates the viscosity (8 × 10'3 Pa × s) of water at 28 ºC measured with a rotational rheometer. Inset: stress dependence of the apparent shear rate. The red line is a linear fit to the data with slope of 1.08 ± 0.07 indicating a Newtonian behavior. (B) Experimental pressure drop (dP) for micromixers of various configurations (wt and d are given in 8m). (C) Zoom in on the low Re
region. For low dP values (usually below 12), there is no linear dependence between dP and Re due to the detection limit of the pressure sensor. ... 164 Fig. 6.5. Results obtained from mathematical fitting to the experimental data points (A) of mixing
efficiency (given in %) measured at the middle of the first contraction (M(1)); (B) at the second contraction (M(2)); (C) at the third contraction (M(3)) and (D) of pressure drop (dP; given in kPa) measured after three rhombi. (E) Desirability results (Dn) defined as maximum values of M(1);
M(2) and M(3) and minimum of dP. ... 169 Fig. 7.1. Schematic representation of fabrication of the PDMS waveguides based on a capillary filling
technique. The channels patterned in the cladding material can be capillary filled with the core material pre'polymer that is cured afterwards, forming solid state, stretchable waveguides. Adapted from (Missinne et al. 2014). ... 180 Fig. 7.2. Layout proposal of a lab'on'chip device for colorimetric DNA detection starting from
List of Tables
Table 1.1. Main characteristics of the most used materials for microfluidic chip fabrication. Based on (Becker and Gärtner 2008; Ren et al. 2013). ... 22 Table 2.1. The scanning electron micrographs of microchannels (20 × 20 Fm2 ) fabricated in SU'8 on
glass or silicon wafer exposed through the i'line filter for 18 s. Various post'development treatments were applied to eliminate the irregularities of bottom part of channels. ... 50 Table 2.2. Microscopic images of 140 Fm thick SU'8 layer fabricated using various exposure doses
on silicon wafers. The exposure dose of 330 mJ/cm2 gives a higher aspect ratio and more homogenous SU'8 structure. ... 53 Table 2.3. Minimum size of features and channel for various exposure doses based on scale bar results
presented on Table 2.2. ... 53 Table 2.4. Characterisation techniques used in this PhD work. ... 61 Table 4.1. Dimensions of developed PDMS containers (*total volume of container = volume of
cylinder + volume of inlet and outlet). ... 105 Table 5.1. Main characteristics of the operational amplifiers used in various system optimization
stages. ... 132 Table 5.2. The curvatures (R), distances (d) and the characteristics of the resulting light beam (y and
θ) for the input bi'concave air microlens and the input bi'convex PDMS microlens. ... 133 Table 5.3. The curvatures (R), distances (d) and the characteristics of the resulting light beam (y and
θ) for the output bi'concave and bi'convex air microlens. ... 134 Table 6.1. Summary of planar passive micromixer designs with respective performance reported in
the literature (*data obtained through simulations). ... 151 Table 6.2. Summary of data sieving and corresponding model validation parameters based on least
square regression. N is the number of observations. ... 166 Table 7.1. Comparison of the biosensor performance along the optimization process. The normalized
colorimetric discrimination, i.e. jRs(normalized), was defined as the AuNPs colorimetric
List of symbols, acronyms and abbreviations
ANOVA ' analysis of variance
AuNPs ' gold nanoparticles
c'Si ' crystalline silicon
D ' inter'obstacles distance
D ' diffusion coefficient
DBP ' “doctor blade” photodetector
DNA ' deoxyribonucleic acid
dP ' pressure drop
FTO ' fluorine doped tin oxide
h ' channel height
I ' pixel intensity
ITO ' indium tin oxide
IPP ' inkjet printed photodetector
kB ' Boltzmann’s constant
l ' characteristic dimension
L ' length
LED ' light emitting diode
LOC ' lab'on'chip
M ' mixing efficiency (1, i.e. 100%, for perfectly mixed streams)
OPL ' optical path length
PCI ' Peripheral Component Interconnect
PCR ' polymerase chain reaction
PDMS ' polydimethylosiloxane
Pe ' Peclet number
POC ' point of care
Q ' volumetric flow (m3/s)
Re ' Reynolds number
SEM ' scanning electron microscopy
t ' time
TCO ' transparent conductive oxide
UV ' ultra violet electromagnetic radiation (300 – 400 nm)
v ' velocity
vis ' visible electromagnetic radiation (400 – 765 nm)
wc ' channel width
wt ' width of the contraction between rhombi
x ' mean distance that a molecule diffuses in time t ' mixing index (0 for perfectly mixed streams)
T ' fluid viscosity
To ' viscosity of the dyed water
8FLs ' microfluidics
8TAS ' micro total analysis systems ' density of water
<I> ' average greyscale intensity of all pixels in image
2D ' two'dimensional structure
Chapter 1
Chapter 1. General introduction ... 5
Chapter 1. General introduction
Summary
This chapter includes fundamental background related with biosensors, DNA detection and microfluidics and short state'of'the'art of microfluidic devices for absorbance'based detection giving the broader view for to the introduction sections given in each results chapter. The motivation of the chosen scope and research objectives are also provided stating the relationship among the presented articles. On the end of this chapter, the thesis structure is described.
1.1. Biosensors
Fig. 1.1. Schematic representation of biosensor principle: specific interaction of bioreceptor with analyte results in physical or chemical change analysed by transducer and then converted into measurable signal. Adapted from (Martins et al. 2013).
One of the fastest growing segment of worldwide diagnostics market is point of care (POC) analysis (Ehrmeyer and Laessig 2007), i.e. ‘tests designed to be used at or near the site where the patient is located, that do not require permanent dedicated space, and that are performed outside the physical facilities of the clinical laboratories’ as defined by College of American Pathologists (www.cap.org). POC tests may make biological analysis widely available and provide opportunities for better screening of at'risk patients and better monitoring of treatment, saving lives and costs. Many diseases are largely treatable with drug therapy, however the main issue is lack of available diagnostic tests (Soper et al. 2006). For POC tests, extensive cleaning is not acceptable, so disposable devices are favoured by the end user. On the other hand, disposing of all biosensor components would make these devices too costly to be used as point of care. Therefore, POC biosensor systems tend to be divided into disposable chips or cartridges and a non'disposable host device (or instrument) (Adams et al. 2003).
1.2. DNA biosensors based on gold nanoparticles
Due to localized surface plasmon resonance (LSPR, i.e. the collective resonant oscillation of conduction electrons at the surface of a metal nanoparticle under the perturbation of incident light), the colour of AuNPs solution is dependent on the nanoparticles’ size, shape, optical properties of surrounding media and inter'particle distance (Doria et al. 2012; Veigas 2012). In the latter case, when individual spherical AuNPs come into close proximity (i.e. the center'to'center distance smaller than 2.5 times of the AuNP diameter), the surface plasmon of individual AuNPs combines (inter' particle plasmon coupling), which results in the change of solution colour from red to blue (Fig. 1.2). The colour difference is a macroscopic response which derives from phenomenon occurring at a nanometer scale. Although silver nanoparticles exhibit sharper and stronger SPR bands, AuNPs are much more popular for biological applications due to their inert nature, biocompatibility and easy functionalization with biomolecules though thiol bond (Petryayeva and Krull 2011).
Fig. 1.2. Colours of gold nanoparticle solutions; corresponding absorption spectra and transmission electron micrographs showing their inter'particles distance: (A) monodispersed AuNPs solution and (B) aggregated AuNPs solution. Adapted from (Schofield et al. 2007).
The inter'particle distance dependent AuNP colours have been extensively applied for colorimetric biodetection (Baptista 2012; Doria et al. 2012; Dykman and Khlebtsov 2012). In particular, optical properties of AuNPs together with specificity of DNA interactions based on hybridisation process have resulted in very sensitive DNA detection methods (single base mismatch detection) that require very simple instrumentation (light source and photodetector).
Subsequently, various DNA detection methods have been developed basing on differential non'cross' linking aggregation of single Au'nanoprobe induced by increasing ionic strength of the solution in the presence of target DNA (Baptista et al. 2005; Sato et al. 2003). In the method developed by Baptista and co'workers, at increasing salt concentration, Au'nanoprobes aggregate in the presence of non' complementary/mismatch DNA target giving blue solution, while the presence of complementary DNA prevents aggregation of Au'nanoprobes and the solution remains red (Baptista et al. 2005), see Fig. 1.3. This method has allowed detection of pathogens (Baptista et al. 2006; Costa et al. 2009) and single base mismatches related with drug resistance (Veigas 2010).
Fig. 1.3. Principle of colorimetric DNA detection method based on non'cross'linking hybridisation of Au'nanoprobe at high salt concentration (Baptista et al. 2005). After salt addition, only the presence of complementary DNA target prevents the Au'nanoprobe aggregation remaining the red colour of the solution.
(blue solution). A photodetector sensitive to green light can detect these light intensity changes proving indirectly information of the colour of the solution being analysed, i.e. presence or absence of specific DNA sequence (Fig. 1.4). Alternatively, a system with a red light source and a photodetector sensitive for red light can be used.
Fig. 1.4. (A) Colour wheel presenting the relationship between a colour of object and its absorption of light. (B) Schematic representation of biosensor used for detection of colorimetric changes of DNA solution. The light from green LED is transmitted through the solution and then is detected by photodetector. The light allowed through the solution reaches the sensor that generates a photocurrent.
Fig. 1.5. Portable, integrated biosensor for colorimetric DNA detection based on non'cross'linking aggregation of Au'nanoprobes. The light from RBGA LED is transmitted through the solution and then is detected by amorphous/nanocrystalline silicon photodetector generating photocurrent. The analog signal is filtered, amplified, converted to a digital signal and transmitted to a computer via a serial communication protocol. Adapted from (Silva et al. 2011).
1.3. Microfluidic devices
the risk of operator error can be greatly reduced. Therefore, microfluidic devices are very promising candidates for the point of care use (Yager et al. 2008).
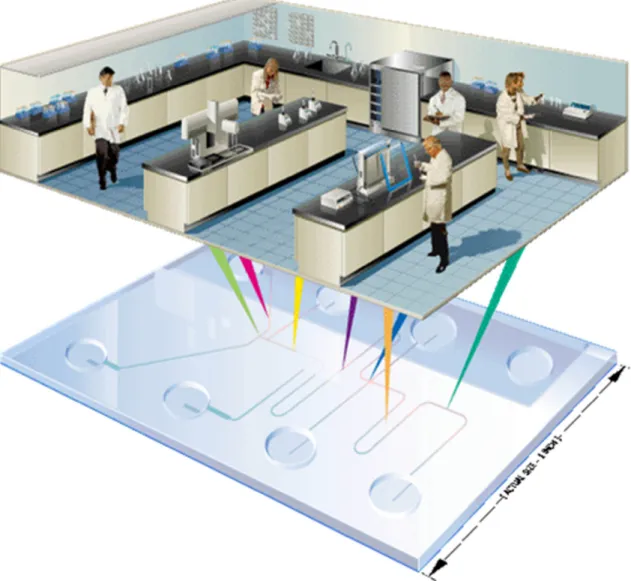
Fig. 1.6. Lab'on'chip concept: scaling down of several laboratory processes on a chip'format (http://Lab'on'Chip.gene'quantification.info retrieved in 2014.03).
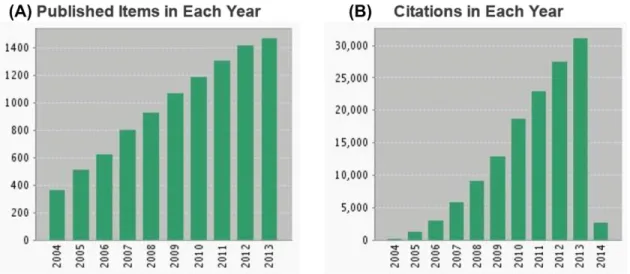
Fig. 1.7. Evolution of the number of (A) publications and (B) citations in the microfluidics field indexed within Web of Science Core Collections from 2004 to 2013 (query: ‘microfluidics’). The number of publications increases linearly with time, while the citations’ number—exponentially.
1.4. Fluid behaviour at microscale
Many phenomena do not simply scale linearly from large to small implementations due to increased surface area'to'volume ratio (eq. 1.1) (Weigl et al. 2008).
_
_ → ∞ eq. (1.1)
The relative importance of the inertial versus viscous forces in the flow (i.e. the ratio of the momentum of the fluid to the friction force imparted on the fluid by the walls) is described by Reynolds number (eq. 1.2).
is usually around Re = 2000, although depending on the system (channel shape, surface roughness, aspect ratio etc.), the turbulence may occur for Re > 1000 (Capretto et al. 2011). For Reynolds numbers from 1 to 1000, non'turbulent inertial effects may occur such as secondary flows in curved channels (Di Carlo 2009). The non'turbulent inertial effects are often used to enhance mixing of the fluids in microsystems.
Fig. 1.8 shows images from Reynolds’ 1883 paper, in which various flow regimes were determined and explained. Coloured water was injected with various velocities into clear water (Fig. 1.8A) forming various streak shapes (Fig. 1.8B) and basing on this observation, Reynolds had defined mathematical conditions for forming various flows.
Fig. 1.8. (A) Reynolds’ sketch of his 1883 experiment that allowed observation and explanation of various flow regimes: a dye'coloured water was injected with various velocities into clear water. (B) Laminar flow: smooth, ordered with constant fluid velocity.(C) Transitional flow: intermittent pulses of turbulence. (D) Turbulent flow: disorganised with with the formation of eddy current. Retrieved from (Reynolds 1883).
In the microfluidic systems, Re is usually below 1 due to low values of the characteristic dimension. The flow is essentially laminar, where two fluid streams flow in parallel and the mass is transported only in the direction of fluid flow. The only mixing that occurs is the result of diffusion (i.e. process of spreading molecules from a region of higher concentration to one of lower concentration by Brownian motion) across the interface between the fluids (Whitesides 2006). The distance that a molecule will diffuse in time t is given by eq. 1.3.
! 2√$% eq. (1.3)
in which kB is Boltzmann’s constant, T the temperature, η liquid viscosity and r molecule radius. The
advection (convection if heat is being transferred) is a transport mechanism in which molecules are carried along by the local velocity of the fluid (Capretto et al. 2011). The relative importance of advection to diffusion in proving the mass transport associated with mixing is described by Peclet number (eq. 1.5).
, _ _ .
, _ _ .
/ 0 /
1 2 ≡ 4
eq. (1.5)
in which v is the fluid velocity. When Pe < 1000, molecular diffusion becomes more effective than stirring for mixing (Weigl et al. 2007).
In microscale systems, Pe is usually low, so mixing is slow requiring long channels and increasing chip footprint. Thus, the mixing efficiency should be enhanced actively (using additional energy source, e.g. ultrasounds) or passively (by channel geometries that increase the contact surface area, e.g. using obstacles) (Capretto et al. 2011).
The advantage of working at low Pe isthat the diffusion distance can be made very small, especially if hydrodynamic focusing is used. Therefore, diffusion'controlled chemical reactions occur more rapidly than in comparable macroscopic reaction vessels (Weigl and Bardell 2004) .
1.5. Microfluidics materials
Fig. 1.9. Market share of materials used in microfluidic devices field in 2010 (retrieved from (Yole Développement 2011). In diagnostics, POC tests and pharmaceutical research, the polymers constitute the most used group due to their low cost and wide range of properties. In the applications involving more aggressive chemicals, silicon, metal and ceramics are more commonly used.
1.5.1. Silicon and glass
Originally, microfluidic devices were fabricated using technologies adapted from the semiconductor industry (etching and photolithography), so called “hard lithography” in silicon or glass (Abgrall 2007; Hunt and Wilkinson 2008). These techniques are related with fabrication difficulties, high cost and long processing times. Nevertheless, due to their excellent chemical resistance and high thermoconductivity, there are the preferred materials for analytical and microreaction devices (see Fig. 1.9).
1.5.2. Polymers
a high'resolution mould has been made, no more clean'room work is required since a large number of devices can be made quickly by injection moulding, casting or hot embossing. Polymers represent a broad class of materials, providing a wide range of material properties: various optical properties, glass transition temperatures and chemical resistance (Hunt and Wilkinson 2008). The use of polymer'based microsystem techniques leads to devices with a very competitive cost of test (Schuenemann and Harvey 2007), therefore they clearly constitute the most used group, especially in the fields of clinical and veterinary diagnostics and point of care devices, where the unit cost is a critical issue (Yole Développement 2011). Majority of polymers have lower resistivity to non'aqueous solvents, lower melting point and have tendency to adsorb reagents, so their application in drug discovery or chemical production is limited (Becker and Gärtner 2008). Basing on physical properties and related fabrication process, polymers can be divided into elastomers, thermosets and thermoplastics.
Thermosets (also called resins, e.g. SU'8) consist in inflexible three'dimensional chain network. The cross'linking is mediated by heating or radiation exposure and from irreversible chemical bonds, therefore once cross'linked, the thermosets do not soften before decomposition, so cannot be reshaped. Due to their rigid molecular structure, thermosets exhibit high mechanical, thermal and electrical stability and allow to produce high aspect ratio features and also three'dimensional submicron structures (del Campo and Greiner 2007). Their processing is expensive; therefore thermosets are usually used as mould material for high aspect ratio microfluidic devices. SU'8, a high contrast epoxy'based negative photoresist allows obtaining aspect ratio above 20 and layering up to 650 Fm by single coating. Due to its high optical transparency, viscosity and high photosensitivity, SU'8 has enabled big progress in microfluidic technologies as with previously used conventional photoresists only features up to 3 Fm height could be fabricated, while high aspect ratio features were fabricated by very complex X'ray LIGA process requiring use of synchrotron radiation (Becker and Gärtner 2008; Tabeling 2006). It is biocompatible and allows for fabrication of smooth and vertical side'wall features.
SU'8 consists of three components (Fig. 1.11):
(i) an epoxy oligomer (EPON SU'8 resin, Shell Chemical) that has eight reactive epoxy group per molecule (hence ‘8’ in the name);
(ii) a solvent: gamma'butyrolacton in conventional SU'8 series or cyclopentanone in newer series 2000. Cyclopentanone, more polar solvent, gives better coating quality and also evaporates much faster, which is of particular importance for high structures (e.g. for 150 Fm high features, in series GM1070 soft bake at 95 °C takes 4 hours, while for SU'8 2050 takes 30 min);