TEMAS LIVRES FREE THEMES
Risk factors for the ill-defined causes of death
in the Brazilian states: a multilevel analysis
Fatores de risco associados aos óbitos por causas mal definidas
nos estados do Brasil: uma análise multinível
Resumo Este estudo descreve as mudanças es-paço-temporais da proporção de causas mal de-finidas no Brasil (1998-2012) e seus fatores asso-ciados. Coletamos informações da proporção de óbitos por causas mal definidas por idade (15-59 anos), sexo, período, local de residência, além de fatores socioeconômicos. Utilizou-se modelo multinível de Poisson para investigar os fatores associados às causas mal definidas dos óbitos. Ao contrário dos estados do sul e centro-oeste, identi-ficou-se clusters com elevados níveis proporcionais destes óbitos nos estados do norte, nordeste e su-deste. A maior proporção de óbitos mal definidos ocorreu em 1998-2002 (0,09), no norte e nordeste (0,14 e 0,12, respectivamente), nos grupos etários mais velhos (0,09) e nos locais com condições so-cioeconômicas desfavoráveis. A análise ajustada indicou diferença dos níveis de causas mal defini-das de acordo com a região, a idade, o período, a escolaridade, a desigualdade social e a renda. Nos-sos resultados sugerem que quanto menor a faixa etária e melhores as condições socioeconômicas, menor o risco de óbitos mal definidos. Apesar de nos últimos anos a qualidade dos dados de morta-lidade no Brasil ter aumentado, os investimentos na melhoria do registro dos óbitos não podem ser descontinuadas.
Palavras-chave Mortalidade, Causas de morte, Estatísticas vitais, Registros de mortalidade, Aná-lise multinível
Abstract This study describes the spatial-tempo-ral changes of the proportion of ill-defined causes of death in Brazil (1998-2012) and investigates which demographic and socioeconomic factors af-fect this proportion. We collected information of the proportion of ill-defined causes of death by age (15-59 years), sex, period, locality, and socioeco-nomic data. We used a multilevel Poisson model to investigate which factors affect the risk of ill-de-fined causes of death. Unlike states located in the South and Midwest, we detected clusters with high proportional levels of these deaths in states in the North and Northeast regions. A greater propor-tion occurred in 1998-2002 (0.09), in the North and Northeast (0.14 and 0.12, respectively), in older age groups (0.09), and in places with poor socioeconomic conditions. The adjusted analysis showed differences in proportion according to the region, age, period, schooling, social inequality, and income. The results indicate that the lower the age group and the better the socioeconomic situation, the lower the risk to register the cause of death as ill-defined. Although over the past years, the quality of Brazil’s mortality data has gradual-ly increased, investments towards improving mor-tality registries cannot be discontinued.
Key words Mortality, Cause of death, Vital sta-tistics, Mortality registries, Multilevel analysis Nádia Cristina Pinheiro Rodrigues 1
Regina Paiva Daumas 1
Andréa Sobral de Almeida 1
Gisele O’Dwyer 1
Mônica Kramer de Noronha Andrade 1
Matthew Brian Flynn 2
Valéria Teresa Saraiva Lino 1
1 Escola Nacional de Saúde
Pública Sérgio Arouca, Fiocruz. R. Leopoldo Bulhões 1480, Manguinhos. 21041-210 Rio de Janeiro RJ Brasil. nadiarodrigues@ ensp.fiocruz.br
2 College of Liberal Arts
R
o
dr
igues NCP Introduction
Improving vital registrations is a priority for the World Health Organization (WHO)1 In 2003, only one quarter of the WHO member nations had high quality of vital statistics, while most countries (51%), including Brazil, had interme-diate quality, covering between 70% and 90% of the country’s deaths or showing percentage of ill-defined causes between 10% and 20%2.
In the 2008-2011 period, 30% of WHO mem-ber nations had high-quality death registrations. The United Kingdom, United States of America and Chile figured among these countries, but Brazil still showed 76% of average usability of mortality data for this period3. In Brazil, the qual-ity of the Mortalqual-ity Information System (SIM) is slowly improving4-6. Some authors, which in-vestigated the underlying cause of death related with neoplastic diseases, showed high reliability of the registered information7,8. Causes classified as ill-defined refer to deaths without medical care and those, which, although had been provided medical care, the cause of mortality could not be determined. Deaths classified as ill-defined affect the quality of data, reducing its reliability. The lack of accuracy of the mortality data makes the adequate allocation of health resources difficult4,9.
The main hypothesis of the present research is the relationship between the proportion of ill-de-fined causes of death and the sociodemographic characteristics. Sociodemographic determinants have been cited in much of the research related to mortality registrations10-12. Using the Brazilian federative units (states), we evaluate the propor-tion of ill-defined causes of death along the 1998-2012 period, through descriptive techniques and statistical modeling. To identify the spatial profile of the proportion of ill-defined causes of death and evaluate possible spatial changes over time, we also apply spatial analysis techniques. Lima e Queiróz13, who performed statistical techniques in order to investigate the distribution of ill-de-fined causes of death in Minas Gerais (Southeast of Brazil), identified spatial clusters in the North and Northeast of the state from 1980 to 2007.
Considering the importance of reliable gov-ernment-provided mortality information to sup-port appropriate sectoral actions and the high social inequality in the Brazilian states, this study describes the spatial and temporal changes of the proportion of ill-defined causes of death in Brazil and investigates which demographic and socio-economic factors affect this proportion over the 1998-2012 period.
Methods
This study evaluates Brazilian data from 1998 to 2012 using the country’s member states as units of analysis.
Brazil is the largest country of South Amer-ica with signifAmer-icant regional socioeconomic dif-ferences. While the Human Development Index in the Southeast, South and Midwest regions of the country varies around 0.75-0.76, in the North and Northeast, it ranges from 0.66-0.6714.
The South region includes Paraná, Santa Ca-tarina, Rio Grande do Sul states; the Southeast region, São Paulo, Minas Gerais, Rio de Janeiro, and Espírito Santo; the Midwest region, Mato Grosso do Sul, Mato Grosso, Goiás, and the Fed-eral Distrito; the North region, Acre, Rondônia, Amazonas, Roraima, Pará and Amapá; the Northeast region, Bahia, Piauí, Maranhão, Ceará, Rio Grande do Norte, Paraíba, Pernambuco, Ala-goas, and Sergipe states (Figure 1).
Data was collected from information on death records of those aged 15 to 59 years from the Mortality Information System (SIM) based on death certificates entered into the system. To avoid confounding factors due the distinct dis-eases, which prevail in each stage of life, we se-lected only the population aged 15-59. The clas-sification of ill-defined causes of death followed the definition of the second volume of 10th Revi-sion (ICD-10), which includes: “symptoms, signs and abnormal clinical and laboratory findings, not elsewhere classified” (codes R00-R99, except R-95), “ill-defined circulatory disorders” (codes I46.1, I46.9, I95.9, I99), “ill-defined respiratory disorders” (codes J96.0, J96.9), and “ill-defined conditions originating in the perinatal period” (code P28.5)15.
Using the number of ill-defined causes of death as the numerator and the total number of deaths as the denominator, we calculated the proportion of ill-defined causes of death by sex, age group and period. Information about Gross Domestic Product (GDP) per capita/1,000 dollar (1 real = 0.27 dollars), Gini index, and illiteracy rate in each state were also collected from DATA-SUS website for each period16,17.
Statistical analysis
aúd
e C
ole
tiv
a,
23(11):3979-3988,
2018
To verify if there is spatial dependence, we used Global Moran I and pseudo-significance test for asymmetric data, which tested wheth-er the proportion of ill-defined causes of death showed greater similarity in contiguous Brazilian states than would be expected by chance.
The Global Moran index can be defined by the formula below19:
I =
where, wij is an element of contiguity matrix w; yi is the proportion of the state i; yj is the pro-portion of state j; y is the sample mean and n is the total number of states.
To evaluate the presence of potentially dis-tinct spatial correlation regimes in the propor-tion of ill-defined causes of death in different Brazilian states, we plotted cluster maps using Local Indicators of Spatial Association (LISA)
and used a Queen matrix to compute the spatial statistics20,21.
The Local Moran index can be defined by the formula below19:
Ii = n
where, zi = yi - y; zj = yj - y; wij is an element of contiguity matrix w; yiis the proportion of state i;
yj
is the proportion of the state j; y is the sample mean and n is the total number of states.
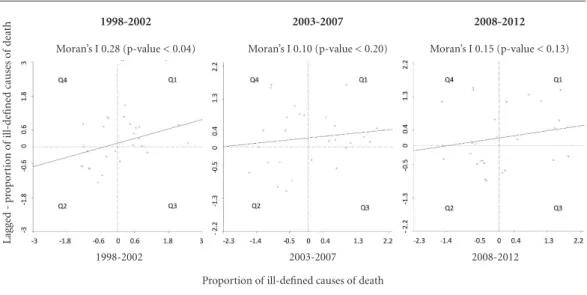
For each period, we plotted Moran scatter graphs to evaluate the spatial association of the proportion of ill-defined causes of death in each state with the average proportion of its neigh-bors22. To perform this analysis, the normalized values of the proportion of ill-defined causes of death in each state are compared to the mean values of its neighbors, which are divided in four quadrants that provide a classification of four types of spatial autocorrelation: direct spatial au-tocorrelations (Q1: high-high; Q2: low-low) and inverse spatial autocorrelations (Q3: high-low; Q4: low-high). The points of Q3 and Q4 can be seen as units that do not follow the same spatial dependence process of the area23.
We used statistical tests to access the asso-ciation between ill-defined causes of death and the following variables: sex, age group, period, region, GDP per capita, Gini index, and illiter-acy rate. We used a multilevel Poisson regression model to explain the occurrence of ill-defined causes of death (response variable).
The model in the first level included in the following factors: sex, age group, period, region, GDP (logarithm), Gini Index and illiteracy rate, and, as the “offset”, the total deaths (logarithm) of each specific population. In the second level, we included the Brazilian states. Poisson regres-sion is frequently used to model count data, but it is often inadequate for over-dispersion situa-tions24. Therefore, we applied the multilevel Pois-son regression25 to circumvent over-dispersion in the study.
The selection of the variables included in the model was based on previous scientific
knowl-edge26,27 and the availability of the indicators on
government databases14,16,28.
All analyses were performed with TerraView (version 4.2.2.)29, GeoDa (version 1.4.6)30 and R-Project (version 3.2.4)31 softwares.
This study did not require submission to the Ethics and Research Committee (i.e. an Insti-tutional Review Board), as it uses public access
Figure 1. Political division of Brazil: states and
regions.
AC = Acre; AL = Alagoas; AP = Amapá; AM = Amazonas; BA = Bahia; CE = Ceará; DF = Distrito Federal; ES = Espírito Santo; GO = Goiás; MA = Maranhão; MT = Mato Grosso; MS = Mato Grosso do Sul; MG = Minas Gerais; PA = Pará; PB = Paraíba; PR = Paraná; PE = Pernambuco; PI = Piauí; RJ = Rio de Janeiro; RN = Rio Grande do Norte; RS = Rio Grande do Sul; RO = Rondônia; RR = Roraima; SC = Santa Catarina; SP = São Paulo; SE = Sergipe; TO = Tocantins.
Midwest North Northeast South Southeast
Legend Brazil UF Region
n Σi Σj wij (yi - y) (yi - y)
Σi (yi - y) 2 Σ
i Σj wij n n
n n n
zi Σj wij zj Σj z
2 j n
R
o
dr
igues NCP data, available on the website
http://www2.data-sus.gov.br/DATASUS/index.php?area=02.
Results
From 1998 to 2012, there was a reduction in the proportion of deaths classified as ill-defined in Brazil. The proportion of deaths with ill-defined causes in the periods 1998-2002, 2003-2007 and 2008-2012, were 0.09, 0.08 and 0.07, respectively. Both men and women show the same proportion over the period (0.08). The highest proportion of ill-defined causes of death occurred in the North and Northeast regions, 0.14 and 0.12, respective-ly, while the lowest occurred in the South and Midwest, 0.5 and 0.6, respectively (Table 1).
Age strongly correlates with the proportion of ill-defined causes of death. The proportion of the older group (50-59 years) was greater than double compared to the younger age groups (15-19 and 20-29 years). The states with GDP per
capita US$ 8,100 or greater showed almost half of the share of ill-defined causes of death com-pared to those with lower per capita GDP. The states with Gini index 0.62 or greater had 50% higher proportional levels of ill-defined causes of death than those with lower levels of inequality. The states with illiteracy rates 11.60 or greater also showed proportional levels of ill-defined causes of death 50% higher than the others (Ta-ble 1).
The highest Global Moran’s I index was ob-served in the 1998-2002 period (0.28, p-value < 0.04). In the other periods, the Moran’s I index was not statistically significant. As expected, the scatterplots showed that most Brazilian states are located in Q1 (high-high) and Q2 (low-low) quadrants (Figure 2). These points represent units with low (Q2) or high (Q1) incidence rates following the same spatial dependence process of the area.
The LISA Cluster maps, Figure 3, highlight three low-low areas comprised of one state in the South (Paraná) in 1998-2002 and two others in the Midwest (Mato Grosso and Goiás states) in 2003-2007 (i.e. units with low incidence rates following the same spatial dependence process of the area). We found the most high-high areas in the Northeast and North regions (i.e. units with high incidence rates following the same spatial dependence process of the area). However, the map of 2008-2012 highlights one important Bra-zilian state in the Southeast (São Paulo) as a sig-nificant high-high area.
We could detect only four significant low-high areas. Although these areas are close to areas with high proportions, they have lower propor-tions of ill-defined causes of death (Figure 3).
In Table 2, we investigate which factors af-fect the risk of ill-defined causes of death. There was not an association between sex and the oc-currence of ill-defined causes of death. The ad-justed analysis also did not show a difference between the proportion of ill-defined causes of death between the Midwest (reference category) and South regions. However, the risks of ill-de-fined causes of death in the Southeast, North and Northeast regions were 1.87, 2.05 and 2.08 times greater, respectively, than that observed in the Midwest region. The adjusted analysis showed an increasing trend in the risk of ill-defined caus-es of death as age increascaus-es. The proportion of ill-defined causes of death was about two times greater in the older group than that of the young-er. The adjusted analysis suggests a decreasing trend in the proportion of ill-defined causes of
Table 1. Distribution of the proportion of ill-defined
causes of death in different Brazilian states according to demographic and socioeconomic factors.
Characteristics Proportion of ill-defined
causes of deaths
Category Mean (SD) P-value
Period 1998-2002 0.09 (0.07) 0.0001
2003-2007 0.08 (0.05)
2008-2012 0.07 (0.03)
Region North 0.14 (0.07) 0.0001
Northeast 0.12 (0.08)
Southeast 0.08 (0.04)
South 0.05 (0.02)
Midwest 0.06 (0.03)
Age group 15-19 0.04 (0.04) 0.0001
20-29 0.04 (0.04)
30-39 0.08 (0.05)
40-49 0.09 (0.06)
50-59 0.09 (0.06)
Sex Female 0.08 (0.06) 0.17
Male 0.08 (0.05)
GDP < 8,100 0.14 (0.07) 0.0001
≥ 8,100 0.08 (0.03)
Gini Index < 0.62 0.08 (0.04) 0.0001
≥ 0.62 0.12 (0.08)
Illiteracy rate < 11.60 0.08 (0.04) 0.0001
≥ 11.60 0.12 (0.08)
aúd
e C
ole
tiv
a,
23(11):3979-3988,
2018
death over the entire period under study. The risk of ill-defined causes of death was 37% lower in the last period than that of the first one.
In the adjusted analysis, both income in-dicators, GDP and Gini index, were associated with the levels of ill-defined causes of death. The greater the GDP of a state, the lower the risk of
ill-defined causes of death. The greater the Gini index, the greater the risk of ill-defined causes of death. Finally, there is a direct association be-tween the illiteracy rate and the risk of ill-defined causes of death. The greater the illiteracy rate, the greater the proportion of ill-defined causes of death (Table 2).
Figure 2. Local Moran’s I scatter plot of the proportion of ill-defined causes of death in Brazilian states by
period.
The quadrants Q1, Q2, Q3 and Q4 represent the four types of spatial autocorrelation: high-high (Q1), low-low (Q2), high-low (Q3) and low-high (Q4).
Lag
ge
d - p
ro
p
o
rt
io
n o
f il
l-d
efine
d causes o
f d
eath
1998-2002
Moran’s I 0.28 (p-value < 0.04)
2003-2007
Moran’s I 0.10 (p-value < 0.20)
2008-2012
Moran’s I 0.15 (p-value < 0.13)
Proportion of ill-defined causes of death
1998-2002 2003-2007 2008-2012
Figure 3. Lisa maps of the average of the proportion of ill-defined causes of death in Brazilian states by period.
Not significant
High-High Low-Low
Low-High High-Low
Legend
2008-2012 2003-2007
1998-2002
2,000 kilometers 500 1,000
R
o
dr
igues NCP
Discussion
The findings indicated that ill-defined causes of death in Brazil decreased gradually in recent years. Other Brazilian investigations also showed reductions in the proportion of ill-defined causes of death over the same period. Costa and Mar-copito highlighted a reduction of 25% in the percentage of ill-defined causes of death in Bra-zil from 1979 to 2002. Some of the explanations provided by the authors for this reduction was the proportional increase of external causes of death and higher determination of the natural causes of death32. De Lima and Queiroz (2014) reported that the percentage of ill-defined causes of death in Brazil fell 53% over 1991-2010 period. The authors reported that this reduction proba-bly occurred due to the successful efforts of the Brazilian government to improve data quality33.
Our results indicated an association between the region where the death occurred and the proportion of ill-defined causes of death. The South region showed the lowest proportion of
ill-defined causes of death of the country. This probably occured because this region presents fa-vorable socioeconomic conditions. In the South, we found the lowest illiteracy rates (5.9) and Gini index (0.56) for the period. Except for the South, all other regions showed a higher proportional risk of ill-defined causes of death compared to the Midwest. We also detected clusters of high level of ill-defined causes of death in North and Northeast until 2007 compared to the South and Midwest where we found low proportion clusters. Martins Junior et al.34 also highlighted a reduction of about 80% in ill-defined propor-tion causes of death in the Northeast from 1979 to 2009. Similarly, other researchers pointed that the highest percentages of ill-defined causes of death are located in the North and Northeast re-gions33,35. Costa and Marcopito found that, from 1979 to 2002, the percentages of ill-defined caus-es of death in several Brazilian regions fell signifi-cantly. The highest levels of ill-defined causes of death were detected in some states in the North-east (37-58% in 2002). According to the authors, the variation of the proportion of ill-defined causes of death along the country is due to the distinct socioeconomic development stages of the different Brazilian areas32.
In last period, the proportion of ill-defined causes of death in São Paulo state was higher compared to its Southern and Midwest neigh-bors. However, São Paulo showed a lower propor-tion of ill-defined causes of death compared to its neighbors in the southeast region (Rio de Janeiro and Minas Gerais states). In fact, Minas Gerais showed the highest proportion from 2007-2012 (0.11). Although Minas Gerais improved its cov-erage of registering mortality, the proportion of ill-defined causes of death increased substantially from 1980 to 200713.
Except in the South, in other Brazilian re-gions we detect some states with low level of ill-defined causes of death close to others with high level, classified as low-high areas. No one of these states became significant high-high areas during this period.
The proportion of ill-defined causes of death in Brazil was similar in both sexes. In São Paulo, the State Health Secretary reported in 2010 that the proportion of ill-defined causes of death was almost the same in both sexes (around 0.05 to 0.06)36.
Our findings detected that proportional val-ues of ill-defined causes of death were directly associated with age. Other Brazilian studies also showed this association32,33,35,37. Considering that
Table 2. Adjusted relative risk of ill-defined causes of
deaths according to the period and demographic and socioeconomic factors.
Categories RR* p-value
Region Midwest 1.00
North 2.05 0.0003
Northeast 2.08 0.0001
Southeast 1.86 0.005
South 1.29 0.26
Sex Female 1.00
Male 0.99 0.56
Age group 15-19 1.00
20-29 1.10 0.00001
30-39 1.70 0.00001
40-49 2.00 0.00001
50-59 2.04 0.00001
Period 1998-2002 1.00
2003-2007 0.80 0.00001
2008-2012 0.62 0.00001
GDP1 0.86 0.00001
Gini Index 11.57 0.00001
Illiteracy rate < 11.60 1.00
≥ 11.60 1.06 0.00001
RR = Relative Risk; GDP = Gross Domestic Product (the conversion real to dollar considered: 1 real = 0.27 dollars);
1Logarithm of GDP. *We used a multilevel Poisson regression
aúd
e C
ole
tiv
a,
23(11):3979-3988,
2018
the higher the age group, the greater the propor-tion of ill-defined causes of death, non-commu-nicable chronic diseases, which are more preva-lent in older ages, seem to have a significant role on the proportional levels of ill-defined causes of death32,33.
The results also indicated that the higher ed-ucation level of the state’s population, the low-er the proportion of ill-defined causes of death. Some authors corroborated these findings38,39. Teixeira et al.39 indicated that the proportion of ill-defined causes of death for those who do not complete high school or graduate is twice those who do.
The state based income levels also can in-crease the proportion of ill-defined causes of death. As we observed in this study, both low per capita GDP contributed to increase this propor-tion, as well as high inequality (represented by Gini index). Kanso et al.38 also showed a declin-ing trend in the proportion of ill-defined causes of death as GDP increases.
Our study contributes to our understanding of Brazilian public health indicators; however, the results must be analyzed with caution, con-sidering the variation of coverage in the quality of data within each state and region. The meth-od used in this study assumes that the popula-tion under the study are demographically stable inside each region, which does not reflect the complexity of our real world. As is discussed in the scientific literature, some local factors can affect the amount of ill-defined causes of death. The most violent places where there are more external causes of death, for example, probably have a greater proportion of ill-defined causes of death than others40. According to official data, the most violent Brazilian states are located in the Northeast region in the following states, Alagoas, Ceará, Rio Grande do Norte, Sergipe and Bahia. In 2013, the homicide rates in these states were higher than 50 deaths per 100,000 inhabitants16.
Although the completeness of death records in Brazil have improved in recent years, there are still wide regional variations in the distribution of ill-defined causes of death33, with significant dif-ferences across states and regions over time41. The greatest percentage of incomplete records is ob-served in the North and Northeast regions, while the most complete is in the South27. In 2010, the vital registration data system covered less than 80% of the deaths in the following states, To-cantins (North) and Maranhão (Northeast), and more than 90% of the deaths in Distrito Federal (Midwest), Paraná (South), Rio Grande do Sul
(South), Rio de Janeiro (Southeast), São Paulo (Southeast) and Espírito Santo (Southeast)42.
Many efforts have been made to improve the quality of Brazilian data. Among these tools, we should highlight the implementation of investi-gation programs of ill-defined causes of death in each city, which corrects and redistributes data by researching deaths. Another important tool is to link databases in order to correct ill-defined mortality registers4.
The use of the state as the unit of analysis also represents a limitation. Others studies us-ing smaller areas as units of analysis could help to identify the main locales where governmental data improvement programs should be focused. Although several small municipalities have al-ready improved their data systems for tabulating death registrations, there are still several gaps like the high turnover of hired professionals and the lack of professional qualified to perform system-atic registrations of local death data43. Besides, we must consider the ecological fallacy, which makes impossible deriving any inferences in individu-al level problematic. Another limiting factor of this study was the official information which was available through government sources. Other socioeconomic information in individual level could also have had contributed to explaining the levels of ill-defined causes of death. Despite of these limitations, the present study makes im-portant contributions about the quality of data in Brazil in recent years and indicates that mortality data has gradually improved in recent decades.
Although managers, physicians, and oth-er professionals have made a positive impact in this improvement, there is still a lot of work to do. Nevertheless, some efforts – investigations of the ill-defined deaths and the use of linkages techniques to compare different databases and correct possible inconsistencies among the data – are already performed in order to gradually decrease the proportion of ill-defined causes of death throughout the country. If these initiatives are maintained, Brazil’s vital registration system should soon reach adequate quality, according to international standards3.
Conclusion
R
o
dr
igues NCP the age group and the better the socioeconomic
condition, the lower the risk of registering the cause of death as ill-defined.
Although over the past years, there is better quality of mortality data in Brazil, investments targeting improvements in mortality registra-tion cannot be discontinued, especially in Brazil’s North and Northeast regions, where data quality remains subpar.
Collaborations
aúd
e C
ole
tiv
a,
23(11):3979-3988,
2018
References
1. Jong-wook L. Global health improvement and WHO: shaping the future. Lancet 2003; 362(9401):2083-2088. 2. Mathers CD, Fat DM, Inoue M, Rao C, Lopez AD.
Counting the dead and what they died from: an assess-ment of the global status of cause of death data. Bull
World Health Organ 2005; 83(3):171-177.
3. World Health Organization (WHO). WHO methods and data sources for country level causes of death 2000-2012. Geneva: WHO; 2014.
4. Jorge MH, Laurenti R, Gotlieb SL. [Quality analysis of Brazilian vital statistics: the experience of implement-ing the SIM and SINASC systems]. Cien Saude Colet 2007; 12(3):643-654.
5. DATASUS. Razão entre óbitos informados e estimados 2015. [cited 2015 Mar 25]. Available from: http://tab-net.datasus.gov.br/cgi/idb2012/a1801b.htm
6. Frias PG, Szwarcwald CL, Lira PI. [Evaluation of infor-mation systems on live births and mortality in Brazil in the 2000s]. Cad Saude Publica 2014; 30(10):2068-2280. 7. Oliveira PP, Silva GA, Curado MP, Malta DC, Moura L. [Reliability of cancer as the underlying cause of death according to the Mortality Information System and Population-Based Cancer Registry in Goiânia, Goiás State, Brazil]. Cad Saude Publica 2014; 30(2):296-304. 8. Queiroz RC, Mattos IE, Monteiro GT, Koifman S.
[Re-liability and accuracy of oral cancer as the reported underlying cause of death in the Municipality of Rio de Janeiro]. Cad Saude Publica 2003; 19(6):1645-1653. 9. Laurenti R, Mello Jorge MHP, Gotlieb SLD. A confi-abilidade dos dados de mortalidade e morbidade por doenças crônicas não-transmissíveis. Cien Saude Colet 2004; 9(4):909-920.
10. Amo-Adjei J, Annim SK. Socioeconomic determinants of birth registration in Ghana. BMC Int Health Hum Rights 2015; 15:14.
11. Kulhánová I, Menvielle G, Bopp M, Borrell C, Deboos-ere P, Eikemo TA, Hoffmann R, Leinsalu M, Martika-inen P, Regidor E, Rodríguez-Sanz M, Rychtaříková J, Wojtyniak B, Mackenbach JP. Socioeconomic differ-ences in the use of ill-defined causes of death in 16 European countries. BMC Public Health 2014; 14:1295. 12. Cavalini LT, Ponce de Leon AC. [Correction approach
for underreporting of deaths and hospital admissions due to ill-defined causes]. Rev Saude Publica 2007; 41(1):85-93.
13. Lima EE, Queiroz BL. The development of under-reg-istration of deaths and causes of ill-defined deaths in Minas Gerais: regional differences. Revista Brasileira de
Estudos de População 2011; 28:303-320.
14. Programa das Nações Unidas para o Desenvolvimen-to (PNUD). [Brazilian Human Development Report 2009/2010] Brasília: Ultra Digital Gráfica Editora Ltda; 2010. [cited 2016 Apr 16]. Available from: http://www. pnud.org.br/HDR/Relatorios-Desenvolvimento-Hu- mano-Brasil.aspx?indiceAccordion=2&li=li_RDHBra-sil
15. DATASUS. CID-10 2008. [cited 2016 Jul 5]. Available from: http://www.datasus.gov.br/cid10/V2008/princi-pal.htm.
16. DATASUS. [Health Information] Brazil 2015. [cited 2014 Feb 16]. Ministério da Saúde do Brasil. Available from: http://www2.datasus.gov.br/DATASUS/index.php.
17. Rede Interagencial de Informações para Saúde (RIP-SA). Indicadores e Dados Básicos - Brasil - 2012. Brasília; 2012. [cited 2015 Oct 26]. Available from: http://tab-net.datasus.gov.br/cgi/idb2012/matriz.htm.
18. Instituto Brasileiro de Geografia e Estatística (IBGE).
IBGE malhas digitais. Rio de Janeiro; 2015 [cited 2015
May 28]. Available from: http://mapas.ibge.gov.br/bas-es-e-referenciais/bases-cartograficas/malhas-digitais. 19. Moran PAP. The Interpretation of Statistical Maps.
Journal of the Royal Statistical Society Series B (Meth-odological) [Internet]. 1948; 10:[ cited 2006 Sep 12]. Available from: http://www.jstor.org/stable/2983777. 20. Brasil. Ministério da Saúde (MS). Volume 2: Sistemas
de Informações Geográficas e Análise Espacial na Saúde Pública. Brasília: MS; 2007. [cited 2006 Sep 12]. Avail-able from: http://www.capacita.geosaude.icict.fiocruz. br/referencia.php.
21. Brasil. Ministério da Saúde (MS). Volume 1: Abordagens
espaciais na Saúde Pública. Brasília: MS; 2016. [cited
2006 Sep 12]. Available from: http://www.capacita.geo-saude.icict.fiocruz.br/referencia.php.
22. Anselin L. The Moran scatterplot as an ESDA tool to assess local instability in spatial association. Spatial an-alytical perspectives on GIS 1996; 111:111-125. 23. Druck S, Carvalho MS, Monteiro AVM. [Spatial
Analy-sis of Geographic Data]. Brasília: Embrapa; 2004. 24. Ismail N, Jemain AA. Handling Overdispersion with
Negative Binomial and Generalized Poisson Regression
Models. Casualty Actuarial Society Forum [Internet].
Winter 2007. [cited 2016 Jan 29]. Available from: http:// www.casact.org/pubs/forum/07wforum/07w109.pdf 25. Gelman A, Hill J. Data Analysis Using Regression and
Multilevel/Hierarchical Models. New York: Cambridge University Press; 2007.
26. Hu Y, van Lenthe FJ, Mackenbach JP. Income inequal-ity, life expectancy and cause-specific mortality in 43 European countries, 1987-2008: a fixed effects study.
Eur J Epidemiol 2015; 30(8):615-625.
27. França E, Abreu DX, Rao C, Lopez AD. Evaluation of cause-of-death statistics for Brazil, 2002-2004. Int J
Ep-idemiol 2008; 37(4):891-901.
28. Instituto Brasileiro de Geografia e Estatística (IBGE). Rio de Janeiro: IBGE. 2014. [cited 2014 Aug 20]. Avail-able from: http://www.ibge.gov.br/home/mapa_site/ mapa_site.php#geociencias
29. Instituto Nacional de Pesquisas Espaciais (INPE).
Ter-raView 4.2.2. São Paulo: INPE; 2013. [cited 2016 Aug
14]. Available from: http://www.dpi.inpe.br/terraview/ index.php.
30. Anselin L. GeoDa 1.4.6. Chicago; 2013 [cited 2016 Aug 14]. Available from: http://geodacenter.github.io/ download_windows.html.
31. Gentleman R, Ihaka R. R: The R Project for
Statisti-cal Computing. Auckland: University of Auckland;
2016. [cited 2016 Sep 14]. Available from: https://ww-w.r-project.org/
32. Costa MR, Marcopito LF. [Mortality due to ill-defined causes in Brazil (1979-2002) and a predictive model for age]. Cad Saude Publica 2008; 24(5):1001-1012. 33. Lima EE, Queiroz BL. Evolution of the deaths registry
R
o
dr
igues NCP 34. Martins Junior DF, Costa TM, Lordelo MS, Felzemburg
RD. Trends of mortality from ill-defined causes in the Northeast region of Brazil, 1979-2009. Rev Assoc Med Bras 2011; 57(3):332-340.
35. Paes NA. Quality of death statistics by unknown causes in Brazilian states. Rev Saude Publica 2007; 41(3):436-445.
36. São Paulo. Secretaria Estadual de Saúde. [Bulletin of Electronic Technical Group Assessment and Health
Infor-mation]. São Paulo 2012. [cited 2015 Apr 17]. Available
from: http://portal.saude.sp.gov.br/resources/ses/per-fil/profissional-da-saude/destaques//gais_jornal_12. pdf
37. Lima-Costa MF, Matos DL, Laurenti R, Mello-Jorge MH, Cesar CC. Time trends and predictors of mortal-ity from ill-defined causes in old age: 9 year follow-up of the Bambuí cohort study (Brazil). Cad Saude Publica 2010; 26(3):514-522.
38. Kanso S, Romero DE, Leite IC, Moraes EN. [Geograph-ic, demograph[Geograph-ic, and socioeconomic differences in quality of data on cause of death in Brazilian elders].
Cad Saude Publica 2011; 27(7):1323-1339.
39. Teixeira CL, Klein CH, Bloch KV, Coeli CM. [Probable cause of death after reclassification of ill-defined causes on hospital admissions forms in the Unified National Health System, Rio de Janeiro, Brazil]. Cad Saude
Pu-blica 2006; 22(6):1315-1324.
40. França E, Campos D, Guimarães MD, Souza MF. Use of verbal autopsy in a national health information sys-tem: Effects of the investigation of ill-defined causes of death on proportional mortality due to injury in small municipalities in Brazil. Popul Health Metr 2011; 9:39. 41. Queiroz BL. [Estimates of coverage degree and Life
Expectancy for the Brazilian Federative Units between 2000 and 2010] São Paulo: XVIII Encontro de Estudos de
População da ABEP; 2012 [cited 2016 Jun 13]. Available
from: http://www.abep.nepo.unicamp.br/xviii/anais/ files/POSTER%5B261%5D.pdf.
42. Souza FH. Padrão da mortalidade brasileira:
estima-tivas a partir do nível municipal. Natal: Universidade
Federal do Rio Grande do Norte; 2014. [cited 2016 Sep 20]. Available from: https://www.google.com.br/ url?sa=t&rct=j&q=&esrc=s&source=web&cd=4& ved=0ahUKEwj3hrXlkp7PAhUFk5AKHeCWA-oQF- ggxMAM&url=https%3A%2F%2Fsigaa.ufrn.br%2F-sigaa%2FverProducao%3FidProducao%3D 2422919% 26key%3De7fdf0664c68f6d442a90d972f43f6da&us-g=AFQjCNGTstI45niHfpMZMrd6Njj1Njlrvw& sig2=-TdK_fz-xzM6mQDDs-9jHQ&cad=rja. 43. Campos D, Hadad SC, Abreu DM, Cherchiglia ML,
França E. Mortality Information System in small mu-nicipalities of Minas Gerais state: concepts of health professionals. Cien Saude Colet 2013; 18(5):1473-1482.
Artigo apresentado em 28/07/2016 Aprovado em 25/11/2016
Versão final apresentada em 27/11/2016
This is an Open Access article distributed under the terms of the Creative Commons Attribution License
BY