* Corresponding author: E-mail: mgrmarcio@hotmail.com
Received: December 30, 2016 Approved: January 3, 2018
How to cite: Rosa MG, Santos JCP, Brescovit AD, Mafra AL, Baretta D. Spiders (Arachnida: Araneae) in agricultural land use systems in subtropical environments. Rev Bras Cienc Solo. 2018;42:e0160576.
https://doi.org/10.1590/18069657rbcs20160576
Copyright: This is an open-access article distributed under the terms of the Creative Commons Attribution License, which permits unrestricted use, distribution, and reproduction in any medium, provided that the original author and source are credited.
Division - Soil Processes and Properties | Commission - Soil Biology
Spiders (
Arachnida: Araneae
)
in Agricultural Land Use Systems in
Subtropical Environments
Marcio Gonçalves da Rosa(1)*
, Júlio Cesar Pires Santos(2)
, Antônio Domingos Brescovit(3)
, Álvaro Luiz Mafra(2)
and Dilmar Baretta(4)
(1)
Universidade do Estado de Santa Catarina, Departamento de Solos e Recursos Naturais do Centro de Ciências Agroveterinárias, Programa de Pós-Graduação em Ciência do Solo, Lages, Santa Catarina, Brasil.
(2)
Universidade do Estado de Santa Catarina, Departamento de Solos e Recursos Naturais do Centro de Ciências Agroveterinárias, Lages, Santa Catarina, Brasil.
(3)
Instituto Butantan, Laboratório de Artrópodes Peçonhentos, São Paulo, São Paulo, Brasil.
(4)
Universidade do Estado de Santa Catarina, Departamento de Zootecnia do Centro de Educação Superior Oeste, Chapecó, Santa Catarina, Brasil.
ABSTRACT: Changes in land use management in agricultural areas can affect the biodiversity of spider families. This study aimed to evaluate spider diversity in different
land use systems with capture by two sampling methods, and to identify soil properties that can modulate the occurrence of spiders. Five land use systems, representative of traditional agricultural areas, were evaluated in the west of Santa Catarina, Brazil, to establish a scale of land use intensity: native forest, eucalyptus reforestation areas, pastures, crop-livestock integration areas, and annual crops under no-tillage. The collection methods were manual from soil monoliths and soil traps. Altogether 479 individuals were captured, which were distributed among 20 families, 40 genera, and 8 species. Principal component analysis separated the land use systems and showed an association of spider families with land use in the two sampling methods. There was reduction in spider diversity as the intensity of land use increased. The manual collection
method was more efficient for families of soil spiders, whereas traps were more efficient
for epigeic spiders. The Lycosidae family was more resistant to environmental pressures,
while Oonopidae and Amaurobiidae were more sensitive to environmental modifications. The differences in the spider communities were explained by the following soil properties:
INTRODUCTION
Soil is home to a significant portion of total spider biodiversity. Agricultural management
practices invariably limit the communities of these animals. Limiting factors include
application of agrochemicals, soil compaction, and lack of floral diversity (Lo-Man-Hung et al.,
2011). Spiders occurring in soils can be used as indicators of the sustainability and adequate management of agricultural landscapes (Jung et al., 2008) due to the functional diversity of spiders, which are specialized in preying on pests (Chatterjee et al., 2009).
However, little is known about spider communities in natural and anthropogenic areas
(Borges and Wunderlich, 2008).
Agricultural management practices have been reported by several authors as one of the factors responsible to reduce soil biodiversity (Castro and Wise, 2010; Teague et al., 2011; Velásquez et al., 2012; Lafage and Pétillon, 2014; Kernecker et al., 2015; Lefebvre et al., 2016; Polchaninova et al., 2016; Michalko et al., 2017). This is especially so for spiders, as these animals are dependent on balanced trophic structures for foraging. The
occurrence of spiders may vary according to the time of year, which affects the distribution
of other soil organisms that are trapped by spiders (De Lange et al., 2013). In addition,
changes in forest vegetation and cultivated areas may influence spider populations. Knowledge of spider diversity in the South of Brazil relies on only a few specific studies,
including those of Indicatti et al. (2008), Ott (2003), Poeta et al. (2010), and Preuss and Lucas (2012), which are nevertheless limited and lack a systemic perspective. Furthermore, these studies do not include environmental variables, which are of paramount importance for understanding the ecological mechanisms of distribution and establishment of spider populations.
Another difficulty in evaluating the effects of soil use on spider biodiversity is the limitation
imposed by sampling methods, which may underestimate the abundance and richness of these organisms (Baretta et al., 2007) or may be complicated due to costs, time, periodicity, and human error. For subtropical conditions in Brazil, only one study was found that evaluated sampling methods for spiders (Baretta et al., 2007). Therefore, it is
necessary to expand knowledge concerning this subject.
Two hypotheses guided this study. First, soil management can affect spider communities,
reducing spider diversity and density according to the intensity of use. Second, soil
properties may explain the distribution of spider families according to a scale of land
use intensity.
This study aimed to evaluate the intensity of anthropic intervention in traditional
agricultural areas in a subtropical environment and its effects on the diversity of spiders.
MATERIALS AND METHODS
Study areas
Spider samples were obtained by hand-sorting methods in soil monoliths (Anderson and Ingram, 1993) and pitfall traps (Baretta et al., 2007). Sampling was carried out in the months of June and July 2011 (winter) and December 2011 and January 2012 (summer). During these periods, the temperature and rainfall conditions were representative of the regional environment (Santa Catarina, 1986). Spider samples were taken in a 3 × 3, sample grid, with nine points per land use system in each municipality, for a total of 27 points per land use system. Spacing between each point was 30 m, respecting a distance of 20 m from the border, with a total of 270 points for each of the methods (winter + summer) and total area of 1 ha in each of the land use systems.
At each point, the soil was excavated in 0.25 × 0.25 m monoliths, with a depth of
0.20 m. The collected soil was packed in plastic bags and taken to the laboratory, where
manual sorting was performed with the aid of artificial lighting, collecting the spiders
with tweezers. The individuals collected were stored in 80 % alcohol solution, in plastic bottles, and were sent to the Butantan Institute.
The traps were set up approximately 0.30 m from the collection points of the monoliths
and consisted of 0.13 × 0.06 m glass containers (height × diameter) containing 200 mL of water with a few drops of detergent. The open part of the trap was installed at ground
level, opening in a hole with a Dutch auger. The traps remained in the field for three days,
were collected, and then taken to the laboratory, where the collected organisms were separated with the aid of 0.125 mm sieves. All the organisms found were stored in 80 % alcohol in plastic bottles and sent to the Butantan Institute. All material was deposited in the Arachnida and Myriapoda collection of the Special Laboratory of Zoological Collections (LECZ) of the Butantan Institute (A.D. Brescovit, curator).
The total abundance of the spider families from each collection method was used to obtain the gradient length by Detrended Correspondence Analysis (DCA), as proposed by ter Braak and Smilauer (1998). The comparison of the abundance of the spider families and the land use systems was made by Principal Component Analysis (PCA), considering each collection method and the combination of sampling methods.
The Shannon Wiener index (H’) was calculated to verify how environmental pressures (intensification of land use) might interfere with the distribution of spider families; H’ was 1. São Miguel do Oeste
2. Chapecó
3. Xanxerê 1
2 3
Municipalities Latitude
26° 44' 18.87" S 26° 43' 58.39" S 26° 44' 0.08" S 26° 44' 38.88" S 26° 44' 40.32" S 27° 2' 4.43" S 27° 1' 42.76" S 27° 5' 17.53" S 27° 3' 3.68" S 27° 0' 48.90" S 26° 50' 1.21" S 26° 47' 3.27" S 26° 49' 40.68" S 26° 49' 43.80" S 26° 50' 18.64" S
Longitude
53° 32' 4.93" O 53° 32' 6.07" O 53° 32' 1.63" O 53° 32' 43.30" O 53° 32' 39.70" O 52° 41' 48.53" O 52° 41' 34.56" O 52° 38' 42.21" O 52° 43' 9.86" O 52° 41' 22.90" O 52° 27' 11.96" O 52° 27' 36.72" O 52° 28' 11.35" O 52° 28' 16.10" O 52° 28' 33.72" O
Altitude m 648 659 660 641 642 623 653 642 593 679 714 709 723 714 746 Chapecó
Xanxerê São Miguel do Oeste
LUS
NF ER PA CLI NT NF ER PA CLI NT NF ER PA CLI NT 2
C
X S d
SC
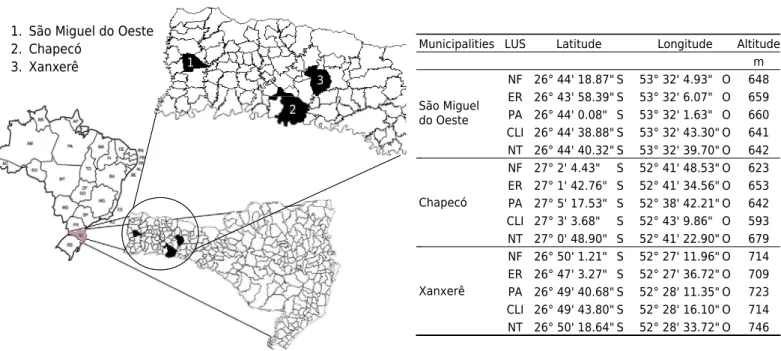
Figure 1. Geographic location and mean altitude of the land use system (LUS) of native forest (NF), eucalyptus reforestation (ER), pasture (PA), crop and livestock integration (CLI), and no-tillage (NT) in the municipalities of São Miguel do Oeste, Chapecó, and
calculated as proposed by Odum (1983) through the Vegan package (Oksanen, 2009)
in the R statistical software (R Development Core Team, 2011). The mean values of H’
were calculated point by point (n = 27) by the Tukey test at 5 % probability, with the R statistical program (R Development Core Team, 2011). For determination of average family richness, the number of individuals from each family in each sample unit was added up and divided by the number of sample units (n = 27) for each of the land use systems evaluated. To obtain the total richness of families, the number of individuals from each family was added up for all sample units (n = 27).
Table 1. History of use of the evaluated areas in the western region of Santa Catarina
Municipality Parameter Native forest Eucalyptus
reforestation Pasture
Crop-livestock
integration No-tillage
Xanxerê
Area (ha) 1 6 4.2 1.9 6.2
Duration of management
(year)
>50 4 12 8 18
Vegetation and management Transition from rainforest and semideciduous seasonal forest. Secondary forest. Formerly native pasture Grazing introduced (Axonopus affinis).
Treatment with animal waste.
Minimal tillage with crop rotation (soybean and corn
for grains, oats and ryegrass for grazing). Entry of milk cows. Use
of herbicides, insecticides, and
fungicides.
No-tillage (soybean, corn, and wheat). Use of herbicides, insecticides, and
fungicides.
São Miguel do Oeste
Area (ha) 10.4 2.6 1.9 1.8 3.2
Duration of management
(year)
>50 7 50 18 4
Vegetation and management Transition from rainforest and semidecidual seasonal forest. Secondary forest with people entering by trails.
Formerly native pasture
Mix of introduced pasture with native pasture. Accidental fire in
2007.
Minimum tillage with crop rotation (soybean and corn
for grains, oats, and ryegrass for
pasture). Entry of milk cows. Use
of herbicides, insecticides, and
fungicides.
No tillage with crop rotation
(soybean, corn, oats, and ryegrass). In the
last two years without application
of herbicides, insecticides, and
fungicides.
Chapecó
Area (ha) 7.6 3.5 5.4 5.1 2.2
Duration of management
(year)
>50 15 50 10 10
Vegetation and management Transition from rainforest and semidecidual seasonal forest. Secondary forest with people entering by trails.
Formerly native pasture. Application of animal waste. Accidental fire in 2006. Native pasture. Direct planting with crop rotation (soybean and corn for grains, oats, and ryegrass for pasture). Entry of milk cows. Use of herbicides, insecticides, and
fungicides.
No tillage (soybean, corn, oats, and ryegrass). Use
of herbicides, insecticides and
Soil properties
A total of 15 soil samples were collected using a Dutch auger in the 0.00-0.20 m layer around the spider collection points. The samples were homogenized to form a composite
sample for determination of carbon (C), nitrogen (N), sulfur (S), and hydrogen (H) by dry
combustion (Elementar Vario EL Cube®
with 99 % sensitivity). We also measured pH in water at a ratio of 1:1 v/v, potential acidity (SMP index), phosphorus (P), potassium (K), organic matter (OM), exchangeable aluminum (Al3+), calcium (Ca2+), magnesium (Mg2+),
potential acidity (H+Al), and cation exchange capacity (CEC) at pH 7.0, according to
Tedesco et al. (1995) (Table 2).
Undisturbed soil samples were taken next to each excavated site to collect spiders from a
0.20 × 0.20 m pit with a depth of 0.10 m. A 25-g portion of 4.75-8.88 mm aggregates was manually removed from samples of undisturbed soil cores and kept in closed plastic pots to avoid drying until the stability of the aggregates was determined by the wet sieving method of Kemper and Chepil (1965). Volumetric rings, 0.05 m in height, removed from the 0.025-0.075 m layer, were used to determine soil bulk density (Bd, biopore volume (Bio), microporosity (Micro), macroporosity (Macro), and total porosity (TP), as described in Claessen (1997). Resistance to penetration (RP) was measured with a Marconi® bench penetrometer, model MA-933, in the central portion of the soil samples contained in the volumetric rings, with a stable moisture content of 6 kPa (Table 2).
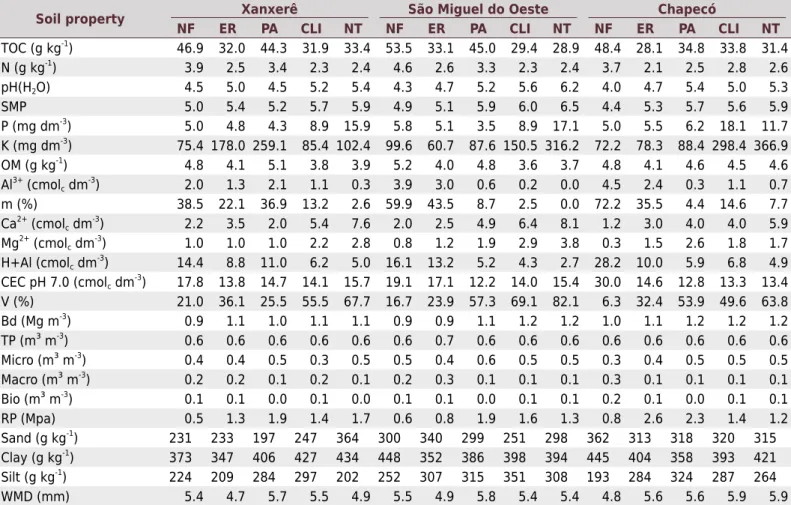
Table 2. Soil properties (0.00-0.20 m) under native forest (NF), eucalyptus reforestation (ER), pasture (PA), crop and livestock
integration (CLI), and no-tillage (NT) in Xanxerê (Xan), São Miguel do Oeste (SMO), and Chapecó (Cha)
Soil property Xanxerê São Miguel do Oeste Chapecó
NF ER PA CLI NT NF ER PA CLI NT NF ER PA CLI NT
TOC (g kg-1
) 46.9 32.0 44.3 31.9 33.4 53.5 33.1 45.0 29.4 28.9 48.4 28.1 34.8 33.8 31.4
N (g kg-1) 3.9 2.5 3.4 2.3 2.4 4.6 2.6 3.3 2.3 2.4 3.7 2.1 2.5 2.8 2.6
pH(H2O) 4.5 5.0 4.5 5.2 5.4 4.3 4.7 5.2 5.6 6.2 4.0 4.7 5.4 5.0 5.3
SMP 5.0 5.4 5.2 5.7 5.9 4.9 5.1 5.9 6.0 6.5 4.4 5.3 5.7 5.6 5.9
P (mg dm-3
) 5.0 4.8 4.3 8.9 15.9 5.8 5.1 3.5 8.9 17.1 5.0 5.5 6.2 18.1 11.7
K (mg dm-3) 75.4 178.0 259.1 85.4 102.4 99.6 60.7 87.6 150.5 316.2 72.2 78.3 88.4 298.4 366.9 OM (g kg-1
) 4.8 4.1 5.1 3.8 3.9 5.2 4.0 4.8 3.6 3.7 4.8 4.1 4.6 4.5 4.6
Al3+ (cmolc dm -3
) 2.0 1.3 2.1 1.1 0.3 3.9 3.0 0.6 0.2 0.0 4.5 2.4 0.3 1.1 0.7
m (%) 38.5 22.1 36.9 13.2 2.6 59.9 43.5 8.7 2.5 0.0 72.2 35.5 4.4 14.6 7.7
Ca2+ (cmolc dm -3
) 2.2 3.5 2.0 5.4 7.6 2.0 2.5 4.9 6.4 8.1 1.2 3.0 4.0 4.0 5.9
Mg2+
(cmolc dm -3
) 1.0 1.0 1.0 2.2 2.8 0.8 1.2 1.9 2.9 3.8 0.3 1.5 2.6 1.8 1.7
H+Al (cmolc dm-3) 14.4 8.8 11.0 6.2 5.0 16.1 13.2 5.2 4.3 2.7 28.2 10.0 5.9 6.8 4.9 CEC pH 7.0 (cmolc dm
-3
) 17.8 13.8 14.7 14.1 15.7 19.1 17.1 12.2 14.0 15.4 30.0 14.6 12.8 13.3 13.4
V (%) 21.0 36.1 25.5 55.5 67.7 16.7 23.9 57.3 69.1 82.1 6.3 32.4 53.9 49.6 63.8
Bd (Mg m-3
) 0.9 1.1 1.0 1.1 1.1 0.9 0.9 1.1 1.2 1.2 1.0 1.1 1.2 1.2 1.2
TP (m³ m-3
) 0.6 0.6 0.6 0.6 0.6 0.6 0.7 0.6 0.6 0.6 0.6 0.6 0.6 0.6 0.6
Micro (m³ m-3
) 0.4 0.4 0.5 0.3 0.5 0.5 0.4 0.6 0.5 0.5 0.3 0.4 0.5 0.5 0.5
Macro (m³ m-3
) 0.2 0.2 0.1 0.2 0.1 0.2 0.3 0.1 0.1 0.1 0.3 0.1 0.1 0.1 0.1
Bio (m³ m-3
) 0.1 0.1 0.0 0.1 0.0 0.1 0.1 0.0 0.1 0.1 0.2 0.1 0.0 0.1 0.1
RP (Mpa) 0.5 1.3 1.9 1.4 1.7 0.6 0.8 1.9 1.6 1.3 0.8 2.6 2.3 1.4 1.2
Sand (g kg-1
) 231 233 197 247 364 300 340 299 251 298 362 313 318 320 315
Clay (g kg-1
) 373 347 406 427 434 448 352 386 398 394 445 404 358 393 421
Silt (g kg-1
) 224 209 284 297 202 252 307 315 351 308 193 284 324 287 264
WMD (mm) 5.4 4.7 5.7 5.5 4.9 5.5 4.9 5.8 5.4 5.4 4.8 5.6 5.6 5.9 5.9
Total organic carbon (TOC); total nitrogen (N); pH in SMP solution (SMP); phosphorus (P); potassium (K) organic matter (OM); aluminum (Al); saturation by aluminum (m); calcium (Ca); magnesium (Mg); potential acidity (H+Al); cation exchange capacity at pH 7.0 (CEC pH 7.0); base saturation (V); soil
density (Ds); total porosity (TP); microporosity (Micro); macroporosity (Macro); resistance to penetration (RP); sand content (Sand); silt content (Silt);
clay content (Clay); and weighted mean diameter (WMD). Carbon and nitrogen determined by dry combustion; pH(H2O) at a ratio of 1:1 v/v; SMP, P, K,
OM, Al3+
, m%, Ca2+
, Mg2+, H+Al, CEC pH 7.0, and V (%) were determined according Tedesco et al. (1995); Bd, TP, Micro, Macro, and Bio were determined
as described in Claessen (1997); resistance to penetration (RP) was measured with a Marconi®
The physical and chemical properties were considered as explanatory environmental
variables, where the collinear soil variables were removed from the statistical model and later used to establish the correlation between them and the families of spiders in redundancy analysis (RDA) using the Canoco 4.5 program (ter Braak and Smilauer, 1998).
RESULTS
In all, 479 individuals were captured, distributed among 20 families, 40 genera, and eight named species (Table 3). The soil traps (Table 4) captured 37 morphospecies distributed among 19 families. The manual collection method yielded 28 morphospecies distributed among 13 families (Table 5). The two methods combined yielded 54 morphospecies
among 20 families (Table 3). Of the 20 families, six occurred exclusively in the traps, and
three in the manual collection group. Taken together, according to the abundance data of individuals captured by the manual collection methods and by the traps, the most frequent families in relation to the total number of captured individuals (479 individuals) were as follows: Linyphiidae (172 individuals or 35.9 %), Lycosidae (106 individuals or 22.1 %), Theridiidae (84 individuals or 17.5 %), Hahniidae (31 individuals or 6.5 %), Salticidae (16 individuals or 3.3 %), and Oonopidae (15 individuals or 3.1 %), representing 88.51 % of individuals captured (Table 3).
Although there were no significant differences in the Shannon-Wiener (H’) diversity values by the Tukey test at 5 %, there was a slight increase in H’ in NF between sampling
times (0.48 in winter and 0.41 in summer, table 3). The same behavior was observed for
the trap method, in which NF exhibited H’ values of 0.30 in winter and 0.36 in summer (Table 4). For manual collection, the values of H’ in NF were 0.03 during the winter and
0.06 during the summer (Table 5). The same trend occurred for families richness, where areas with lower levels of anthropogenic intervention such as NF and ER had the highest richness, and those with some level of management, such as PA, CLI, and NT had lower values of richness.
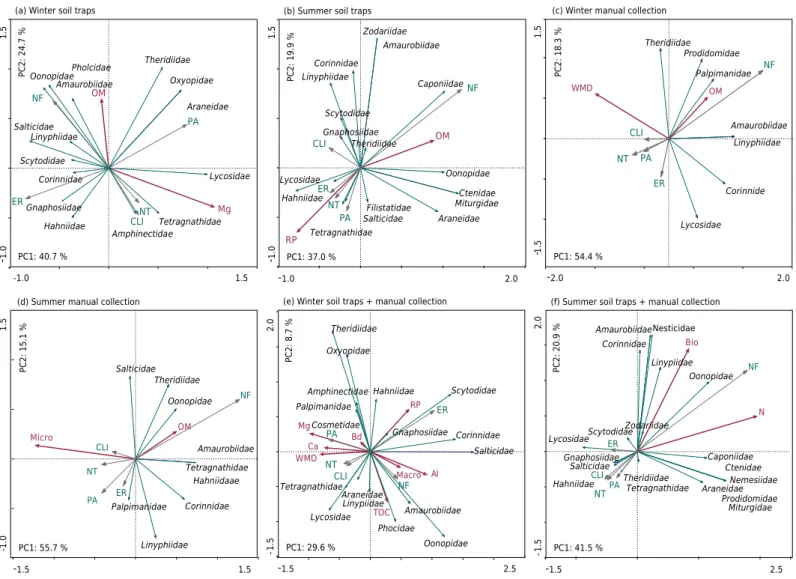
Principal component analysis separated soil use systems and spider families by the soil traps method (Figures 2a and 2b). Principal component 1 (PC1) accounted for 40.7 % and principal component 2 (PC2) accounted for 24.7 %, a total of 65.4 % of the total variation. There was high abundance of spider families in native forest (NF) and eucalyptus reforestation (ER) areas, whereas in systems with greater pasture management (PA), no-tillage annual crops (NT), and crop-livestock integration (CLI), there was a slight decrease in abundance (Figure 2a). The families Pholcidae, Oonopidae, Amaurobiidae, Salticidae, Linyphiidae, Scytodidae, Corinnidae, Gnaphosidae, and Hahniidae were more related to systems with lower levels of anthropogenic intervention, whereas Theridiidae, Oxyopidae, Araneidae, Lycosidae, Tetragnathidae, and Amphinectidae were more related to land use systems with some type of anthropic intervention (PA, CLI, and NT).
During the summer, the families of spiders collected in soil traps had a different composition
(Figure 2b). Caponiidae, Amaurobiidae, Zodariidae, Oonopidae, Ctenidae, and Miturgidae were present only in NF (Table 4) and the families Corinnidae, Linyphiidae, Scytodidae, and Gnaphosidae were more strongly related with CLI, since a smaller proportion of families, such as Lycosidae, Hahniidae, Tetragnathidae, Salticidae, and Filistatidae were
present only in ER, PA, and NT; PCA explained 56.9 % of this variation - 37.0 % for PC1
and 19.9 % for PC2.
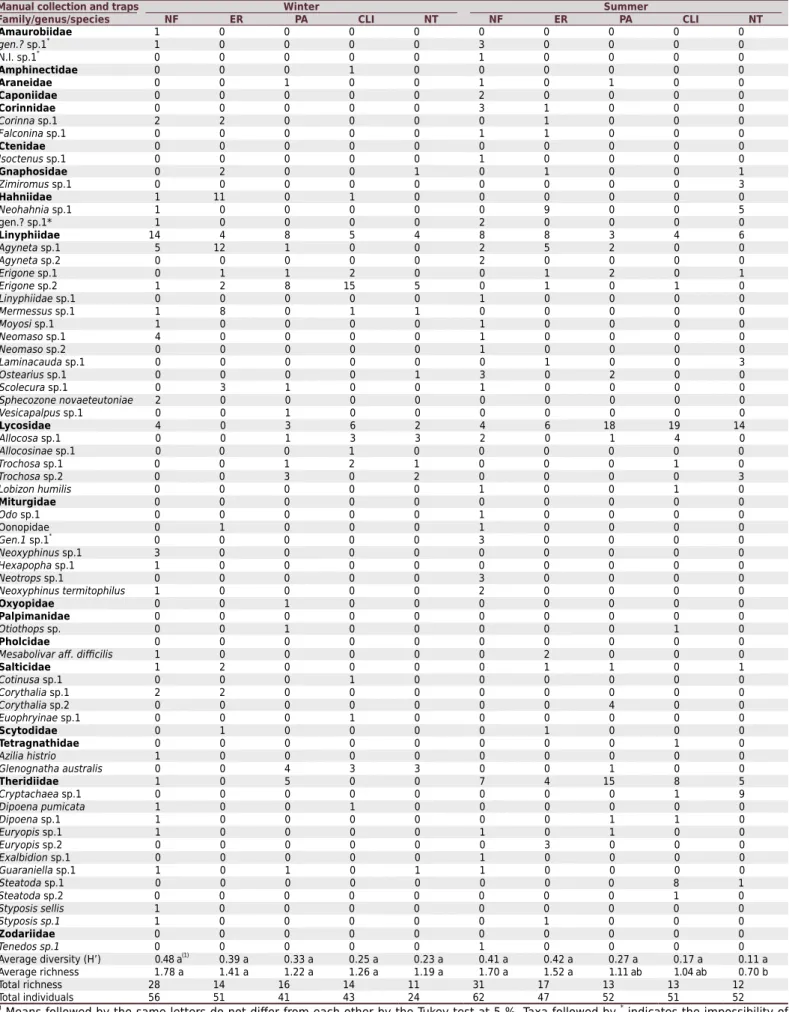
Table 3. The total number of individuals (spider families) caught in western Santa Catarina by the combination of two sampling methods (manual collection and soil traps) in two contrasting seasons (winter and summer) in native forest (NF), eucalyptus reforestation (ER), pasture (PA), crop-livestock integration (CLI), and no-tillage annual crop (NT)
Manual collection and traps Winter Summer
Family/genus/species NF ER PA CLI NT NF ER PA CLI NT
Amaurobiidae 1 0 0 0 0 0 0 0 0 0
gen.? sp.1*
1 0 0 0 0 3 0 0 0 0
N.I. sp.1*
0 0 0 0 0 1 0 0 0 0
Amphinectidae 0 0 0 1 0 0 0 0 0 0
Araneidae 0 0 1 0 0 1 0 1 0 0
Caponiidae 0 0 0 0 0 2 0 0 0 0
Corinnidae 0 0 0 0 0 3 1 0 0 0
Corinna sp.1 2 2 0 0 0 0 1 0 0 0
Falconina sp.1 0 0 0 0 0 1 1 0 0 0
Ctenidae 0 0 0 0 0 0 0 0 0 0
Isoctenus sp.1 0 0 0 0 0 1 0 0 0 0
Gnaphosidae 0 2 0 0 1 0 1 0 0 1
Zimiromus sp.1 0 0 0 0 0 0 0 0 0 3
Hahniidae 1 11 0 1 0 0 0 0 0 0
Neohahnia sp.1 1 0 0 0 0 0 9 0 0 5
gen.? sp.1* 1 0 0 0 0 2 0 0 0 0
Linyphiidae 14 4 8 5 4 8 8 3 4 6
Agyneta sp.1 5 12 1 0 0 2 5 2 0 0
Agyneta sp.2 0 0 0 0 0 2 0 0 0 0
Erigone sp.1 0 1 1 2 0 0 1 2 0 1
Erigone sp.2 1 2 8 15 5 0 1 0 1 0
Linyphiidae sp.1 0 0 0 0 0 1 0 0 0 0
Mermessus sp.1 1 8 0 1 1 0 0 0 0 0
Moyosi sp.1 1 0 0 0 0 1 0 0 0 0
Neomaso sp.1 4 0 0 0 0 1 0 0 0 0
Neomaso sp.2 0 0 0 0 0 1 0 0 0 0
Laminacauda sp.1 0 0 0 0 0 0 1 0 0 3
Ostearius sp.1 0 0 0 0 1 3 0 2 0 0
Scolecura sp.1 0 3 1 0 0 1 0 0 0 0
Sphecozone novaeteutoniae 2 0 0 0 0 0 0 0 0 0
Vesicapalpus sp.1 0 0 1 0 0 0 0 0 0 0
Lycosidae 4 0 3 6 2 4 6 18 19 14
Allocosa sp.1 0 0 1 3 3 2 0 1 4 0
Allocosinae sp.1 0 0 0 1 0 0 0 0 0 0
Trochosa sp.1 0 0 1 2 1 0 0 0 1 0
Trochosa sp.2 0 0 3 0 2 0 0 0 0 3
Lobizon humilis 0 0 0 0 0 1 0 0 1 0
Miturgidae 0 0 0 0 0 0 0 0 0 0
Odo sp.1 0 0 0 0 0 1 0 0 0 0
Oonopidae 0 1 0 0 0 1 0 0 0 0
Gen.1 sp.1*
0 0 0 0 0 3 0 0 0 0
Neoxyphinus sp.1 3 0 0 0 0 0 0 0 0 0
Hexapopha sp.1 1 0 0 0 0 0 0 0 0 0
Neotrops sp.1 0 0 0 0 0 3 0 0 0 0
Neoxyphinus termitophilus 1 0 0 0 0 2 0 0 0 0
Oxyopidae 0 0 1 0 0 0 0 0 0 0
Palpimanidae 0 0 0 0 0 0 0 0 0 0
Otiothops sp. 0 0 1 0 0 0 0 0 1 0
Pholcidae 0 0 0 0 0 0 0 0 0 0
Mesabolivar aff. difficilis 1 0 0 0 0 0 2 0 0 0
Salticidae 1 2 0 0 0 0 1 1 0 1
Cotinusa sp.1 0 0 0 1 0 0 0 0 0 0
Corythalia sp.1 2 2 0 0 0 0 0 0 0 0
Corythalia sp.2 0 0 0 0 0 0 0 4 0 0
Euophryinae sp.1 0 0 0 1 0 0 0 0 0 0
Scytodidae 0 1 0 0 0 0 1 0 0 0
Tetragnathidae 0 0 0 0 0 0 0 0 1 0
Azilia histrio 1 0 0 0 0 0 0 0 0 0
Glenognatha australis 0 0 4 3 3 0 0 1 0 0
Theridiidae 1 0 5 0 0 7 4 15 8 5
Cryptachaea sp.1 0 0 0 0 0 0 0 0 1 9
Dipoena pumicata 1 0 0 1 0 0 0 0 0 0
Dipoena sp.1 1 0 0 0 0 0 0 1 1 0
Euryopis sp.1 1 0 0 0 0 1 0 1 0 0
Euryopis sp.2 0 0 0 0 0 0 3 0 0 0
Exalbidion sp.1 0 0 0 0 0 1 0 0 0 0
Guaraniella sp.1 1 0 1 0 1 1 0 0 0 0
Steatoda sp.1 0 0 0 0 0 0 0 0 8 1
Steatoda sp.2 0 0 0 0 0 0 0 0 1 0
Styposis sellis 1 0 0 0 0 0 0 0 0 0
Styposis sp.1 1 0 0 0 0 0 1 0 0 0
Zodariidae 0 0 0 0 0 0 0 0 0 0
Tenedos sp.1 0 0 0 0 0 1 0 0 0 0
Average diversity (H’) 0.48 a(1)
0.39 a 0.33 a 0.25 a 0.23 a 0.41 a 0.42 a 0.27 a 0.17 a 0.11 a
Average richness 1.78 a 1.41 a 1.22 a 1.26 a 1.19 a 1.70 a 1.52 a 1.11 ab 1.04 ab 0.70 b
Total richness 28 14 16 14 11 31 17 13 13 12
Total individuals 56 51 41 43 24 62 47 52 51 52
(1) Means followed by the same letters do not differ from each other by the Tukey test at 5 %. Taxa followed by *
indicates the impossibility of
In the summer, by the manual collection method (Figure 2d), Theridiidae, Oonopidae, Amaurobiidae, Tetragnathidae, Hahniidae, and Corinnidae were more abundant in NF. In the land use systems where the level of anthropic intervention was greater, the frequency of spiders was low. The Salticidae family had a greater relationship with CLI, whereas the families Linyphiidae and Palpimanidae with ER; the clear distinction between
the occurrence of determined families in the land use systems is explained by PC1 at
55.7 % and by PC2 at 15.1 %, for a total of 70.8 % of the total variation.
When abundance values were added for the two methods (soil traps and manual collection) (Figures 2e and 2f) and analyzed by PCA, some families maintained associations with the land
use systems, regardless of the sampling method. For example, Oonopidae and Amaurobiidae were captured only in areas of NF (Table 3). In addition, there was a considerable increase in the number of families between sampling times, with 17 families in the summer and 19 in the winter, compared to 15 families in the winter and 16 families in the summer captured using soil traps (Figures 2a and 2b) and 8 and 9 using the manual method (Figures 2c and 2d).
Redundancy analysis (RDA) showed that of all the physical and chemical properties, only a few were strongly associated with some spider families. For soil traps (Figures 3a and 3b), organic matter content (OM) was correlated with Amaurobiidae, Theridiidae, Oonopidae, Pholcidae, Linyphiidae, and Corinnidae. Magnesium contents correlated mainly with Tetragnathidae and Lycosidae. During summer, resistance to penetration (RP) showed high correlation with the families Gnaphosiidae, Salticidae, Theridiidae, and Tetragnathidae, whereas OM showed a strong relation to Ctenidae, Miturgidae, Oonopidae, Araneidae and Filistatidae.
For the manual collection method, the geometric mean diameter (GMD) of the aggregates showed correlation with Theridiidae and Prodidomidae, and OM contents correlated with Palpimanidae and Prodidomidae. During the summer, OM was the property most correlated with the majority spider families (Figures 3a, 3b, 3c, and 3d). Redundancy analysis performed on the two sampling methods showed an increase in the number of physical and chemical variables selected by the statistical model, thus allowing greater reliability in the results. Among the 24 physical and chemical variables analyzed (Table 2), only 13 were among those that most correlated with the spider families: resistance to penetration (RP), bulk density (Bd), macroporosity (Macro), biopores (Bio), mean weight-diameter (MWD), water content (moisture), Ca, Mg, and K, which had high values in the agricultural production sites (CLI and NT); total organic carbon (TOC), soil organic matter (OM), aluminum (Al) and nitrogen (N) contents, in NF.
DISCUSSION
The diversity of spider families was inversely proportional to the intensity of land use. This result is related to the biological regulator role of spiders, which are conditioned to
the biological complexity in various ecological niches, whether soil or surface litter, and
in the interaction between these two (Liu et al., 2015a,b). In this respect, native forest (NF) had the highest spider diversity, regardless of the sampling period, possibly due to the vegetation, which maintains the microclimate and moisture/humidity, as well as the diversity of microhabitats at this site (Malumbres-Olarte et al., 2013). The ecological stability in natural vegetation favors accumulation of surface litter in quantity and quality. In addition, various soil organisms that are attracted by the diversity of plant residues, become potential prey for spiders. Thus, the OM contents (Figures 3a, 3b, 3c, and 3d) become an indirect conditioner for greater abundance of spider families.
The population fluctuations observed in agroecosystems are due to seasonality in soil conditions, as well as modification in plant structure, which may be designated as
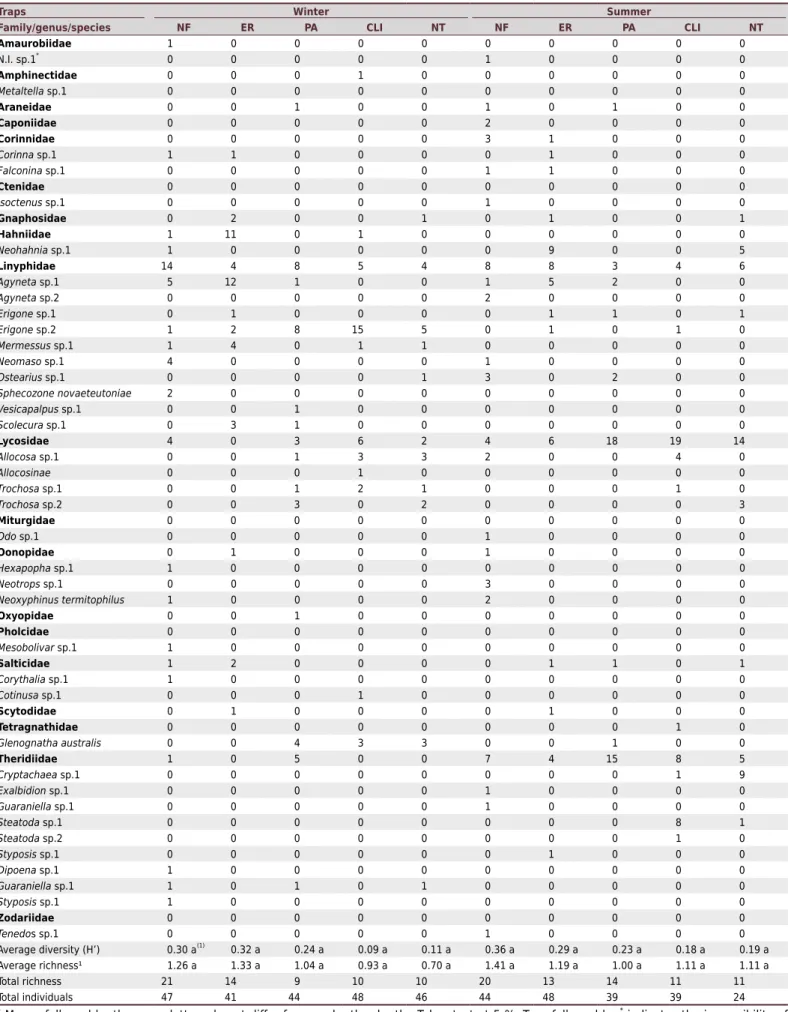
Table 4. Total number of individuals (spider families) caught in western Santa Catarina in soil traps in two contrasting seasons (winter and summer) in native forest (NF), eucalyptus reforestation (ER), pasture (PA), crop-livestock integration (CLI), and no-tillage annual crops (NT)
Traps Winter Summer
Family/genus/species NF ER PA CLI NT NF ER PA CLI NT
Amaurobiidae 1 0 0 0 0 0 0 0 0 0
N.I. sp.1*
0 0 0 0 0 1 0 0 0 0
Amphinectidae 0 0 0 1 0 0 0 0 0 0
Metaltella sp.1 0 0 0 0 0 0 0 0 0 0
Araneidae 0 0 1 0 0 1 0 1 0 0
Caponiidae 0 0 0 0 0 2 0 0 0 0
Corinnidae 0 0 0 0 0 3 1 0 0 0
Corinna sp.1 1 1 0 0 0 0 1 0 0 0
Falconina sp.1 0 0 0 0 0 1 1 0 0 0
Ctenidae 0 0 0 0 0 0 0 0 0 0
Isoctenus sp.1 0 0 0 0 0 1 0 0 0 0
Gnaphosidae 0 2 0 0 1 0 1 0 0 1
Hahniidae 1 11 0 1 0 0 0 0 0 0
Neohahnia sp.1 1 0 0 0 0 0 9 0 0 5
Linyphidae 14 4 8 5 4 8 8 3 4 6
Agyneta sp.1 5 12 1 0 0 1 5 2 0 0
Agyneta sp.2 0 0 0 0 0 2 0 0 0 0
Erigone sp.1 0 1 0 0 0 0 1 1 0 1
Erigone sp.2 1 2 8 15 5 0 1 0 1 0
Mermessus sp.1 1 4 0 1 1 0 0 0 0 0
Neomaso sp.1 4 0 0 0 0 1 0 0 0 0
Ostearius sp.1 0 0 0 0 1 3 0 2 0 0
Sphecozone novaeteutoniae 2 0 0 0 0 0 0 0 0 0
Vesicapalpus sp.1 0 0 1 0 0 0 0 0 0 0
Scolecura sp.1 0 3 1 0 0 0 0 0 0 0
Lycosidae 4 0 3 6 2 4 6 18 19 14
Allocosa sp.1 0 0 1 3 3 2 0 0 4 0
Allocosinae 0 0 0 1 0 0 0 0 0 0
Trochosa sp.1 0 0 1 2 1 0 0 0 1 0
Trochosa sp.2 0 0 3 0 2 0 0 0 0 3
Miturgidae 0 0 0 0 0 0 0 0 0 0
Odo sp.1 0 0 0 0 0 1 0 0 0 0
Oonopidae 0 1 0 0 0 1 0 0 0 0
Hexapopha sp.1 1 0 0 0 0 0 0 0 0 0
Neotrops sp.1 0 0 0 0 0 3 0 0 0 0
Neoxyphinus termitophilus 1 0 0 0 0 2 0 0 0 0
Oxyopidae 0 0 1 0 0 0 0 0 0 0
Pholcidae 0 0 0 0 0 0 0 0 0 0
Mesobolivar sp.1 1 0 0 0 0 0 0 0 0 0
Salticidae 1 2 0 0 0 0 1 1 0 1
Corythalia sp.1 1 0 0 0 0 0 0 0 0 0
Cotinusa sp.1 0 0 0 1 0 0 0 0 0 0
Scytodidae 0 1 0 0 0 0 1 0 0 0
Tetragnathidae 0 0 0 0 0 0 0 0 1 0
Glenognatha australis 0 0 4 3 3 0 0 1 0 0
Theridiidae 1 0 5 0 0 7 4 15 8 5
Cryptachaea sp.1 0 0 0 0 0 0 0 0 1 9
Exalbidion sp.1 0 0 0 0 0 1 0 0 0 0
Guaraniella sp.1 0 0 0 0 0 1 0 0 0 0
Steatoda sp.1 0 0 0 0 0 0 0 0 8 1
Steatoda sp.2 0 0 0 0 0 0 0 0 1 0
Styposis sp.1 0 0 0 0 0 0 1 0 0 0
Dipoena sp.1 1 0 0 0 0 0 0 0 0 0
Guaraniella sp.1 1 0 1 0 1 0 0 0 0 0
Styposis sp.1 1 0 0 0 0 0 0 0 0 0
Zodariidae 0 0 0 0 0 0 0 0 0 0
Tenedos sp.1 0 0 0 0 0 1 0 0 0 0
Average diversity (H’) 0.30 a(1)
0.32 a 0.24 a 0.09 a 0.11 a 0.36 a 0.29 a 0.23 a 0.18 a 0.19 a
Average richness¹ 1.26 a 1.33 a 1.04 a 0.93 a 0.70 a 1.41 a 1.19 a 1.00 a 1.11 a 1.11 a
Total richness 21 14 9 10 10 20 13 14 11 11
Total individuals 47 41 44 48 46 44 48 39 39 24
(1) Means followed by the same letters do not differ from each other by the Tukey test at 5 %. Taxa followed by *
indicates the impossibility of
Table 5. The total number of individuals (spider families) captured in western Santa Catarina by manual capture in soil monoliths in two contrasting seasons (winter and summer) in native forest (NF), eucalyptus reforestation (ER), pasture (PA), crop-livestock integration (CLI), and no-tillage annual crops (NT)
Manual collection from
soil monoliths Winter Summer
Family/genus/species NF ER PA CLI NT NF ER PA CLI NT
Amaurobiidae 0 0 0 0 0 0 0 0 0 0
gen.? sp.1*
1 0 0 0 0 3 0 0 0 0
Corinnidae 0 0 0 0 0 0 0 0 0 0
Corinna sp.1 1 1 0 0 0 0 0 0 0 0
Gnaphosidae 0 0 0 0 0 0 0 0 0 0
Zimiromus sp.1 0 0 0 0 0 0 0 0 0 3
Hahniidae 0 0 0 0 0 0 0 0 0 0
gen.? sp.1* 1 0 0 0 0 2 0 0 0 0
Linyphiidae 0 0 0 0 0 0 0 0 0 0
Agyneta sp.1 0 0 0 0 0 1 0 0 0 0
Erigone sp.1 0 0 1 2 0 0 0 1 0 0
Linyphiidae sp.1 0 0 0 0 0 1 0 0 0 0
Mermessus sp.1 0 4 0 0 0 0 0 0 0 0
Moyosi sp.1 1 0 0 0 0 1 0 0 0 0
Neomaso sp.2 0 0 0 0 0 1 0 0 0 0
Laminacauda sp.1 0 0 0 0 0 0 1 0 0 3
Scolecura sp.1 0 0 0 0 0 1 0 0 0 0
Lycosidae 0 0 0 0 0 0 0 0 0 0
Allocosa sp.1 0 0 0 0 0 0 0 1 0 0
Lobizon humilis 0 0 0 0 0 1 0 0 1 0
Oonopidae 0 0 0 0 0 0 0 0 0 0
Gen.1 sp.1*
0 0 0 0 0 3 0 0 0 0
Neoxyphinus sp.1 3 0 0 0 0 0 0 0 0 0
Palpimanidae 0 0 0 0 0 0 0 0 0 0
Otiothops sp. 0 0 1 0 0 0 0 0 1 0
Pholcidae 0 0 0 0 0 0 0 0 0 0
Mesabolivar aff. difficilis 0 0 0 0 0 0 2 0 0 0
Prodidomidae 0 0 0 0 0 0 0 0 0 0
Gen.1 sp.1*
0 0 0 0 0 0 0 0 1 0
Salticidae 0 0 0 0 0 0 0 0 0 0
Corythalia sp.1 1 2 0 0 0 0 0 0 0 0
Corythalia sp.2 0 0 0 0 0 0 0 4 0 0
Euophryinae sp.1 0 0 0 1 0 0 0 0 0 0
Tetragnathidae 0 0 0 0 0 0 0 0 0 0
Azilia histrio 1 0 0 0 0 0 0 0 0 0
Theridiidae 0 0 0 0 0 0 0 0 0 0
Dipoena pumicata 1 0 0 1 0 0 0 0 0 0
Dipoena sp.1 0 0 0 0 0 0 0 1 1 0
Euryopis sp.1 1 0 0 0 0 1 0 1 0 0
Euryopis sp.2 0 0 0 0 0 0 3 0 0 0
Styposis sellis 1 0 0 0 0 0 0 0 0 0 Average diversity (H’) 0.03 a(1)
0.03 a 0.00 a 0.00 a 0.00 a 0.06 a 0.00 a 0.02 a 0.00 a 0.00 a
Average richness 0.19 a 0.07 a 0.04 a 0.11 a 0.00 a 0.41 a 0.22 a 0.22 a 0.15 a 0.07 a
Total richness 10 3 2 3 0 10 3 5 4 2
Total individuals 12 7 2 4 0 15 6 8 4 6
(1) Means followed by the same letters do not differ from each other by the Tukey test at 5 %. Taxa followed by *
indicates the impossibility of
such as input application, machine traffic, and alteration of vegetation, which may be
critical stress factors for the spider communities established there.
These practices alter the structure of the prey community; species more sensitive to such changes are forced to migrate to other sites and species less-dependent on environmental resources remain. Stenroth et al. (2015) found strong association of the Linyphiidae family with agricultural areas when evaluating the relationships between riparian predators and aquatic insect distribution patterns. This partially corroborates our results, since this family was more associated with CLI areas (Figure 2b) and ER (Figure 2d) during the summer. It is noteworthy that there was no distribution pattern of this family among the land use systems, suggesting that these individuals migrate according to the availability of resources in the sampling time, since during the winter Linyphiidae was more associated with NF.
Association of Lycosidae with agricultural areas was reported by Stenroth et al. (2015), corroborating our results. Individuals of this family were mostly collected in areas of NT (Figure 2a), CLI (Figures 2b and 2e), and ER (Figure 2d). Environmental stress factors, together with global climate change, can be a critical factor in loss of biodiversity (Mantyka-Pringle et al., 2015). The relationship between spider diversity and vegetation type has already been reported by Baldissera et al. (2008), especially in araucaria and eucalyptus areas.
Figure 2. Principal component analysis (PCA) for spider families (in italics) and environmental variables (in red) in native forest systems (NF), eucalyptus reforestation (ER), pasture (PA), crop-livestock integration (CLI), and no-tillage annual crops (NT) in western Santa Catarina in two seasons: winter and summer. Two methods of collection (traps and manual collection). OM = organic matter; Mg = magnesium; RP = resistance to root penetration; WMD = weighted mean diameter; Micro = microporosity; Macro = macroporosity; COT = total organic carbon; Al = aluminum; Bd = soil bulk density; Ca = calcium; Bio = biopores; N = nitrogen; PC1 = main component 1; PC2 = main component 2.
(a) Winter soil traps
(d) Summer manual collection
-1.0 1.5 -1. 01 .5 Amaurobiidae Amphinectidae Araneidae Corinnidae Hahniidae Linyphiidae Lycosidae OonopidaePholcidae Oxyopidae
Salticidae Scytodidae Tetragnathidae Theridiidae OM Mg NF ER PA CLINT
-1.5 1.5
-1.0 1. 5 Amaurobiidae Corinnidae Hahniidaae Linyphiidae Oonopidae Palpimanidae Salticidae Theridiidae Tetragnathidae OM Micro NF ER PA CLI NT
PC1: 40.7 %
PC2:
24.7
%
PC1: 55.7 %
PC2: 15.1
%
(b) Summer soil traps
-1.0 2.0
-1. 01 .5 Amaurobiidae Araneidae Caponiidae Corinnidae Ctenidae Filistatidae Gnaphosiidae Linyphiidae Lycosidae Miturgidae Oonopidae Salticidae Scytodidae Tetragnathidae Theridiidae Zodariidae OM RP NF ER PA CLI NT
PC1: 37.0 %
PC2: 19.9
%
Hahniidae Gnaphosiidae
(c) Winter manual collection
-2.0 2.0
-1.51
.5 Amaurobiidae Corinnide Linyphiidae Lycosidae Palpimanidae Theridiidae Prodidomidae OM WMD NF ER PA CLI NT
PC1: 54.4 %
PC2: 18.3 % TOC Al Ca Mg Bd Macro RP WMD
(e) Winter soil traps + manual collection
-1.5 2.5
-1 .5 2. 0 Amaurobiidae Amphinectidae Araneidae Corinnidae Cosmetidae Gnaphosiidae Hahniidae Linypiidae Lycosidae Oonopidae Oxyopidae Palpimanidae Phocidae Salticidae Scytodidae Tetragnathidae Theridiidae NF ER PA CLI NT
PC1: 29.6 %
PC2:
8.7 %
(f) Summer soil traps + manual collection
-1.5 2.5
-1 .5 2. 0 Amaurobiidae Araneidae Caponiidae Corinnidae Ctenidae Gnaphosiidae Hahniidae Lycosidae Miturgidae Nemesiidae Nesticidae Oonopidae Prodidomidae Salticidae Scytodidae Tetragnathidae Theridiidae N Bio NF ER PA CLI NT
PC1: 41.5 %
PC2: 20.9
%
The low spider diversity (H’) found in CLI (Tables 2, 3, and 4) may be related to the low floristic diversity (Malumbres-Olarte et al., 2013), as well to the introduction of cattle,
which, in addition to changing the soil physical properties, such as soil bulk density (Bd) and resistance to penetration (RP), may also indirectly collaborate as a limiting factor in the establishment of spiders, especially due to the fact that animal trampling in PA and CLI increase RP by compaction, which possibly hinders the establishment of other soil organisms (potential prey) and reduces the supply of food to spiders. In this sense, Kajak et al. (1999) demonstrated that Bd was one of the factors responsible for reduction in spiders in pasture
areas, and that soil moisture also affected the diversity of these organisms.
It should be noted that the areas with lower plant diversity (ER and PA), regardless of sampling method and time, had low spider diversity (<0.5). This animal prefers areas with greater diversity of plant residues (Baretta et al., 2007). In an ecological study, it was demonstrated that successional stage of the plant community delimited microhabitats
favorable to spiders, explaining the preference of these organisms for areas with a lower degree of human intervention (Hemm and Höfer, 2012).
The sensitivity of spiders to soil management responses was studied by Lafage and Pétillon (2014), who found a high short-term response in the management of pasture areas in the west of France, with Lycosidae as the most prevalent family in all locations sampled. This partially corroborates our results, in which this family represented 22.1 %
Figure 3. Redundancy analysis (RDA) for spider families (in italics) and environmental variables (in red) in western Santa Catarina in two seasons: winter and summer. Two methods of collection (traps and manual collection); OM = organic matter; Mg = magnesium; RP = resistance to root penetration; WMD = weighted mean diameter; Micro = microporosity; Macro = macroporosity; TOC = total organic carbon; Al = aluminum; Bd = soil bulk density; Ca = calcium; Bio = biopores; N = nitrogen; Moisture = soil moisture.
-0.6 0.6 -0 .6 0.6 Amphinectidae Araneidae Corinnidae Gnaphosiidae Hahniidae Linyphiinidae Lycosidae Oonopidae Oxyopidae Pholcidae Salticidae Scytodidae Tetragnathidae Theridiidae OM Mg Amaurobiidae
(a) Winter soil traps
-0.8 0.8 -0 .6 0.8 Amaurobiidae Araneidae Caponiidae Corinnidae Ctenidae Filistatidae Gnaphosiidae Hahniidae Linyphiidae Lycosidae Miturgidae Oonopidae Salticidae Scytodidae Tetragnathidae Theridiidae Zodariidae OM RP
(b) Summer soil traps
-0.8 0.8 -0 .8 0.8 Amaurobiidae Corinnidae Linyphiidae Lycosidae Palpimaniade Theridiidae Prodidomidae OM WMD
(c) Winter manual collection
-0.8 0.8 -0 .6 0.6 Amaurobiidae Corinnidae Hahniidae Linyphiidae Oonopidae Palpimanidae Salticidae Theridiidae Tetragnathidae OM Micro
(d) Summer manual collection
-1.0 1.5 -1. 01 .0 Amaurobiidae Amphinectidae Cosmetidae Hahniidae Lycosidae Scytodidae Theridiidae TOC Al Ca Mg Bd Macro RP WMD Araneidae Oxyopidae Tetragnathidae Corinnidae Gnaphosiidae Linypiidae Oonopidae Palpimanidae Phocidae Salticidae
(e) Winter soil traps + manual collection
-0.4 0.8 -0. 50 .6 Araneidae Caponiidae Corinnidae Gnaphosiidae Hahniidae Linypiidae Lycosidae Miturgidae Nemesiidae Oonopidae Prodidomae Salticidae Scytodidae Tetragnathidae
Theridiidae Zodariidae N
Al Moisture Ds Micro Bio Ctenidae Nesticidae Amaurobiidae
of the total individuals collected. Management conditions were the main causes of the reduction in spider diversity in another study conducted by Alcayaga et al. (2013), especially through disorganization of vegetation and soil moisture. In Brazil, Baretta et al. (2007) showed that drastic events, such as accidental burning in araucaria and pasture
areas in the State of São Paulo, affected the diversity of spider families.
Considering the scale of human intervention that was established, NF is considered the most conserved environment, and NT the condition with the highest interference of use. Thus, some families were more associated with environments with a lower level of intervention, such as Oonopidae, which was more associated with NF areas, as reported
by Lo-Man-Hung et al. (2011).
One of the major limitations in assessing spider biodiversity is related to the metrics used (Aubin et al., 2013). Most studies have used a small number of samples and only a single method for capturing the biodiversity of a given group, not taking environmental variables into account. The considerable number of spider families captured in soil traps would be a good point of departure for understanding the structure of the spider community.
However, this method is more associated with families that are less demanding in terms
of environmental variables and that inhabit several niches of the environments, whether soil or surface litter.
Some authors indicate that the plant composition of the site evaluated creates a favorable
habitat structure for spider development (D’Alberto et al., 2012; Rodriguez-Artigas et al.,
2016). Spiders are dependent on a well-established trophic chain, and therefore need to actively forage, regardless of their feeding strategy. Thus, it is understood that an
environment with diversified plant structure attracts other organisms that will serve as prey for spiders. This confirms the great diversity of spiders in the scale of intensity of human
interference between native forest (NF), as the most stable and biodiverse environment, and no-tillage annual crops (NT), as the least stable and with the lowest diversity of spiders. The low richness and abundance of spiders captured by the manual collection method,
especially in NT, reflects the main limitation of the method: capture of spiders that are
strictly in the soil, that is, that only forage the soil and surface litter, such as Palpimanidae. They were found only in the collections that used the manual collection method. Moreover,
the soil traps were not effective for this family, since, in general, this family does not
travel long distances in search of food. This behavior has already been reported by Cerveira and Jackson (2005) when evaluating the predatory behavior of Palpimanus spp. when disturbed. These spiders tend to move little and remain inactive. In this sense, low mobility facilitated capture through manual collection.
Although the manual collection method is internationally recognized, and its effectiveness
has been tested for soil organisms, sampling amplitude for spiders is greater when combined with soil traps, mainly because they increase the number and diversity of individuals captured, providing greater information for interpretation of the ecological niches in which they are found. The ecological role of spiders stands out as determinants in control of the food chain and, therefore, for overall assessment of species, it is necessary that all niches of the ecosystem, whether terrestrial or arboreal, be sampled using both sampling methods (manual capture and soil traps) (Figures 2e and 2f).
This combined sampling condition may not address the basic assumptions of quantitative
or qualitative methods, such as the impossibility of extrapolating the number of individuals
per square meter collected by the soil trap method, as results coming from the manual
collection method are usually expressed. When uniting the two sampling methods, such extrapolation is not possible. A new conception of sampling directed toward the
biodiversity of soil organisms is needed so as to increase the number of spider families
collected, and thus increase knowledge about this taxon in the areas sampled, in such
It is necessary to reiterate that greater refinement in taxonomic information (greater
number of species), correlated with soil physical and chemical properties, can improve the use of spider populations as sensible indicators to guide management practices. According to this, higher spider biodiversity can be related with land uses that increase some soil properties, such as organic matter, biopores, macroporosity, Ca2+, and Mg2+.
CONCLUSIONS
The native forest has greater diversity of spiders. In the areas of no-tillage annual crops,
there is a drastic reduction of individuals in the sample, which indicates a negative effect
of the intensity of land use on spider biodiversity.
Use and management of the soil condition specific families of spiders, revealing
Lycosidae as more resistant to environmental impacts and others, such as Oonopidae and Amaurobiidae, as more sensitive.
Soil traps are more sensitive to spider families that inhabit the soil surface, whereas the manual collection method is more sensitive to soil-dwelling organisms (edaphic sensu stricto). The eucalyptus reforestation, pasture, and no-tillage annual crop areas showed low abundance of spider families, selecting only families less demanding in terms of environmental resources, such as Salticidade and Lycosidae.
It is recommended that both sampling methods be used to capture the greatest diversity of
spider families, making inventory and monitoring work more effective and comprehensive.
ACKNOWLEDGMENTS
The authors thank the Foundation for Support for Research and Innovation of the State of Santa Catarina - FAPESC (Process 6.309/2011-6/FAPESC) and the National Council for
Scientific and Technological Development - CNPq (Process: 563251/2010-7/CNPq). D.B.
thanks the CNPq for a Research Productivity Grant (CNPq No. 307162/2015-0) and A.D.B. is grateful for the scholarship granted (CNPq-301776/2004-0 and FAPESP 2011/50689-0)
REFERENCES
Alcayaga OE, Pizarro-Araya J, Alfaro FM, Cepeda-Pizarro J. Arañas (Arachnida, Araneae) asociadas a agroecosistemas en el Valle de Elqui (Región de Coquimbo, Chile). Rev Colomb Entomol. 2013;39:150-4.
Anderson JM, Ingram JSI. Tropical soil biology and fertility: a handbook of methods. 2nd ed. Wallingford: CAB International; 1993.
Aubin I, Venier L, Pearce J, Moretti M. Can a trait-based multi-taxa approach improve our assessment of forest management impact on biodiversity? Biodivers Conserv. 2013;22:2957-75. https://doi.org/10.1007/s10531-013-0565-6
Baldissera R, Ganade G, Brescovit AD, Hartz SM. Landscape mosaic of Araucaria forest and forest monocultures influencing understorey spider assemblages in southern Brazil. Austral Ecol. 2008;33:45-54. https://doi.org/10.1111/j.1442-9993.2007.01789.x
Baretta D, Brescovit AD, Knysak I, Cardoso EJBN. Trap and soil monolith sampled edaphic spiders (Arachnida: Araneae) in Araucaria angustifolia forest. Sci Agric. 2007a;64:375-83. https://doi.org/10.1590/S0103-90162007000400008
Bartz MLC, Brown GG, Rosa MG, Klauberg Filho O, James SW, Decaëns T, Baretta D. Earthworm richness in land-use systems in Santa Catarina, Brazil. Appl Soil Ecol. 2014a;83:59-70.
https://doi.org/10.1016/j.apsoil.2014.03.003
Borges PAV, Wunderlich J. Spider biodiversity patterns and their conservation in the Azorean archipelago, with descriptions of new species. Syst Biodivers. 2008;6:249-82. https://doi.org/10.1017/S1477200008002648
Castro A, Wise DH. Influence of fallen coarse woody debris on the diversity and community structure of forest-floor spiders (Arachnida: Araneae). Forest Ecol Manag. 2010;260:2088-101. https://doi.org/10.1016/j.foreco.2010.08.051
Cerveira AM, Jackson RR. Specialised predation by Palpimanus sp. (Araneae: Palpimanidae) on jumping spiders (Araneae: Salticidae). J East Afr Nat Hist. 2005;94:303-17.
https://doi.org/10.2982/0012-8317(2005)94[303:SPBPSA]2.0.CO;2
Chatterjee S, Isaia M, Venturino E. Spiders as biological controllers in the agroecosystem. J Theor Biol. 2009;258:352-62. https://doi.org/10.1016/j.jtbi.2008.11.029
Claessen MEC. Manual de métodos de análise de solo. 2. ed. Rio de Janeiro: Centro Nacional de Pesquisa de Solos; 1997.
D’Alberto CF, Hoffmann AA, Thomson LJ. Limited benefits of non-crop vegetation on spiders in Australian vineyards: regional or crop differences? BioControl. 2012;57:541-52. https://doi.org/10.1007/s10526-011-9435-x
De Lange HJ, Kramer K, Faber JH. Two approaches using traits to assess ecological resilience: a case study on earthworm communities. Basic Appl Ecol. 2013;14:64-73. https://doi.org/10.1016/j.baae.2012.10.009
Hemm V, Höfer H. Effects of grazing and habitat structure on the epigeic spider fauna in an open xerothermic area in southern Germany. Arachnology. 2012;15:260-8. https://doi.org/10.13156/arac.2012.15.1.260
Indicatti RP, Lucas SM, Ott R, Brescovit AD. Litter dwelling mygalomorph spiders (Araneae: Microstigmatidae, Nemesiidae) from Araucaria forests in southern Brazil, with the description of five new species. Rev Bras Zool. 2008;25:529-46. https://doi.org/10.1590/S0101-81752008000300021
Jung M-P, Kim S-T, Kim H, Lee J-H. Biodiversity and community structure of ground-dwelling spiders in four different field margin types of agricultural landscapes in Korea. Appl Soil Ecol. 2008;38:185-95. https://doi.org/10.1016/j.apsoil.2007.10.010
Kajak A, Kupryjanowicz J, Petrov P. Long term changes in spider (araneae) communities in natural and drained fens in the biebrza river valley. Ekol Bratislava. 1999;19:55-64.
Kemper WD, Chepil WS. Size distribution of aggregates. In: Black CA, Evans DD, White JL, Ensminger LE, Clarck FE, editors. Methods of soil analysis. Physical and mineralogical properties, including statistics of measurement and sampling. Madison: American Society of Agronomy; 1965. Pt 1. p. 499-510. (Agronomy Series, 9).
Kernecker M, Whalen JK, Bradley RL. Agricultural management and flooding shape habitats for non-native earthworms in southern Quebec, Canada. Appl Soil Ecol. 2015;96:240-50. https://doi.org/10.1016/j.apsoil.2015.08.011
Lafage D, Pétillon J. Impact of cutting date on carabids and spiders in a wet meadow. Agr Ecosyst Environ. 2014;185:1-8. https://doi.org/10.1016/j.agee.2013.11.027
Lefebvre M, Franck P, Toubon J-F, Bouvier J-C, Lavigne C. The impact of landscape composition on the occurrence of a canopy dwelling spider depends on orchard management. Agr Ecosyst Environ. 2016;215:20-9. https://doi.org/10.1016/j.agee.2015.09.003
Liu S, Chen J, Gan W, Schaefer D, Gan J, Yang X. Spider foraging strategy affects trophic cascades under natural and drought conditions. Sci Rep. 2015a;5:12396. https://doi.org/10.1038/srep12396
Lo-Man-Hung NF, Marichal R, Candiani DF, Carvalho LS, Indicatti RP, Bonaldo AB, Cobo DHR, Feijoo AM, Tselouiko S, Praxedes C, Brown G, Velasquez E, Decaëns T, Oszwald J, Martins M, Lavelle P. Impact of different land management on soil spiders (Arachnida: Araneae) in two Amazonian areas of Brazil and Colombia. J Arachnol. 2011;39:296-302. https://doi.org/10.1636/CP10-89.1
Malumbres-Olarte J, Barratt BIP, Vink CJ, Paterson AM, Cruickshank RH, Ferguson CM, Barton DM. Habitat specificity, dispersal and burning season: recovery indicators in New Zealand native grassland communities. Biol Conserv. 2013;160:140-9. https://doi.org/10.1016/j.biocon.2013.01.004
Mantyka-Pringle CS, Visconti P, Di Marco M, Martin TG, Rondinini C, Rhodes JR. Climate change modifies risk of global biodiversity loss due to land-cover change. Biol Conserv. 2015;187:103-11. https://doi.org/10.1016/j.biocon.2015.04.016
Michalko R, Petráková L, Sentenská L, Pekár S. The effect of increased habitat complexity and density-dependent nonconsumptive interference on pest suppression by winter-active spiders. Agr Ecosyst Environ. 2017;242:26-33. https://doi.org/10.1016/j.agee.2017.03.025
Odum EP. Ecologia. Rio de Janeiro: Guanabara; 1983.
Oksanen J, Kindt R, Legendre P, O’hara B, Simpson GL, Solymos P, Stevens MHH, Wagner H. Vegan: Community Ecology Package; 2009 [cited 2016 Nov 22]. Available from: http://cran.r-project.org/
Ott R. Descrição de duas espécies novas de Opopaea do sul do Brasil (Oonopidae, Araneae). Iheringia Ser Zool. 2003;93:177-82. https://doi.org/10.1590/S0073-47212003000200008 Poeta MRM, Marques MAL, Buckup EH. Sobre algumas espécies do gênero
Eustala (Araneae, Araneidae) do Brasil. Iheringia Ser Zool. 2010;100:267-74. https://doi.org/10.1590/S0073-47212010000300013
Polchaninova N, Savchenko G, Drogvalenko A, Ronkin V, Shabanov D. The impact of cattle grazing on cursorial spiders (Aranei) and true bugs (Heteroptera) in steppe gullies of northeastern Ukraine. Agr Ecosyst Environ. 2016;234:65-71. https://doi.org/10.1016/j.agee.2016.04.031 Preuss J, Lucas E. Diversidade de aranhas (Arachnida, Araneae) em um fragmento de floresta estacional decidual, extremo oeste de Santa Catarina, Brasil. Unoesc & Ciência - ACBS. 2012;3:37-46. R Development Core Team. R: a language and environment for statistical computing [2.12.2]. Vienna, Austria: R Foundation for Statistical Computing; 2011. Available from: http://www.r-project.org. Rodriguez-Artigas SM, Ballester R, Corronca JA. Factors that influence the beta-diversity of spider communities in northwestern Argentinean Grasslands. Peer J. 2016;4:e1946. https://doi.org/10.7717/peerj.1946
Santa Catarina. Gabinete de Planejamento e Coordenação Geral. Atlas de Santa Catarina. Rio de Janeiro: Aerofoto Cruzeiro; 1986.
Stenroth K, Polvi LE, Fältström E, Jonsson M. Land-use effects on terrestrial consumers through changed size structure of aquatic insects. Freshwater Biol. 2015;60:136-49. https://doi.org/10.1111/fwb.12476
Teague WR, Dowhower SL, Baker SA, Haile N, DeLaune PB, Conover DM. Grazing management impacts on vegetation, soil biota and soil chemical, physical and hydrological properties in tall grass prairie. Agr Ecosyst Environ. 2011;141:310-22. https://doi.org/10.1016/j.agee.2011.03.009 Tedesco MJ, Gianello C, Bissani CA, Bohnen H, Volkweiss SJ. Análise de solo, plantas e outros materiais. 2. ed. Porto Alegre: Universidade Federal do Rio Grande do Sul; 1995. (Boletim técnico, 5).
ter Braak CJF, Smilauer P. Canoco reference manual and user’s guide to Canoco for Windows: software for canonical community ordination (version 4). Microcomputer Power; 1998.