Genetic diversity between papaya lines and their correlation with heterosis in hybrids
for disease resistance and morpho-agronomic traits
Marcelo Vivas
1, Deisy Lucia Cardoso
2, Helaine Christine Cancela Ramos
1, Pedro Henrique Dias dos Santos
1,
Silvaldo Felipe da Silveira
1, Ramon de Moraes
1& Messias Gonzaga Pereira
11Universidade Estadual do Norte Fluminense Darcy Ribeiro, 28013-602, Campos dos Goytacazes, RJ, Brazil. mrclvivas@hotmail.com; helainecr@
uenf.br; pedroh_dias@hotmail.com; silvaldo@uenf.br; ramon2271@hotmail.com; messiasgpereira@gmail.com. 2Universidade Estadual de Mato
Grosso do Sul, Unidade Universitária de Aquidauana, 79200-000, Aquidauana, MS, Brazil. E-mail: deisycardoso@hotmail.com. Autor para correspondência. Marcelo Vivas (mrclvivas@hotmail.com).
Data de chegada: 09/03/2017. Aceito para publicação em: 07/06/2017.
10.1590/0100-5405/176828
ABSTRACT
This study aimed to verify if the genetic divergence between papaya lines, obtained by means of molecular markers, is correlated with heterosis in the hybrids for characteristics related to production, fruit quality and disease resistance. Eight parents and 56 hybrids obtained from diallel crosses were evaluated in randomized blocks, with four replicates. The number of commercial fruits (NCF), the average fruit weight (AFW), the productivity (PROD), the fruit firmness (FIRM) and the total soluble solids (TSS) were evaluated, as well as the severity of black spot on leaves (BSS) and fruits (BSSFr), phoma spot (PSS) and powdery mildew on leaves (PMS). Correlations were estimated between genetic divergence, obtained based on
Vivas, M.; Cardoso, D.L.; Ramos, H.C.C.; Santos, P.H.D.; Silveira, S.F.; Moraes, R.; Pereira, M.G. Genetic diversity between papaya lines and their correlation with heterosis in hybrids for disease resistance and morpho-agronomic traits. Summa Phytopathologica, v.44, n.1, p.110-115, 2018.
SSR, and heterosis, estimated for each characteristic in four possibilities of crossings within the diallel: i) all crossings; ii) between parents of the ‘Solo’ group; iii) between parents of the ‘Formosa’ group; and iv) between parents of ‘Solo’ with ‘Formosa’ group and ‘Formosa’ with ‘Solo’ group. Results indicate the possibility of exploring heterosis both in crossings between groups and in crossings within groups. The low magnitude of the estimates of correlation between heterosis and morphological characteristics of the hybrids with genetic distance obtained by SSR in the parents indicates that the behavior of hybrids cannot be inferred based on the genetic divergence between parents.
Keywords: Carica papaya, diallel, hybridization, plant breeding.
Papaya (Carica papaya L.), one of the tropical plants with major importance for the national and world’s fruit production, is cultivated in several Brazilian states. One of the bottlenecks of this crop is the lack of commercial varieties and hybrids that meet the requirements of the domestic and external market; thus, breeding programs with this attempt should be intensified. Breeding programs in papaya aim to obtain lineages and use them in hybridization programs with the focus on hybrid vigor or heterosis, a phenomenon that provides great productivity to hybrids from the crossing of highly divergent parents.
In papaya, the possibility of exploring heterosis is already reported
for morpho-agronomic characteristics (5, 17), physiological seed quality (19) and disease resistance (13, 27, 29, 26). Falconer (9) suggests that, at any degree of dominance above zero, heterosis is a function of allele frequency between the parents; therefore, there is a positive correlation between genetic divergence and heterosis. For this reason, lineage diversity estimates can be used as a predicting tool of superior crosses in plant breeding programs (14). Studies with lineages obtained from the populations BR-105 and BR-106, correlating productivity and genetic divergence estimated through molecular markers such as RFLP, RAPD, microsatellites and AFLP, showed that the best markers to allocate the
Neste trabalho, objetivou-se verificar se a divergência genética entre as linhagens de mamoeiro, obtida por marcadores moleculares, é correlacionada com a heterose dos híbridos para características relacionadas à produção, qualidade de frutos e resistência a doenças. Oito genitores e 56 híbridos obtidos dos cruzamentos em esquema dialélico, foram avaliados em blocos casualizados, com quatro repetições. Quantificaram-se o número de frutos comerciais (NCF), o peso médio do fruto (AFW), a produtividade (PROD), a firmeza do fruto (FIRM), o sólido solúvel total (TSS) e as severidades de pinta-preta em folha (BSS) e fruto (BSSFr), mancha-de-phoma (PSS) e oídio em folha (PMS) em folha. Estimaram-se as correlações entre a divergência genética obtida por
Vivas, M.; Cardoso, D.L.; Ramos, H.C.C.; Santos, P.H.D.; Silveira, S.F.; Moraes, R.; Pereira, M.G. Diversidade genética entre linhagens de mamoeiro e sua correlação com heterose em híbridos para resistência à doença e características morfoagronômicas. Summa Phytopathologica,
v.44, n.2, p.110-115, 2018.
Palavras-chave: Carica papaya, Dialelo, Hibridação, Melhoramento de plantas.
RESUMO
strains in heterotic groups are the microsatellites and AFLP, both of which are complementary (16, 2).
There are studies reporting that the greater the genetic divergence between the parents, the greater the heterosis and, consequently, the hybrid production (22). However, the correlation between genetic divergence obtained by molecular markers and hybrid performance is not always consistent (1, 12). Gadheri et al. (10) reported that dominance or epistasis effects involving dominance are required to have a positive association between genetic divergence and heterosis and that the parents have differences in allele frequencies that control the trait under study. This difference should increase with the parent’s divergence, allowing the dominance effects to manifest and, consequently, increase the heterosis phenomenon.
Thus, the aim of this study was to estimate the divergence in papaya elite strains by using SSR molecular markers and to verify if the genetic distance estimated by the molecular markers correlates with heterosis and with the traits related to production, fruit quality and genetic disease resistance.
MATERIAL AND METHODS
The experiment was arranged in a complete diallel scheme involving eight parents, four of the ‘Formosa’ group (‘Maradol’, ‘JS 12-N’, ‘JS 12-4’ and ‘Sekati’) and four of the ‘Solo’ group (‘Waimanalo’, ‘Golden’, ‘Sunrise Solo 72-12’ and ‘São Mateus’). It was conducted at “Romana Farm” of “Caliman Agrícola S/A”, in Linhares, Espírito Santo State (ES). The parents were chosen according to previous information obtained in studies about topcross (15, 32, 30), partial diallel (17, 18) and genetic diversity (23). We prioritized the use of parents showing good agronomic traits, both qualitatively and quantitatively, not only in per se terms but also in combination.
The 56 combinations (F1’s and its reciprocals) and their respective parents were evaluated in a completely randomized block design, with four replicates, and each plot constituted of 10 plants (two lines with five plants each). Within line plots, the spacing was of 2.0 x 1.4 m and a 3.6m spacing was adopted to laterally separate the treatments. The cultural practices were performed according to the company routine. The planting scheme was that of three seedlings per pot and, after sexing, one hermaphrodite plant was maintained.
The evaluated morphological characteristics were: i) Number of commercial fruits (NCF): determined by counting all fruits with commercial characteristics at 170, 225 and 320 days after transplanting, respectively; ii) Average fruit weight (AFW): expressed as grams, obtained by weighing five fruits in each plot; iii) Productivity (PROD): expressed as t.ha- 1, obtained by multiplying the number of fruits per
plant by the average fruit weight per plant at 170, 225 and 320 days after transplanting, respectively; iv) Fruit Firmness (FIRM): expressed as Newton (N), the measurements were taken in the equatorial region of the fruits at three equidistant points in its inner; v) Total soluble solids content (TSS): expressed as ºBrix, obtained by using a digital refractometer in a sample of five fruits per plot; and vi) Average fruit pulp thickness (APT): expressed as mm, obtained based on the mesocarp measure after the fruit cross-section, measuring the thickness of the pulp at two points with the aid of a graduated ruler, using a sample of five fruits in each plot.
We also evaluated, with the aid of diagrammatic scales, the severity of phoma-spot - Stagonosporopsis caricae (Sydow & P. Sydow) Aveskamp, Gruyter & Verkley - (PSS), black-spot - Asperisporium
caricae (Speg.) Maubl - (BSS) and powdery mildew - Streptopodium caricae Liberato & R.W. Barreto - (PMS) in leaves (24, 33, 34), and the severity of black spot – A. caricae - in fruits (BSSFr) (35). PSS was estimated for the leaf located below the leaf with the petiole attached to the newly opened flower. PMS and BSS were estimated for the leaf with the newly opened flower. BSSFr was estimated for fruits at maturity stage 1 (initial appearance of yellowish spots on the fruit).
With the averages obtained for each treatment, we calculated the heterosis estimates (H), using the formula:
, where: F1 = single-cross hybrid average and PA = parental lines average (9).
For the genetic divergence analysis, we collected young leaves of the eight parents used in diallel crosses. Isolation of the total DNA from each sample was performed by following the CTAB method (8). DNA was quantified by electrophoresis using 0.8% agarose gel and the High DNA Mass Ladder marker (Invitrogen, USA) as standard. Therefore, the DNA samples were stained with the mixture Gel RedTM
and Blue Juice (1:1) and the images were captured by the MiniBis Pro photodocumentation system (Bio-Imaging Systems). Once the total concentration of each sample was defined, a dilution was performed for the working concentration of 5ng/μL.
Amplification reactions were performed for 15 microsatellite loci, and each reaction was prepared for 15μL final volume, containing 20 ng genomic DNA, 1.5 μL reaction buffer 10X, 2Mm MgCl2, 200 µM dNTPs, 0.3 µM each primer (Sigma, USA) and 1 U Taq DNA polymerase (Go Taq Flexi, Promega USA). SSR loci amplifications were performed on an Eppendorf thermal cycler, following the program: 94°C for 4 min; 35 cycles of 94°C for 1 min; YºC for 1 min; 72°C for 3 min; 72°C for 7 min for final extension (Y°C = Defined annealing temperature for each primer).
The amplified alleles in each of the 15 SSR loci were converted into numerical code. From this numerical matrix, we calculated the distance between the eight parents using the arithmetic complement of the Weighted Index (7). Cluster analysis was conducted with the MEGA software, version 6 (25), using the Hierarchical Method UPGMA (Unweighted Pair Group Method with Arithmetic Mean).
The Pearson correlation coefficient was calculated among the genetic distance obtained by SSR markers, the mean value (
Χ
) and heterosis (H) for the ten characteristics evaluated in the present study, using the GENES software (7).RESULTS AND DISCUSSION
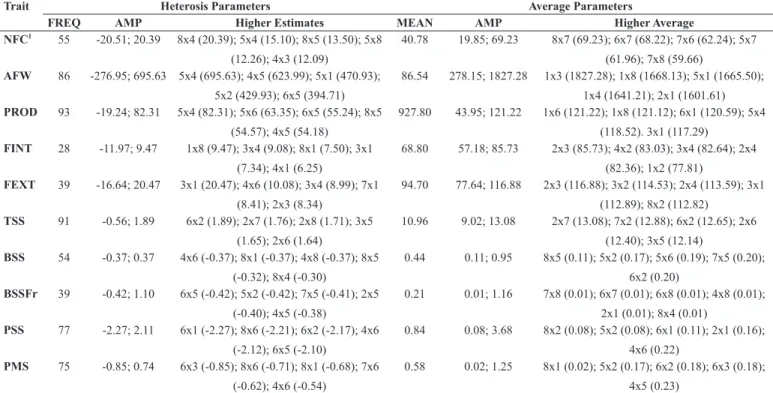
Heterosis estimates were observed for all the evaluated characteristics, and the frequency of hybrids with desirable heterosis effects ranged from 28% (Internal Fruit Firmness) to 93% (Productivity). For most evaluated characteristics, the frequency of hybrids with heterosis estimates was higher than 50% (Table 1). Our results reinforce the theory that heterosis is a common effect in papaya hybrids, with great potential to be explored. These results reinforce other reports for morpho-agronomic characteristics (5, 17), physiological seed quality (19) and disease resistance (13, 29, 30, 26).
for fruit quality attributes, a larger number of hybrids with the highest heterosis estimates were derived from crosses between the ‘Solo’ and ‘Formosa’ heterotic groups and within the ‘Formosa’ group (Table 1). Similar results were obtained when the percentages of hybrids with heterosis estimates from the crosses between and within the heterotic
groups were analyzed (Figure 2), although the crosses between ‘Solo’ and ‘Formosa’ groups presented the highest number of hybrids with heterosis estimates (Figure 1). Such divergence in graphs 1 and 2 may be associated with the larger number of hybrids evaluated among the heterotic groups when compared to the number of hybrids evaluated Table 1. Description of the five best hybrids based on heterosis and average of the characteristics frequency and amplitude of heterosis estimates (average), and amplitude obtained for characteristics related to production, fruit quality and genetic disease resistance.
Trait Heterosis Parameters Average Parameters
FREQ AMP Higher Estimates MEAN AMP Higher Average NFC1 55 -20.51; 20.39 8x4 (20.39); 5x4 (15.10); 8x5 (13.50); 5x8
(12.26); 4x3 (12.09)
40.78 19.85; 69.23 8x7 (69.23); 6x7 (68.22); 7x6 (62.24); 5x7 (61.96); 7x8 (59.66)
AFW 86 -276.95; 695.63 5x4 (695.63); 4x5 (623.99); 5x1 (470.93); 5x2 (429.93); 6x5 (394.71)
86.54 278.15; 1827.28 1x3 (1827.28); 1x8 (1668.13); 5x1 (1665.50); 1x4 (1641.21); 2x1 (1601.61) PROD 93 -19.24; 82.31 5x4 (82.31); 5x6 (63.35); 6x5 (55.24); 8x5
(54.57); 4x5 (54.18)
927.80 43.95; 121.22 1x6 (121.22); 1x8 (121.12); 6x1 (120.59); 5x4 (118.52). 3x1 (117.29)
FINT 28 -11.97; 9.47 1x8 (9.47); 3x4 (9.08); 8x1 (7.50); 3x1 (7.34); 4x1 (6.25)
68.80 57.18; 85.73 2x3 (85.73); 4x2 (83.03); 3x4 (82.64); 2x4 (82.36); 1x2 (77.81)
FEXT 39 -16.64; 20.47 3x1 (20.47); 4x6 (10.08); 3x4 (8.99); 7x1 (8.41); 2x3 (8.34)
94.70 77.64; 116.88 2x3 (116.88); 3x2 (114.53); 2x4 (113.59); 3x1 (112.89); 8x2 (112.82)
TSS 91 -0.56; 1.89 6x2 (1.89); 2x7 (1.76); 2x8 (1.71); 3x5 (1.65); 2x6 (1.64)
10.96 9.02; 13.08 2x7 (13.08); 7x2 (12.88); 6x2 (12.65); 2x6 (12.40); 3x5 (12.14)
BSS 54 -0.37; 0.37 4x6 (-0.37); 8x1 (-0.37); 4x8 (-0.37); 8x5 (-0.32); 8x4 (-0.30)
0.44 0.11; 0.95 8x5 (0.11); 5x2 (0.17); 5x6 (0.19); 7x5 (0.20); 6x2 (0.20)
BSSFr 39 -0.42; 1.10 6x5 (-0.42); 5x2 (-0.42); 7x5 (-0.41); 2x5 (-0.40); 4x5 (-0.38)
0.21 0.01; 1.16 7x8 (0.01); 6x7 (0.01); 6x8 (0.01); 4x8 (0.01); 2x1 (0.01); 8x4 (0.01)
PSS 77 -2.27; 2.11 6x1 (-2.27); 8x6 (-2.21); 6x2 (-2.17); 4x6 (-2.12); 6x5 (-2.10)
0.84 0.08; 3.68 8x2 (0.08); 5x2 (0.08); 6x1 (0.11); 2x1 (0.16); 4x6 (0.22)
PMS 75 -0.85; 0.74 6x3 (-0.85); 8x6 (-0.71); 8x1 (-0.68); 7x6 (-0.62); 4x6 (-0.54)
0.58 0.02; 1.25 8x1 (0.02); 5x2 (0.17); 6x2 (0.18); 6x3 (0.18); 4x5 (0.23)
1NCF, number of commercial fruits; PROD, productivity; AFW, average fruit weight; FINT and FEXT, internal and external fruit firmness, respectively; TSS, total soluble solids; BSS
and BSSFr, black spot severity on leaves and fruits, respectively; PSS, phoma spot severity on leaves; and PMS, powdery mildew severity on leaves. Parents: 1) Maradol’; 2) ‘JS 12-N’, 3) ‘JS 12-4’, 4) ‘Sekati’, 5) ‘Waimanalo’, 6) ‘Golden’, 7) ‘Sunrise Solo 72-12’ and 8) ‘São Mateus’.
within the ‘Solo’ and within the ‘Formosa’ groups.
The papaya lineages used in diallel crosses were subjected to molecular analysis via SSR marker to estimate the genetic distance. We detected 48 alleles in 19 analyzed microsatellite loci, with allele numbers ranging from 2 to 4 and an average of 2.52 alleles/loci. The PIC mean value was 0.42, ranging from 0.30 to 0.67 (not shown), which allows classifying the analyzed loci as moderately informative, as suggested by Botstein et al. (4).
The analyzed microsatellite loci revealed a satisfactory genetic distance between lines. Distances ranged from 0.14 between Sunrise Solo 72/12 and Golden genotypes to 0.89 between JS12-N and São Mateus, with a genetic distance average of 0.70. Clustering analysis using the UPGMA hierarchical method grouped the lines into two main groups (Figure 3), showing a good fit of the dendrogram, with a high cophenetic correlation value (r=0.92) and a low percentage of stress and distortion (0.74% and 8.64%, respectively). Group I consisted of lines belonging to the ‘Formosa’ group (Maradol, JS12-N, JS12-4 and Sekati), while group II consisted of ‘Solo’ genotypes (Waimanalo, Golden, Sunrise Solo 72/12 and São Mateus). The analyzed SSR markers allowed a clear genotype separation, according to the heterotic group. Considering the dendrogram analysis, there was greater genetic distance between genotypes of the ‘Formosa’ group than among those of the ‘Solo’ group, indicating lower variability for the latter group.
For comparative purposes, we performed correlation tests among the parents’ genetic distance and the heterosis estimates and the hybrids’ average, considering: a) all evaluated hybrids; b) only the hybrids from the cross between parents of the ‘Solo’ group; c) between parents of the ‘Formosa’ group; and d) between parents of the ‘Solo’
and ‘Formosa’ groups (Table 2). The correlation values between genetic divergence and hybrid productivity averages were positive when considering all crosses and for crosses between ‘Formosa’ genotypes, but negative for crosses involving ‘Solo’ genotypes. Considering heterosis for productivity, correlation values with genetic distance were also low and negative for most crosses, and a positive estimate was obtained only for crosses between lines of the ‘Formosa’ group. However, all these estimates were non-significant according to the Mantel test. This can be explained by the absence of dominance because the brands are not associated with one or more determinant QTLs of the trait in the study and/or because productivity does not have high heritability (3). Similar results were found for correlations of genetic distance obtained by SSR markers with productivity (r= 0.14). Melchinger et al. (21, 20) and Charcosset & Essioux (6) also reported that there was no correlation between genetic divergence and productivity of the hybrids produced from the combination between lineages of different heterotic groups. Positive estimates with high magnitude were observed for correlation between genetic distance and fruit internal firmness-FINT (heterosis) in crosses within the ‘Solo’ group (r = 0.80) and between genetic distance and BSS (mean value) in crossings within the ‘Formosa’ group (r = 0.61). On the other hand, negative correlation estimates with high magnitude were observed between genetic distance and BSSFr (mean value and heterosis) in crossings within the ‘Formosa’ group (r = -0.72), as well as between distance and fruit external firmness-FEXT (heterosis) also within the ‘Formosa’ group (r= -0.61). Despite the high magnitudes, such estimates are punctual and of low consistency (possibly due to the large number and different types of crosses), which limits their predictive power in the hybridization programs.
The distribution of the eight parental lineages in the two main groups observed in this study, corresponding to ‘Solo’ and ‘Formosa’ heterotic groups, justifies the highest proportion of hybrids showing heterosis for all evaluated traits, considering the crosses between groups (‘Solo’ x ‘Formosa’) (Figure 1). However, it was not possible to observe a positive and significant correlation of genetic distance with heterosis or with the performance of lines per se considering such crosses (Table 2). George et al. (11) suggested that the relationship between genetic distance and heterosis is not so simple since genetic distances between parental lineages can increase the level of heterosis to some point, after which heterosis tends to decline. In our study, the most distant lineages (JS-12 and São Mateus) did not present estimates of satisfactory heterosis for the analyzed characteristics. On the other hand, the lines with the smallest genetic distance (Sunrise Solo 72/12 and Golden) presented satisfactory values of heterosis for black-spot severity in fruits (BSSFr) and phoma spot severity (PSS) (Table 1).
The correlations between genetic distance and heterosis estimated in our study were of low magnitude for the great majority of estimates and, therefore, have no predictive value. In this sense, the potential application of molecular markers in determining the heterosis extent
in papaya is still inconclusive, requiring additional studies aimed at the identification and application of functional markers linked to QTL’s of interest for papaya crop.
The conclusions of this work are:
1. There is a possibility to explore the hybridization in both crosses between heterotic groups and within heterotic groups;
2. The genetic distances obtained by SSR markers analyzed in the present study were effective in identifying closely related papaya lines, discriminating them according to the heterotic group, but were of limited importance in predicting the performance of the hybrids in terms of productivity and foliar disease genetic resistance traits.
ACKNOWLEDGEMENTS
To “Fundação Carlos Chagas Filho de Amparo à Pesquisa do Estado do Rio de Janeiro” (FAPERJ), “Universidade Estadual do Norte Fluminense Darcy Ribeiro” (UENF) and “Caliman Agrícola S/A” for financial and logistical support.
Figure 3. UPGMA hierarchical cluster analysis for the eight papaya lines, based on the dissimilarity coefficient of the Weighted Index using data from the 19 microsatellite loci.
Table 2. Estimates of correlation coefficients (r) between heterosis in relation to the parents’ average (H) and average (
Χ
) of characteristics related to production, fruit quality and disease resistance, with the parents’ genetic distance.Trait Correlation (Average) Correlation (Heterosis)
Complete Solo Formosa S x F Complete Solo Formosa S x F NFC1
-0.35** -0.18 0.04 0.01 -0.10 0.11 0.14 -0.24
AFW 0.29* 0.05 0.04 0.02 -0.15 -0.42 0.06 -0.07
PROD 0.20 -0.09 0.21 -0.09 -0.15 -0.34 0.29 -0.10
FINT 0.23 0.21 -0.04 -0.27 0.32* 0.80** 0.27 -0.01
FEXT 0.21 0.16 -0.57 -0.26 0.18 0.14 -0.61* -0.12
TSS -0.23 -0.42 -0.42 -0.10 0.16 0.18 -0.001 -0.27
BSS 0.29* 0.33 0.61* 0.06 0.10 -0.27 -0.52 0.10
BSSFr -0.13 -0.43 -0.72** -0.04 0.20 0.57 -0.72** -0.13
PSS -0.24 -0.34 -0.02 0.20 0.25 0.18 0.28 0.08
PMS -0.05 -0.33 0.09 0.01 0.16 -0.40 0.21 0.06
1NCF, number of commercial fruits; PROD, productivity; AFW, average fruit weight; FINT and FEXT, internal and external fruit firmness, respectively; TSS, total soluble solids; BSS
and BSSFr, black spot severity on leaves and fruits, respectively; PSS, phoma spot severity on leaves; PMS, powdery mildew severity on leaves.
REFERENCES
01. Barbosa, A.M.M.; Geraldi, I.O.; Benchimol,L.L.; Garcia, A.A.F.; Souza, C.L.; Souza, A.P. Relationship of intra- and interpopulation tropical maize single cross hybrid performance and genetic distances computed from AFLP and SSR markers. Euphytica, Netherlands, v.130, p.87-99, 2003. 02. Benchimol, L.L.; Souza Júnior C.L.; Garcia, A.A.F; Kono, P.M.S.; Mangolin,
C.A.; Barbosa, A..M.M.; Coelho, A.S.G.; Souza, A.P. Genetic diversity in tropical maize inbred lines: heterotic group assignment and hybrid per-formance determined by RFLP markers. Plant Breeding, Berlin, v.119, p.491-496, 2000.
03. Bernardo, R. Relationship between single-cross performance and molecular marker heterozygosity. Theoretical and Applied Genetics, Berlin, v.83, p.628-634, 1992.
04. Botstein, D.; White, R.L.; Skolnick, M.H.; Davies, R.W. Construction of a genetic linkage map in man using restriction fragment length polymorphisms American Journal of Human Genetics, Chicago, v.32, p.314-331, 1980. 05. Chan, Y.K. Heterosis in Eksotika x Sekaki papaya hybrids. Journal of Tropical Agriculture and Food Science, Kuala Lumpur, v.29, n.2, p.139-144, 2011.
06. Charcosset, A.; Essioux, L. The effect of population struture on the rela-tionship between heterosis and heterozygosity at marker loci. Theoretical and Applied Genetics, Berlin, v.89, n.2-3, p.336-343, 1994.
07. Cruz, C.D. GENES - a software package for analysis in experimental stas-tistics and quantitative genetics. Acta Scientiarum. Agronomy, Maringá v.35, p.271-276, 2013.
08. Doyle, J.J.; Doyle, J.L. Isolation of plant DNA from fresh tissue. Focus, New York, v.12, p.13-15, 1990.
09. Falconer, D.S. Introduction to quantitative genetics. 2.ed. London: Longman, 1981.
10. Gadheri, A.; Adams, M.W.; Nassib, A.M. Relationship between genetic distance and heterosis for yield and morphological traits in dry Edible Bean and Faba Bean. Crop Science, Madison, v.24, p.37-42, 1984. 11. George, M.L.C.; Salazar, F.; Warbuton, M.; Narro, L.; Vallejo, F.A.
Genetic distance and hybrid value in tropical maize under P stress and non-stress conditions in acid soils. Euphytica, Wageningen v.178, p.99-109, 2011.
12. Guimarães, P.S.; Paterniani, M.E.A.G.Z.; Lüders, R.R.; Souza, A.P.; Laboru -da, P.R.; Oliveira, K.M.; Correlação da heterose de híbridos de milho com divergência genética entre linhagens. Pesquisa Agropecuária Brasileira, Brasília, DF, v.42, n.6, p.811-16, 2007.
13. Hafsah, S.; Sastrosumarjo, S.; Sujiprihati, S.; Sobir, S.; Hidayat, S.H. Daya Gabung dan Heterosis Ketahanan Pepaya (Carica papaya L) terhadap Penyakit Antraknosa. Buletin Agronomi, Indonésia, v.35, n.3, p.197-204, 2007.
14. Hallaeur, A.R.; Miranda Filho, J.B. Quantitative Genetics in Maize Breed-ing. 2.ed. Ames: Iowa State University Press, 1995. 468p.
15. Ide, C.D.; Pereira, M.G.; Viana, A.P.; Pereira, T.N.S. Use of testers for combining ability and selection of papaya hybrids. Crop Breeding and Applied Biotechnology, Viçosa, v.9, p.60-66, 2009.
16. Lanza, L.L.B.; Souza JR., C.L.; Ottoboni, L.M.M.; Vieira, M.L.C.; Souza, A.P.; Genetic distance of inbred lines and prediction. of maize single-cross performance using RAPD markers. Theoretical and Applied Genetics, Berlin, v.94, n.8, p.1023-1030, 1997
17. Marin, S.L.D.; Pereira, M.G.; Amaral Júnior, A.T.; Martelleto, L.A.P.; Ide, C.D. Partial diallel to evaluate the combining ability for economically important traits of papaya. Scientia Agricola, Piracicaba, v.63, p.540-546, 2006.
18. Marin, S.L.D.; Pereira, M.G.; Amaral Júnior, A.T.; Martelleto, L.A.P.; Ide, C.D. Heterosis in papaya hybrids from partial diallel of ‘Solo’and ‘Formosa’ parents. Crop Breending and AppliedBiotechnology, Viçosa, v.6, p.24-29, 2006.
19. Martins, G.N.; Pereira, M.G.; Silva, R.F.; Oliveira, A.C.S.; Silva F. Efeito do pólen nas características físicas e fisiológicas de sementes de mamão. Revista Brasileira de Sementes, Londrina, v.31, n.2, p.19-26, 2009. 20. Melchinger, A.E.; Boppenmaier, J.; Dhillon, B.S.; Pollmer, W.G.; Herrman,
R.G. Genetic diversity for RFLPs in European maize inbreds. II. Relation to performance of hybrids within versus between heterotic groups for forage traits. Theoretical and Applied Genetics, Berlin, v.84, n.5/6, p.672-681, 1992.
21. Melchinger, A.E.; Lee, M.; Lamkey, K.R.; Hallauer, A.R.; Woodman, W.L. Genetic diversity for restriction fagment length polymorphisms and heterosis for two diallel ets of maize inbreds. Theoretical and Applied Genetics, Berlin, v.80, n.4, p.488-496, 1990.
22. Oliveira, K.M., Laborda, P.R., Garcia, A.A.F., Zagatto-Paterniani, M.E.A.G.; Souza, A.P. Evaluating genetic rlationships between tropical maize inbred lines by means of AFLP profiling. Hereditas, Harlow, v.140, p.24-33, 2004. 23. Quintal, S.S.R.; Viana, A.P.; Gonçalves, L.S.A.; Pereira, M.G.; Amaral
Júnior, A.T. Divergência genética entre acessos de mamoeiro por meio de variáveis morfoagronômicas. Semina: Ciências Agrárias, Londrina, v.33, p.131-142, 2012.
24. Santos, P.H.D.; Vivas, M.; Silveira, S.F.; Silva, J.M.; Terra, C.E.P.S. Ela-boração e validação de escala diagramática para avaliação da severidade de oídio em folhas de mamoeiro. Summa Phytopathologica, Botucatu, v.37, p.215-217, 2011.
25. Tamura, K.; Stecher, G.; Peterson, D.; Filipski, A. and Kumar, S. MEGA6: Molecular Evolutionary Genetics Analysis Version 6.0. Molecular Biology and Evolution, Oxford, v.30, p.2725-2729, 2013.
26. Vivas, M.; Ramos, H.C.C.; Santos, P.H.D.; Silveira, S.F.; Pereira, T.N.S.; Amaral Junior, A.T.; Pereira, M.G. Heterosis and genetic diversity for selection of papaya hybrids for resistance to black spot and phoma spot. Tropical Plant Pathology, Brasília, DF, v.41, p.380-389, 2016. 27. Vivas, M.; Silveira, S.F.; Cardoso, D.L.; Pereira, M.G.; Santos, P.H.D.;
Ferreguetti, G.A. Capacidade combinatória e heterose para resistência a pinta-preta em mamoeiro por meio de análise dialélica. Tropical Plant Pathology, Brasília, DF, v.37, n.5, p.326-332, 2012.
28. Vivas, M.; Silveira, S.F.; Cardoso, D.L; Pereira, M.G; Vivas, J.M.S.; Fer-reguetti, G.A. Capacidade combinatória em mamoeiro para resistência a oídio. Bragantia, Campinas, v.71, p.455-459, 2012.
29. Vivas, M.; Silveira, S.F; Cardoso, D.L; Amaral Júnior, A.T. Pereira, M.G. Heterose para resistência a mancha-de-phoma em híbridos de mamoeiro obtidos a partir de cruzamentos entre e dentro de grupos heteróticos. Summa Phytopathologica, Botucatu, v.40, p.318-322, 2014.
30. Vivas M.; Silveira S.F.; Pereira M.G. Prediction of genetic gain from selection indices for disease resistance in papaya hybrids. Revista Ceres, Viçosa, v.59,781-786, 2012.
31. Vivas, M.; Silveira, S.F.; Pereira, M.G.; Cardoso, D.L.; Ferreguetti, G.A. Análise dialélica em mamoeiro para resistência a mancha-de-phoma. Ci-ência Rural, Santa Maria, v.43, p.945-950, 2013.
32. Vivas M.; Silveira S.F.; Terra C.E.P.S.; Pereira M.G. Testers for combining ability and selection of papaya hybrids resistant to fungal diseases. Crop Breeding and Applied Biotechnology, Viçosa, n.11,p.36-42, 2011. 33. Vivas, M.; Silveira, S.F.; Terra, C.E.P.S.; Pereira, M.G. Reação de
germoplas-ma e híbridos de germoplas-mamoeiro à germoplas-mancha-de-phogermoplas-ma (Phogermoplas-ma caricae-papayae) em condições de campo. Tropical Plant Pathology, Brasília, DF, v.35, p.323-328, 2010.
34. Vivas, M.; Silveira, S.F.; Vivas, J.M.S.; Pereira, M.G. Patometria, parâmetros genéticos e reação de progênies de mamoeiro à pinta-preta. Bragantia, Campinas, v.71, p.235-238, 2012.