Brazil has been an important producer of corn (Zea mays) for the greengrocery market, and canned corn grain has long been sold in the national market. Currently, there have been few agri-industries canning sweet corn (Zea mays) because few commercial varieties with agronomic characteristics proper to attend industrial purposes are available to specialty maize growers (Gama et al., 1992).
In the different types of corn, the content of proteins varies from 6 to 12% (dry basis), and 75% of these proteins are stored in the endosperm (FAO, 2008). The nutritive value of canned sweet corn is also high (Pereira Filho &
Cruz, 2002; Oliveira Junior et al., 2006) because the reduction in polysaccharides as the starch, for example, increases the content of proteins (Paes, 2006). In the milky stage, the grains are tender and the concentration of sugars is higher than found in the immature grain of common corn (Silva, 1994). Hybrid grains whether stored under appropriate environmental conditions have their life span extended. This allows net returns to the specialty maize growers and nutritional benefits to consumers (Braz et al., 2006; Pereira et al., 2009).
In sweet corn, carbohydrates such as sucrose, fructose and starch define the produce quality and should
be also investigated to recommend novelty cultivars with better consumer acceptance (Caniato et al., 2004). The sweet corn differs from the common corn because of the high sugar and low starch contents controlled by single recessive genes or genes associated with double or triple combinations (Araujo et al., 2001).
A genetic program of sweet corn have to consider the grain quality, the agronomic characteristics of commercial traits such as the dehusked ear yield, and the stability and combining ability (Teixeira et al. 2009). As the chemical composition of the sweet corn grain can be changed through genetic
29: 531-536.
Agronomic traits and chemical composition of single hybrids of sweet
corn
Angela Kwiatkowski1;Edmar Clemente2; Carlos Alberto Scapim1
1 UEM-PGA, [email protected]; [email protected]; 2 UEM-DQI, Av. Colombo, 5790, 87020-900 Maringá-PR; [email protected]
ABSTRACT
In Brazil, the greengrocery market of sweet corn has been expanding along the country. In contrast, there have been few agri-industries canning sweet corn (Zea mays) because of the lack of cultivars with agronomic characteristics proper to industrial purposes. The purpose of this study was to evaluate the general combining
ability (GCA) of seven inbred lines of sweet corn, and the specific
combining ability (SCA) of their hybrid combinations based on their agronomic traits, and the chemical composition of the grain. In the growing season 2006/2007, twenty-one single hybrids were evaluated in the Iguatemi Research Station, Maringá County, Northwestern Paraná, in Brazil using a complete randomized block design with four replications. Data were subjected to the analysis of variance and the genotypes were clustered by the Scott-Knott test. We estimated the
GCA and SCA effects using the Griffing’s method IV with the fixed
model for plant height (PH), height of ear (EH), dehusked ears yield (DEY), reducing (RS) and total sugars (TS), starch (ST), proteins
(PTN), ether extract (EE) and fibers (FB). The inbred line L4, which was originated from the ‘Doce de Cuba’, had the best GCA for crop yield and grain quality and therefore should be used in the next
hybrid combinations. The hybrids L4xL5 and L3xL7 were the most
promising with regard to crop yield and grain quality.
Keywords:Zea mays, general combining ability, specific combining
ability, grain quality.
RESUMO
Caracteres agronômicos e composição química de híbridos simples de milho doce
No Brasil, poucas indústrias envazam o milho doce (Zea mays) por causa da falta de cultivares para o processamento industrial. Em compensação, o mercado de milho verde doce aumentou. O objetivo deste estudo foi avaliar a capacidade geral de combinação
(CGC) de sete linhagens de milho doce e da capacidade específica
de combinação (CEC) das combinações híbridas, com base em
características agronômicas e composição química dos grãos. Os
vinte e um híbridos simples foram avaliados em blocos casualizados,
com quatro repetições, durante o ano agrícola 2006/2007, no distrito
de Iguatemi, município de Maringá, na região noroeste do Paraná, Brasil. Os dados foram submetidos à análise de variância e ao teste de agrupamento de médias de Scott-Knott. A análise dialélica foi
realizada utilizando a metodologia de Griffing, método IV com o modelo fixo, para as características: altura da planta e da inserção
da espiga, rendimento de espigas sem palha, açúcares redutores e
totais, amido, proteína, extrato etéreo e fibras. A linhagem de milho
doce L4 (obtida da variedade Doce de Cuba) destacou-se em relação
a CGC para as características de rendimento e de qualidade e será
empregada em combinações híbridas futuras. Os híbridos simples
L4xL5 e L3xL7 foram os mais promissores no que diz respeito ao binômio rendimento-qualidade.
Palavras-chave: Zea mays, capacidade combinatória geral,
capaci-dade combinatória específica, qualicapaci-dade.
(Recebido para publicação em 31 de março de 2010; aceito em 29 de novembro de 2011)
manipulation, breeders have recently given greater attention to these breeding programmes (Aragão, 2002; Pereira et al., 2009).
In plant breeding, the diallel analysis was developed to evaluate the genetic and the set design. This method estimate useful parameters to select parents for crossbreeding and for understanding the nature and the magnitude of the effects that determine the genetic characteristics (Cruz & Regazzi, 2004). Sprague & Tatum (1942) defined the general combining ability (CGC) to express the average behavior of inbred lines, and the specific combining ability (SCA) to express the behavior of specific hybrid combinations, depending on what one could expect based on the CGC inbred lines.
The purpose of this study was to evaluate the general combining ability of seven inbred lines and the specific combining ability of their hybrids for agronomic traits and chemical composition of the grain.
MATERIAL AND METHODS
The Genetic Breeding Program of the Universidade Estadual de Maringá provided seven inbred lines of sweet corn with the gene sugary-1 (su1), generation of the self-fertilization, genealogy and the origin, respectively: L1 - S6, variety, BR 402; L2 - S6, variety, BR 402; L3 - S8, variety, Doce de Cuba; L4 - S6, variety, Doce de Cuba; L5 - S6, variety, BR 401; L6 - S8, variety, BR 401; L7 - S8, variety, Doce 43IN - UFV. Twenty-one single-cross hybrids were obtained by diallel crosses. The experiment was conducted in the Iguatemi Research Farm, Iguatemi County, Northwestern Paraná, Brazil. We used the complete randomized block design with four replications. Every plot had rows of 5 m in length spaced 0.9 m apart, where 25 plants were established. Every plot was fertilized with N at 60 kg ha-1, P
2O5 at 60 kg ha -1 and K
2O at
40 kg ha-1. All the cropping practices
and methods of disease control were those recommended for green corn. The flowering period was based on the number of days from the sowing to 50%
of silking and tasseling plants evaluated from April 10 to 14, 2007. Thereafter, we collected from April 28 to 30, 2007 data from the tassel height measured from the ground level up to the panicle attachment; mean ear height measured on the same plants from ground level to the upper node with ear. All the dehusked ears per plot were weighed (kg plot-1) and the data transformed to
kg ha-1.
Thereafter, the ears were blanched into boiling water (100ºC) for 5 min, cooled at 20°C for about 5 to 10 min, wrapped in plastic bags and frozen at -18°C. The frozen ears were safely transported to the laboratory of UEM where they were first thawed to evaluate four ears per plot (16 per treatment) to determine their chemical composition with three replications. All grains were removed from the corncobs, oven-dried to constant weight at 60°C, and ground in a knife mill with precision of 30 mesh. The whole meal was used to quantify the contents of reducing (RS) and total sugars (TS), starch (ST), proteins (PTN), ether extract (EE) (Brasil, 2005) and fibers (FB) (Silva & Queiroz, 2009). These data were reported as percent of dry matter. The initial values of dehusked ear yield were corrected to the moisture level of 70.0% using
DEY = M{(1-HU)/(1-0.70)} in which DEY = dehusked ear yield with 70.0% of moisture; M = non-corrected dehusked ear yield, and HU = observed moisture (readability in decimal).
The analyses of variance (ANOVA) were carried out and F test was performed at p<0.01 (SAS, 1999). The means were clustered by the Scott-Knott test at p<0.05 (Scott & Knott, 1974). Based on data of combining ability, we applied the Griffing’s method 4 using the fixed model (Griffing, 1956) through the software Genes (Cruz, 2006).
RESULTS AND DISCUSSION
Currently, the CVs were considered low whether compared to the literature indicating therefore high level of experimental reliability. We detected the lowest CVs for the contents of ST
(1.12%), TS (1.22%) and PTN (1.82%) (Table 2). The CV reported in the literature for PTN was 8.07% (Bordallo et al., 2005). The DEY had the highest CV (17.95%). The CVs for RS (2.77%) and TS (1.22%) were lower than 27.41 and 16.58% reported by Scapim et al. (1995). These authors reported CVs 7.86% for PH and 11.94% for EH, similar to those obtained in this paper.
None significant difference (p>0.05) was found for PH (from 1.38 to 1.60 m) and EH (from 0.66 to 0.89 m). The DEY ranged from 2,693 to 6,350 kg ha-1.
The hybrids L2xL4 and L4xL7 had the highest and the hybrids L5xL6, L3xL6 and L2xL3 had the lowest DEY. The contents of FB ranged from 3.72 (L4 x L5) to 6.29% (L1 x L7) (Table 1). The corresponding response in common maize, otherwise, can reach 9.0% (Paes, 2006). The seeds of sweet corn accumulate less FB than the common maize, which reduces the cooking period during the industrial process. In general, less fibrous grain have positive influence on the texture of the pericarp.
The RS contents ranged from 2.14 to 4.96%. These estimates were higher in the hybrids L3xL7 and L4xL5 and lower in hybrid L6xL7. The values of TS ranged from 6.64 (L2xL6) to 11.22% (L4xL5). ST varied from 20.42 (L4xL5) to 29.12% (L2xL6) (Table 1). Hybrids with the greatest amount of ST (starch) had lower levels of TS (total sugars). The agri-industry of sweet corn prefers varieties with higher TS and lower ST contents. Oliveira Junior et al. (2006) stated the consumer preference for genotypes with higher TS contents, too.
The mean squares for GCA and SCA were significant by the F test (p<0.01) for all the traits except for PH, and the EH that was significant only for GCA (p<0.05). These results are indicating the feasibility of this breeding program. The quadratic components related to the effects of SCA were greater than those associated with GCA for all the traits, except for dehusked ear yield. In fact, these responses are showing a greater significance of the non-additive effects, and indicating that methods exploring hybrids must be used in the current breeding program.
The estimates of GCA (Gˆi) and SCA (
ij
Sˆ ) effects depend on the set of inbred lines during the tests. Inferences, therefore, are only valid for the genotypes present in the experiment
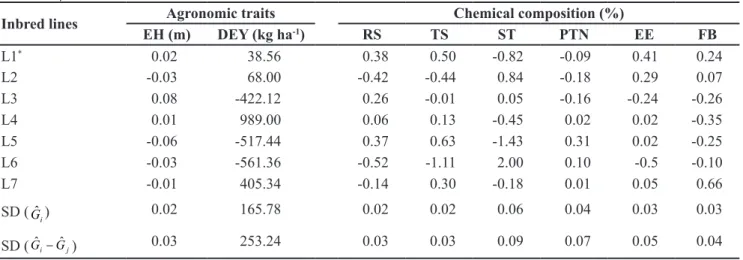
(Griffing, 1956). Thus, the estimates of the Gˆi effects for each line and the standard deviations (SD) of the effects from two parent inbred lines are given in Table 2.
The criterion to discriminate two parents was defined as being the difference higher than one value of the SD between them. High Gˆi estimates, in absolute values, are generally observed in the genotypes whose favorable frequency of alleles are higher or lower than the mean of favorable frequency of alleles in all the genotypes tested. These values, therefore, are an indicative of additive genes (Sprague & Tatum, 1942).
The line L3 had a greater positive and line L5 a greater negative Gˆi effect
for EH. In DEY, the positive effects of
i
Gˆ were greatest for line L4 with the range of variation 6.12 times higher than the SD. The greatest positive effect for RS was found from the line L1, which is the parent line that promoted the highest genetic gain in the contents of RS. The range of variation for TS was 53.86 times higher than the SD from the L5 and L6 (Table 2).
The range of the ST for the L5 and L6 was 37.02 times higher than the SD value with the highest positive and negative values, respectively. For the sugar contents, the line L6 contributed to the RS contents and to higher ST contents. The range from the FB for the L4 and L7 was 23.59 times higher than the SD. These lines were the inbred lines with the highest positive and
Table 1. Means of traits of single-cross hybrids of sweet corn (médias dos caracteres de híbridos simples de milho doce). Maringá, UEM, 2006/2007.
Hybrids
Agronomic traits Chemical composition (%)
PH (m)
EH (m)
DEY
(kg/ha) RS TS ST PTN EE FB
L1xL2 1.54a 0.80a 4306c 4.15c 8.91e 25.71c 12.68a 5.11b 5.48c
L1xL3 1.54a 0.81a 4533b 4.51b 8.59f 25.28d 11.60d 5.10b 5.08d
L1xL4 1.47a 0.79a 4103c 4.06c 8.72f 25.85c 11.21e 5.12b 4.84e
L1xL5 1.40a 0.66a 4167c 4.07c 9.16d 24.27e 10.64f 4.41d 5.16d
L1xL6 1.50a 0.80a 4769b 4.14c 9.71c 24.29e 11.16e 4.62c 4.81e
L1xL7 1.51a 0.86a 5084b 3.02h 7.81g 28.18b 12.29b 5.38a 6.29a
L2xL3 1.53a 0.85a 3414d 3.57e 8.85e 25.49d 10.42g 4.85c 4.64f
L2xL4 1.52a 0.78a 6350a 3.09g 7.09i 28.54b 10.44g 4.00e 5.93b
L2xL5 1.39a 0.70a 4519b 3.30f 9.10d 24.17e 12.41b 5.44a 4.53f
L2xL6 1.38a 0.71a 3983c 2.83i 6.64k 29.12a 10.75f 4.99b 4.97d
L2xL7 1.46a 0.71a 4537b 3.00h 7.60h 28.86a 12.46b 4.74c 5.26d
L3xL4 1.60a 0.89a 5275b 3.13g 7.47h 28.33b 12.88a 4.72c 3.79g
L3xL5 1.58a 0.84a 3831c 3.67e 7.45h 28.45b 12.07c 4.37d 4.86e
L3xL6 1.44a 0.80a 3022d 3.60e 7.21i 28.17b 11.93c 3.83f 5.22d
L3xL7 1.53a 0.82a 4583b 4.85a 10.78b 22.22f 10.36g 3.61f 5.60c
L4xL5 1.50a 0.77a 5111b 4.96a 11.22a 20.42g 11.96c 4.67c 3.72g
L4xL6 1.50a 0.77a 4819b 2.87i 6.90j 28.23b 12.42b 3.99e 4.82e
L4xL7 1.49a 0.75a 6056a 4.23c 9.62c 24.05e 11.22e 5.32a 5.62c
L5xL6 1.44a 0.68a 2693d 3.82d 7.42h 28.81a 12.52b 3.80f 5.05d
L5xL7 1.54a 0.75a 3861c 4.07c 9.16d 24.39e 12.00c 5.09b 5.89b
L6xL7 1.54a 0.76a 4675b 2.14j 6.93j 29.06a 11.76d 3.80f 5.11d
CV (%) 8.14 12.13 17.95 2.77 1.22 1.12 1.82 3.49 2.67
*In the columns, means followed by the same letter did not differ by the Scott-Knott test (1974) (p>0.05); L= Inbred lines; PH= plant height; EH= ear height; DEY= dehusked ears yield; RS= reducing sugars; TS= total sugars; ST= starch; PTN= protein; EE= ether extract; FB= fiber (*na coluna, médias seguidas pela mesma letra não se diferenciam pelo teste de Scott-Knott (1974) (p>0,05); L= linhagens; PH= altura de
planta; EH= altura da espiga; DEY= rendimento em espigas despalhadas; RS= açúcares redutores; TS= açúcares totais; ST= amido; PTN=
Table 2. Estimate of the effects of GCA ( i
Gˆ ) and the standard deviation (SD) of seven inbred lines of sweet corn (estimativa dos efeitos de GCA (
i
Gˆ ) e desvio-padrão (SD) de sete linhagens de milho doce). Maringá, UEM, 2006/2007.
Inbred lines Agronomic traits Chemical composition (%)
EH (m) DEY (kg ha-1) RS TS ST PTN EE FB
L1* 0.02 38.56 0.38 0.50 -0.82 -0.09 0.41 0.24
L2 -0.03 68.00 -0.42 -0.44 0.84 -0.18 0.29 0.07
L3 0.08 -422.12 0.26 -0.01 0.05 -0.16 -0.24 -0.26
L4 0.01 989.00 0.06 0.13 -0.45 0.02 0.02 -0.35
L5 -0.06 -517.44 0.37 0.63 -1.43 0.31 0.02 -0.25
L6 -0.03 -561.36 -0.52 -1.11 2.00 0.10 -0.5 -0.10
L7 -0.01 405.34 -0.14 0.30 -0.18 0.01 0.05 0.66
SD (Gˆi) 0.02 165.78 0.02 0.02 0.06 0.04 0.03 0.03
SD (Gˆi−Gˆj) 0.03 253.24 0.03 0.03 0.09 0.07 0.05 0.04
*L= Inbred lines; EH= ear height; DEY= dehusked ears yield; RS= reducing sugars; TS= total sugars; ST= starch; PTN= protein; EE=
ether extract; FB= fiber (*L= Linhagens; EH= altura de espiga; DEY= rendimento em espigas despalhadas; RS= açúcares redutores; TS= açúcares totais; ST= amido; PTN= proteína; EE= extrato etéreo; FB= fibras).
Table 3. Estimates of the SCA (Sˆij) effects and the standard deviation (SD) of 21 hybrids of sweet corn (estimativa dos efeitos de SCA (Sˆij) e desvio-padrão (SD) de 21 hibridos de milho doce). Maringá, UEM, 2006/2007.
Hybrids Agronomic traits Chemical composition (%)
EH(m) DEY (kg ha-1) RS TS ST PTN EE FB
L1xL2* 0.02 -262.45 0.51 0.45 -0.59 1.28 -0.20 0.099
L1xL3 0.01 455.37 0.19 -0.30 -0.23 0.18 0.32 0.020
L1xL4 -0.03 -1386.25 -0.06 -0.31 0.84 -0.39 0.07 -0.12
L1xL5 -0.07 184.09 -0.36 -0.37 0.24 -1.25 0.63 0.10
L1xL6 0.03 830.71 0.61 1.92 -3.17 -0.52 0.13 -0.41
L1xL7 0.06 178.51 -0.89 -1.39 2.90 0.70 0.31 0.31
L2xL3 0.02 -693.47 0.05 0.86 -1.69 -0.92 0.19 -0.25
L2xL4 0.01 831.51 -0.23 -0.97 1.87 -1.07 -0.92 1.13
L2xL5 0.003 507.35 -0.33 0.52 -1.51 0.60 0.52 -0.36
L2xL6 -0.01 15.17 0.10 -0.20 0.001 -0.84 0.62 -0.08
L2xL7 -0.04 -398.13 -0.11 -0.66 1.92 0.96 -0.21 -0.54
L3xL4 0.02 246.63 -0.87 -1.05 2.45 1.35 0.33 -0.68
L3xL5 0.03 308.67 -0.64 -1.57 3.55 0.24 -0.02 0.29
L3xL6 -0.03 -455.81 0.19 -0.07 -0.16 0.32 -0.01 0.50
L3xL7 -0.03 138.59 1.06 2.09 -3.92 -1.16 -0.81 0.12
L4xL5 0.03 178.05 0.85 2.07 -3.97 -0.04 0.02 -0.75
L4xL6 0.01 -69.73 -0.34 -0.51 0.40 0.63 -0.11 0.19
L4xL7 -0.04 199.77 0.64 0.79 -1.59 -0.48 0.63 0.23
L5xL6 -0.01 -689.89 0.30 -0.49 1.97 0.44 -0.30 0.32
L5xL7 0.03 -488.29 0.17 -0.17 -0.27 0.007 0.41 0.40
L6xL7 0.02 369.53 -0.86 -0.66 0.96 -0.02 0.33 -0.53
SD (Sˆij) 0.04 326.93 0.04 0.04 0.12 0.09 0.07 0.06
SD ( ik ij S
Sˆ −ˆ ) 0.06 506.48 0.06 0.06 0.19 0.13 0.10 0.09
SD ( kl ij S
Sˆ − ˆ ) 0.05 438.62 0.06 0.06 0.16 0.12 0.09 0.07
*L= inbred Lines; EH= ear height; DEY= dehusked ears yield; RS= reducing sugars; TS= total sugars; ST= starch; PTN= protein; EE=
negative effects, respectively. The L5 and L2 achieved the highest positive and negative Gˆi values for PTN contents with variation of 7.28 times higher than the SD. The range of variation from L1 and L6 for EE was 18.47 times higher than the SD, and the inbred lines had the highest positive and negative Gˆi values. These observations are important in the next experiments to analyze the correlation between the yield and the grain quality of improved populations. These populations will be derived from crosses among these parent inbred lines to produce genotypes with more stable sugar and reducing ST contents without affecting the crop yield (Scapim et al., 1995).
The estimates of the SCA (Sˆij) effects and the SD from all the 21 single hybrids are shown in Table 3. Low Sˆij values indicate that the hybrid performance is based on the combining ability. High Sˆij values (positive or negative) indicate that the performance of a particular cross is relatively better or worse than expected, based on the GCA from the inbred lines involved in the crosses. Next-to-zero values of Sˆij indicate that the parental line differs slightly from the mean frequency of favorable alleles of all the parent inbred lines involved in the crosses, while a Sˆij values at great intervals from zero indicates that the parental divergence is higher than the mean frequency of favorable alleles of all the parent inbred lines involved in the crosses (Cruz & Regazzi, 2004).
The most promising combinations are those with the highest estimates of SCA, which involved at least one of the parent inbred lines with the most favorable effect from the GCA (Scapim et al., 1995). The estimates of the EH effects are shown in Table 3. The Sˆij values for the height of ear from all the single hybrids were low, close to zero. This response was expected since the SCA effects were nonsignificant (p>0.05) indicating the unimportant relevance of this source of variation for these traits. The hybrids of highest positive effects for dehusked ear yield were L2xL4, L1xL6, L2xL5, L1xL3 and L6xL7. All the values from this trait
were at great intervals from zero. This response indicates that the divergence between the parent and the mean of favorable allele frequency is higher than from all the parents involved in the diallel cross.
The hybrids with the highest positive effects for FB were L2xL4, L3xL6 and L5xL7. The range of variation from the hybrids L2xL4 and L4xL5 was 21.93 times higher than the SD. The hybrids with highest positive effects on RS and TS were the L3xL7, L4xL5, L4xL7, L1xL6 and L1xL2 (Table 3). The range of variation for RS was 30.39 times higher than the value of the SD, and 53.87 times the SD value between the highest positive and negative values, respectively for these two traits. Among the parents, two hybrids had the L4, two had the L1 and two other hybrids had L7 inbred lines as common parents. The values of ST content tended to the opposite direction of the values from sugar contents, i.e., hybrids with a high positive effect for this trait had a negative effect for the ST content. The three hybrids with highest effects of SCA for PTN were the L3xL4, L1xL2 and L2xL7, and the range of variation was 18.75 times higher than the SD value. Line L1 was parent of two in three hybrids with the greatest SCA effect. The hybrids that most contributed to increases in the EE contents were the L4xL7, L2xL6 and L2xL5, and the range of variation was 15.29 times higher than the SD value (Table 3).
Finally, the inbred line of sweet corn highlighted in these crosses was the L4, and therefore it must be used in next hybrid combinations. The single hybrids L3xL7 and L4xL5 are indicated for specialty maize growers because of their crop yield and industrial quality.
ACKNOWLEDGEMENTS
The authors are thank to the National Council of Scientific and Technological Development, for the grants to the first author (Master’s degree), and the Genetic Breeding Program of the Universidade Estadual de Maringá, Paraná, Brazil.
REFERENCES
ARAGÃO CA. 2002. Avaliação de híbridos simples braquíticos de milho super doce (Zea mays L.) portadores do gene shrunken-2 (sh2sh2) utilizando o esquema dialélico parcial. Botucatu: UNESP-FCA. 101p (Tese doutorado).
ARAUJO EF; CORREA PC; SILVA RF. 2001. Comparação de modelos matemáticos para descrição das curvas de dessorção de sementes de milho-doce. Pesquisa Agropecuária Brasileira 36: 991-995.
BORDALLO PN; PEREIRA MG; AMARAL JUNIOR AT; GABRIEL APC. 2005. Análise dialélica de genótipos de milho doce e comum para caracteres agronômicos e proteína total. Horticultura Brasileira 23: 123-127. BRASIL. 2005. Ministério da Saúde. Agência
Nacional de Vigilância Sanitária. Métodos Físico-Químicos para Análise de Alimentos/ Ministério da Saúde, Agência Nacional de Vigilância Sanitária. Brasília: Ministério da Saúde. cap. IV. p.116-141 (Série A: Normas Técnicas e Manuais Técnicos).
BRAZ RF; GALVÃO JCC; FINGER FL; MIRANDA GV; PUIATTI M; ALMEIDA AA. 2006. Perda de peso pós-colheita de espigas de milho-verde em função de diferentes formas de acondicionamento. Revista Brasileira de Milho e Sorgo 5: 139-144.
CANIATO FF; GALVÃO JCC; FINGER FL; RIBEIRO RA; MIRANDA GV; PUIATTI M. 2004. Composição de açúcares solúveis totais, açúcares redutores e amido nos grãos verdes de cultivares de milho na colheita. Revista Brasileira de Milho e Sorgo 3: 38-44. CRUZ CD. 2006. Programa Genes - Biometria.
1. ed. Viçosa, UFV, 1: 382 pg.
CRUZ CD; REGAZZI AJ. 2004. Modelos biométricos aplicados ao melhoramento genético. Viçosa: Imprensa Universitária. 1: 390p.
FAO. 2008. Food and Agriculture Organization - FAO Statistical Databases. Available in DIALOG: www.apps.fao.org/defaut.jsp. Acessed in February, 7 2008.
GAMA EEG; PARENTONI SN; LEMOS MA. 1992. Tipos especiais de milho. In: EMPRESA BRASILEIRA DE PESQUISA AGROPECUÁRIA. Centro Nacional de Pesquisa de Milho e Sorgo. Relatório Técnico Anual 1: 164-165.
GRIFFING B. 1956. Concept of general and specific combining ability in relation to diallel crossing systems. Australian Journal of Biology Science 9: 463-493.
MITTELMANN A; MIRANDA FILHO JB; LIMA GJMM; HARA-KLEIN C; SILVA RM; TANAKA RT. 2006. Análise dialélica do teor de óleo em milho. Revista Brasileira de Agrociência 12: 139-143.
OLIVEIRA JUNIOR LFG; DELIZA R; BRESSAN-SMITH R; PEREIRA MG; CHIQUIERE TB. 2006. Seleção de genótipos de milho mais promissores para o consumo in natura. Ciência e Tecnologia de Alimentos 26: 159-165.
e tecnológicos do grão de milho. Circular Técnica Embrapa Milho 15: 1-6.
PEREIRA FILHO IA; CRUZ JC. 2002. Cultivares de milho para o consumo verde. Circular Técnica Embrapa Milho e Sorgo 15: 1-7. PEREIRA AF; MELO PGS; PEREIRA JM;
A S S U N Ç Ã O A ; N A S C I M E N TO A R ; XIMENES PA. 2009. Caracteres agronômicos e nutricionais de genótipos de milho doce. Bioscience Journal 25: 104-112.
SAS. 1999. Statistical Analysis System. Sas
Institute Inc., Cary, NC, USA.
SCAPIM CA; CRUZ CD; ARAÚJO JM. 1995. Cruzamentos dialélicos entre sete cultivares de milho doce. Horticultura Brasileira 13: 19-21. SCOTT AJ; KNOTT M. 1974. A cluster analysis
method for grouping means in the analysis of variance. Biometrics 30: 507-512.
SILVA DJ; QUEIROZ AC. 2009. Análise de alimentos: métodos químicos e biológicos. 3rd. ed. Viçosa: UFV. p. 47-51.
SILVA N. 1994. Melhoramento de milho doce.
In: ENCONTRO SOBRE TEMAS DE GENÉTICA E MELHORAMENTO, 11. Anais… Piracicaba: ESALQ. 11: 45-49. SPRAGUE GF; TATUM LA. 1942. General vs
specific combining ability in single crosses of corn. Journal of American Science Agronomy 34: 923-932.