I
INVESTORS ACTIVISM: THE CASE OF CEVIAN CAPITAL
HEDGE FUND CAMPAIGNS IN GERMAN COMPANIES
José Miguel Salgado da Silva
Dissertation submitted as partial requirement for the conferral of
Master in International Management
Supervisor:
Prof. Dr. Maria do Rosário Costa e Silva da Veiga, ISCTE Business School, Departament of Accounting
Co-supervisor:
Prof. Dr. Korbinian Eichner, Hochschule Pforzheim
II IN VE S TO R S ACTI VI S M: THE CAS E O F C EV IA N CAPITA L H E DG E F UN D C AMPAIG NS IN GE R MAN C OMPANI ES José M ig u e l Sa lg ad o d a Sil va
III
Abstract
The number of deals involving activist investors has been increasing over time. They buy a small portion of the companies' capital and seek from the executive and supervisory boards, through a more or less aggressive campaign, to get them to implement some change(s). There is, however, an intense debate between those who think that the action of these investors has a positive impact on companies and those who think that they only generate short-term gains at the expense of the companies' long-term performance.
In this work, we try to contribute to the debate by analysing the campaigns made in Germany by the largest European hedge fund activist, Cevian Capital. These campaigns targeted Munich Re, Bilfinger, ThyssenKrupp, and Demag Cranes. The work focuses mainly on two points: 1) whether or not the activist had a positive impact on the company, and 2) what has changed in the company during the period the activist was there. To answer the first point, an event study is performed, while for the second one an analysis of the evolution of the company's main indicators and financial ratios is made.
The results show a positive impact at the time of the announcement but are less conclusive about the long-term. Regarding the changes, there is no evidence of any significant improvement in the indicators and financial ratios of the companies.
Keywords: Investor Activism, Cevian Capital, Corporate Governance, Event study JEL Classification: C12 G34
IV
Resumo
O número de casos envolvendo investidores activistas tem aumentado de ano para ano. Eles compram uma pequena porção do capital das empresas e procuram junto dos conselhos executivo e de supervisão, através de uma campanha que pode ser mais ou menos aggressiva, conseguir com que elas implementem alguma(s) mudança(s). Há todavia, um debate intenso entre os que acham que a acção destes investidores tem um impacto positivo nas empresas e os que acham que eles apenas geram ganhos de curto-prazo em detrimento da performance de longo-curto-prazo das empresas.
Neste trabalho tentamos contribuir para este debate ao analisar as campanhas feitas na Alemanha pelo maior hedge fund activista europeu, Cevian Capital. Essas campanhas tiveram como alvo as empresas Munich Re, Bilfinger, ThyssenKrupp e Demag Cranes. O trabalho centra-se sobretudo em dois pontos: 1) se o activista teve ou não um impacto positivo na empresa, e 2) o que mudou na empresa durante o período em que ele lá esteve. Para responder ao primeiro ponto é feito um estudo de evento, enquanto que para o segundo é feita uma análise da evolução dos pricipais indicadores e rácios financeiros da empresa.
Os resultados revelam um impacto positivo aquando do anúncio, mas menos conclusivo relativo ao longo-prazo. Em relação às mudanças verificadas nas empresas, não há em nenhum dos casos evidências de uma melhoria significativa dos indicadores e rácios financeiros.
Palavras-chave: Investor Activism, Cevian Capital, Corporate Governance, Event study JEL Classification: C12 G34
V
Table of Contents
1. Introduction ... 1
1. Literature Review ... 3
2.1. Corporate Governance in Germany ... 3
2.2. Hedge fund as activists ... 4
2.3. Market reaction to the hedge fund activist campaigns ... 5
2.4. Changes on the target companies ... 8
3. Methodology ... 10
3.1. Event studies ... 10
3.2. Cevian Capital ... 14
4. Analysis of the activist campaigns ... 18
4.1. Munich Re ... 18 4.2. Bilfinger ... 27 4.3. ThyssenKrupp ... 37 4.4. Demag Cranes ... 47 5. Results ... 49 6. Conclusion ... 52 7. Bibliographic references ... 53
1
1. Introduction
Activist shareholders or investors have been around for a long time. In the 1980s, they were known as corporate raiders, not enjoying (as the name suggests) of a good reputation. At the time, the main strategy of this type of investors consisted of acquiring a company through a leveraged buyout (LBO) deal to then sell off many of its assets and make a profit. However, in many cases, the company ended up in a very poor financial situation. Some even went bankrupt as it was the case of Trans World Airlines (TWA), after the takeover by the US activist Carl Icahn.
“An activist shareholder is a shareholder of a corporation who attempts to use his or her equity stake in a company to achieve certain goals. The main goal of activist shareholders is bringing change within or for the company. They intend to affect the behaviour of a company by exercising their voting power or influencing other shareholders” (Corporate Finance Institute).
Nowadays, shareholder activism can come from different types of institutional investors such as pension funds, private equity funds, hedge funds, and others. Hedge funds activists, in particular, are subject to an intense debate regarding their impact on companies. Critics such as Martin Lipton (2013), claim that hedge fund activists obtain short-term gains at the expense of the long-term performance. However, other authors (e.g.: Brav et al., 2008; Bebchuk et al., 2015) defend that they generate value on average. Activist deals rose 34% a year between 2000 and 2014 (Bain & Company study, 2015). Given their growing importance, it is therefore important to understand what is more true, if hedge fund activists help to create value in the target companies or, on the contrary, they contribute more to destroying it. And if at first, hedge fund activism happened mainly in the US, in recent years it has also spread to other markets. Even in Germany, where the corporate governance system differs greatly from the one in the US, activist campaigns are on the rise.
This paper studies the campaigns of the largest European hedge fund activist, Cevian Capital, in Germany (Munich Re, Demag Cranes, Bilfinger, and ThyssenKrupp). For each of these campaigns, we analyse 1) whether Cevian had a positive impact on the target company, and 2) what has changed in the company during that period. As a
2 result, this paper seeks to contribute to the literature by providing additional evidence for the ongoing debate about hedge fund activism. In particular, the literature covering the campaigns against German companies are still scarce. The clarification of the debate makes a direct contribution to the good functioning of the economic activity, the economy, and the society in general.
The paper is thus divided into four parts. The first part is a brief literature review of the relevant topics for this work. The second part is about the methodology used. The third part is the analysis of each campaign. The last part is dedicated to the interpretation of the results.
3
1. Literature Review
2.1. Corporate Governance in Germany
In the definition of Gillan and Starks (1998), corporate governance is the system of laws, rules, and factors that control operations at a company. Good corporate governance practices mitigate the existence of agency problems. The agency problems, i.e. the conflicts that arise between shareholders, the board and the corporate management due to the separation of ownership and control, provide the basis for shareholder activism (Gillan and Starks, 1998). There is therefore a close relationship between corporate governance and shareholder activism (including hedge fund activism). Shareholder activism emerges often as an attempt to improve corporate governance practices. Therefore, before studying hedge fund activism in Germany, it is important to know how its corporate governance works. Below, we describe the German corporate governance as opposed to the American one, which, given the largest number of studies, is the one behind most of the available literature.
German corporate governance system differs greatly from the American one. The American corporate governance system is a market-centred model, where the capital structure of the firm is composed by a big number of small shareholders (Georgen et al., 2008a). In addition, the American model is also characterized by an active market for corporate control and where the board (one tier system) is composed by independent directors that try to maximize shareholder wealth (Sudarsanam and Broadhurst, 2012). The German corporate governance system is often described as an insider-controlled and stakeholder-oriented system (Schmidt et al., 2005). The German corporate governance code is also characterized by a two-tier system, composed by a management board and a supervisory board. The management board has an executive role, while the supervisory board appoints, supervises and advises the members of the management board. The supervisory board is composed according to the mandatory co-determination. It means that for companies with more than 500 employees, 30% of the supervisory board members must be employee representatives. This number goes up to 50% for companies with more than 2000 employees (Deutscher Corporate Governance Kodex, 2017). Moreover, there is a high concentration of voting power in German companies. Becht and Böhmer (2003) refer that 82% of all listed Aktiengesellschaft
4 (AG) have a large shareholder that holds more than 25% of the firm’s capital. They also find that “other companies and families” are the major shareholder groups of the German companies. “Financial institutions”, in particular big commercial banks and large insurance companies come after, but their board representation is often larger than their ownership. Their influence comes not only from the ownership they hold in the companies, but also from the use of voting proxies on behalf of their clients and from the important role as main lenders of German companies (Schmidt et al., 2005). Apart from banks and insurance companies, the presence of others institutional investors in Germany was, for many years, not relevant, which contributed to a small expression of shareholder activism (Georgen et al., 2008b).
Recent regulatory reforms, however, reduced the influence of German banks on the ownership control of German companies (Schmidt et al., 2005). The control vacuum left by the German banks opened up the German companies to other capital markets participants. This has brought the German corporate governance system closer to the Anglo-Saxon and created opportunities to these new participants to implement activist strategies (Bessler et al., 2015).
2.2. Hedge fund as activists
In the last years, activist investors assumed a greater importance among institutional investors. According to a study by Bain & Company (2015) activists’ deals rose 34% a year between 2000 and 2014. According to another study (The Activist Investing Annual Review 2018), between 2013 and 2017, the number of public companies subjected to activist demands went up from 570 to 805 companies by year, reinforcing this trend. This group of investors actively seek to influence the target’s supervisory board and management in search of increasing returns. From all the investors, hedge funds are not the only agents conducting activism campaigns on companies. Many other institutional investors such as pension funds, mutual funds or private equity funds are also activists, but hedge funds cause a greater division of opinion in relation to its interventions as activist.
A key distinction between hedge funds and private equity funds lies on the stake’s size that they acquire on target companies. While private equity funds usually acquire the whole stake of the target company (and thus get all the profits of its interventions as
5 well as all the risks), hedge fund activists usually only acquire 5%-10%. Hedge funds, therefore, need to convince the other shareholders that their plans will add value to the company and/or shareholders. When compared to mutual funds or pension funds, the key distinction lies on the fact that hedge funds invest in much fewer companies. This allows them to monitor these companies more carefully and to play a more active role. In addition to these two distinctions, hedge funds have also other features that help to describe better their nature. Hedge funds have a higher incentive to generate positive returns due to their fee structure (Brav et al., 2008). Generally they charge a 2% fixed annual fee and a 20% performance fee. This performance fee is much higher than the ones used by other institutional investors, which in theory make them focus more in the short-term results. Besides, hedge funds are not subject to the regulation that governs mutual and pension funds, which allow them to have concentrated positions in a small number of companies and to use leverage as well as derivatives on their investments (Brav et al., 2008). The use of derivatives is particularly relevant because allow hedge funds to accumulate additional voting rights before the general shareholders meeting (Bessler et al., 2015). Finally, many hedge funds have “lock-up” periods of two or more years protecting them from liquidity problems of eventual early withdrawals (Bessler et al., 2015).
2.3. Market reaction to the hedge fund activist campaigns
The study of activism has not always focused on hedge funds. For many years, studies about activism did not isolate hedge funds from other groups of activists. They studied activism as one group, which they called “shareholder activists”. Shareholder activists would not only refer to hedge funds activists but also to other institutional investors such as pension funds or mutual funds. In the empirical results of these studies, shareholder activism did not significantly affect firms’ performance in terms of abnormal returns (Black, 1998; Karpoff, 2001).
Studies started then to focus on hedge funds only as they have some particular characteristics. In general, empirical research for the US provides evidence of positive performance from firms targeted by hedge funds activists. Research by Klein and Zur (2009) reveals that target firms earn, on average, 10.3% abnormal stock return during a
6 61 day period (-30; +30) surrounding the initial 13D filling1, a return significantly higher than non-target firms with identical characteristics. Similarly, Brav et al. (2008) show an abnormal stock return of approximately 7%, during the (-20; +20) announcement window, and with no evidence of a reversal during the subsequent year. Boyson and Mooradian (2011) find a return in excess of the matched sample of about 11%, during a 51 day period (-25;+25) around the filing date. They also observe that the results are more pronounced when hedge funds pursue aggressive and well-defined objectives. Slightly different from the authors above, Clifford (2008) instead of comparing the performance of target versus non-target companies of hedge fund activism, he compares activist and passivist investments made by the same group of hedge funds. In his view, this approach rules out the possibility of excess return around the filing date be due to the better selection ability. In his research, firms targeted by hedge funds activists earn a 3.39% excess return surrounding the filling date while firms targeted by hedge funds passivists earn 1.64% return, still suggesting a superior performance from hedge fund activists.
An interesting point about the short-term market reaction is that, as noted by Brav et al (2008), the main effect on the abnormal trading volume does not happen on the day of the event, but in the 10 days preceding the filing date. He comes up with two possible explanations for this, the existence of a “wolf pack” and the existence of “tipping”. The wolf pack consists of a set of hedge funds, in a non-formally coordinated manner, investing in the target company. Tipping is about the activist revealing his intention to a small number of investors before being public in exchange for other favours.
The results presented before, show a positive stock return in the short-term for companies targeted by hedge fund activists. Nevertheless, critics of hedge fund activism claim that short-term gains occur at the expense of the long-term performance (see Lipton, 2013). In response to this claim, Bebchuk et al. (2015) conducted a study where they analyse the long-term effects of hedge fund activism. They find no evidence of negative abnormal return in the targeted companies for the period that goes from the first-month after intervention (i.e., when the hedge fund position falls below the 5%
1 Schedule 13D is a SEC filing that investors must file within 10 days of acquiring more
than 5% of any US publicly-traded equity security class. It has information about the owner of the security, including the purpose of the transaction. Hence, it is used to identify hedge funds that actively seek to influence the firm or its management, i.e., the activists.
7 threshold) until either three or five years afterward. In their view, the stock appreciation surrounding the announcement date is hence the market correctly anticipating the effects of the activist intervention. However, deHaan, Larcker and McClure (2019) find that equal-weighted long-term returns are driven by the 20% smallest firms, while the remaining 80% of the firms experience insignificant negative long-term returns. And if value-weighted basis is used instead, then the long-term returns are not significantly different from zero.
Looking now to Germany, we see that cases of hedge fund activism like the ones involving Deutsche Börse, TUI, ThyssenKrupp, Kabel Deutschland, and Celesio are becoming more and more common. Nevertheless, there are still few studies addressing this topic, especially when compared with the US. An important explanation for this is that in Germany although investors have to notify BaFin (German Federal Financial Supervisory Authority) every time they cross the 3% threshold in the company's capital, they do not have to specify the purpose of the transaction as it happens in the US. As a result, to identify the companies that were targeted by activist hedge funds, the authors need to do news-based research, which makes this process not so easy. This is precisely what Bessler et al. (2015) do. Despite the different way of collecting the data, the results are consistent with the ones in the US. Bessler et al. (2015) find that target companies in Germany outperform their benchmark (CDAX) by 9.38% during the (-45; +45) window, in terms of mean CARs (cumulative abnormal returns). Regarding the long-term horizon, the results also indicate superior performance from the target companies, although some of this outperformance seems to be explained by security selection. Interestingly, however, when splitting the hedge fund events into aggressive and aggressive engagements, the results show contrary evidence with the US. i.e., non-aggressive hedge funds generate superior returns than non-aggressive hedge funds. This happens because although aggressive hedge funds outperform their peers in the period surrounding the event date, they then underperform them after that period, which "suggest that aggressive hedge funds attempt to expropriate the target firm's long-term shareholders as well as debt holders and to generate temporary increases in share prices that allow them to sell out at higher prices" (Bessler et al., 2015). Mietzner and Schweizer (2014) study both hedge funds and private equity funds as activists. In relation to hedge funds, they find a CAR of 6.24% for the (-20; +20) window around the announcement date. However, the same sample shows a negative performance from the
8 target companies for the long-term. The study reveals a mean and median BHAR (buy-and-hold abnormal returns) of -1.02% and -21.46%, respectively, over a 250-day holding period. Similarly, Drerup (2014) observes a short-term gain in the target companies with abnormal returns of 4.22% during the 20 days leading to the publication but followed by long-term negative returns that reverse that initial gain. With these two last studies reaching different results for the long-term performance than Bessler et al. (2015), the conclusion is therefore uncertain.
2.4. Changes on the target companies
If there is some evidence of a positive reaction from investors to the intervention of hedge funds activists, then that reaction should be the result of perceived changes in the target companies. Changes at the operating performance of target companies are probably the most addressed ones, but changes with free cash flow, leverage, and R&D are frequently covered too.
The empirical studies are not very conclusive regarding the impact of the intervention in the operating performance of the target companies. Some studies reveal an improvement in operating performance of target companies after the intervention. Brav et al. (2008) find an increase between 0.9 and 1.5 percentage points in the ROA (EBITDA/Assets) two years after the intervention. Bebchuk et al. (2015) also find statistically significant improvements in each of the years three, four, and five after the intervention. Boyson and Mooradian (2011) compare the ROA differences between target and matching companies one year after activism with one year before activism, and they also conclude that ROA improves after activism. However, some other studies (Klein and Zur, 2009 and deHaan et al., 2019) do not find evidence of such improvement.
Regarding other changes, Klein and Zur (2009) find that in the year after the initial Schedule 13D, target companies double their dividends, increase their debt-to-assets ratio and significantly decrease their cash and short-term investments. However, in the sense that less cash and more debt increases the credit risk of a company, for Klein and Zur (2011) these changes reveal also a transfer of wealth from bondholders to shareholders. Brav et al. (2008) show an increase in the total payout ratio and in the book value leverage too, while Boyson and Mooradian (2011) refer a decrease in the cash as a percentage of assets. In addition to increased leverage and shareholder payout,
9 Coffee and Palia (2015) also identify reduced long-term investment in research and development (R&D) as a third change associated with hedge fund activism.
10
3. Methodology
3.1. Event studies
In accounting and finance, event studies are used to measure the impact of a specific event on companies’ value. As a result, most empirical studies of hedge fund activism use this methodology to infer about the impact of activist campaigns on the target companies. In this paper, we will use it to look to the impact of each individual campaign.
We can conduct an event study to measure the short-term as well as the long-term impact of a specific event. But, while short-term methods are quite reliable, the long-term ones still remain with serious limitations (Kothari and Warner, 2007). Nevertheless, as the hedge fund activism literature uses both, we will explore the two time horizons too.
Short-term methodology:
We will describe next a set of steps that a typical event study follows: i. Define event of interest and event window
The event of interest is the event that is likely to create a significant security price shift. In this paper, it is the day that the activist announces his campaign. The event window is the period surrounding the announcement over which the event may alter the security price. It can have just the day of the event, but usually it is larger, containing some time before and after the event too. Mackinlay (1997) uses a 41-day event window that includes 20 days pre-event, the event day and 20 days post-event.
ii. Define the estimation window
The estimation window is the period we use to estimate the parameters of the model used in the calculation of the normal returns. Normal return is the expected return of the security if the event did not happen. There is no specific rule for the length of the estimation window, but a too short or too long estimation window may result in poor
11 parameters estimations. Mackinlay (1997) uses an estimation window of 250-days prior to the event window and for that reason that is the length we will adopt.2
Source: Mackinlay (1997) iii. Calculate the normal return
As mentioned above the normal return is the expected security return if the event did not take place. There are different models we can use to measure the normal return. Mackinlay (1997) groups these models in two categories: statistical and economic. The statistical models rely only on statistical assumptions in regard to the behaviour of the asset’s return, while the economic models also include some economic restrictions in addition to the statistical assumptions. Three statistical models identified by the author are: the constant mean return model, the market model and the market-adjusted return model. From the economic models, Mackinlay (1997) gives the example of the Capital Asset Pricing Model (CAPM) and the Arbitrage Pricing Theory (APT). In this paper, we will use the market model for three reasons: 1) the use of economic models adds complexity to the analysis without delivering substantial gains in the results over the market model; 2) it is among the statistical models the one with better estimation potential in most of the times; and 3) it is widely used in the main literature of hedge fund activism.
The market model relates the return of a security to the return of the market portfolio. In this study, we use CDAX as the market portfolio, which is a broad based index of the Frankfurt Stock Exchange. The normal return for each day of the event window is given below by equation I.
𝑹̂𝒊𝒕 = 𝜶̂𝒊+ 𝜷̂𝒊𝑹𝒎𝒕+ 𝜺𝒊𝒕 (I)
Where,
2
In some cases the post-event window can also be included in the estimation window.
𝑡0 𝑡1 0 𝑡2 𝑡3
Estimation window (L1) (L1)
Event window (L2) Post-event window (L3)
12 𝑅̂it− return of security i in the period t
Rmt − return of the market portfolio in the period t
εit− residual term (by assumption E(εit)=0 and var(εit) = 𝜎𝜀𝑖
2)
𝛼̂𝑖, 𝛽̂𝑖 and 𝜎𝜀𝑖
2 − parameters of the market model
The parameters of the market model are estimated using the Ordinary Least Squares (OLS) and their equations are:
𝜷̂𝒊=∑ (𝑹𝒊𝒕−𝝁̂𝒊)(𝑹𝒎𝒕−𝝁̂𝒎) 𝒕𝟏 𝒕=𝒕𝟎+𝟏 ∑𝒕𝟏𝒕=𝒕𝟎+𝟏(𝑹𝒎𝒕−𝝁̂𝒎)𝟐 (II) 𝜶̂𝒊= 𝝁̂𝒊− 𝜷̂𝒊𝝁̂𝒎 (III)
iv. Calculate the abnormal return and the cumulative abnormal return
The abnormal return (AR) is the difference between the normal return and the actual return. The first step hence is to calculate the abnormal return for each day of the event window (equation IV) and then sum all the daily AR results to find the cumulative abnormal return (CAR)(equation V).
𝑨𝑹𝒊𝒕 = 𝑹𝒊𝒕− 𝜶̂𝒊− 𝜷̂𝒊𝑹𝒎𝒕 (IV)
𝑪𝑨𝑹𝒊 = ∑𝒕𝟐 𝑨𝑹𝒊𝒕
𝒕=𝒕𝟏 (V)
v. Calculate the significance test
The significance test is the final step of the event study. The goal is to determine if the event impacted the stock returns at a significant level. Below, the equations VI and VIII present the two significant tests to be used. The first has the focus in one specific point and tell us whether the abnormal return of a specific day was significant, while the second is used for an interval and therefore tell us whether the cumulative abnormal return for a specific interval was significant. Defining the null hypothesis (𝐻0) as “the
event had no impact on the stock returns”, the tests statistics are given by: 𝜽𝟏= 𝑨𝑹𝒊𝒕
13 Where 𝑺𝑨𝑹𝟐 𝒊 = 𝟏 𝑳𝟏−𝟐∑ (𝑨𝑹𝒊𝒕) 𝟐 𝒕𝟏 𝒕=𝒕𝟎 (VII) 𝜽𝟐= 𝑪𝑨𝑹𝒊 𝑺𝑪𝑨𝑹 ~ 𝒕𝑳𝟏−𝟐 (VIII) Where 𝑺𝑪𝑨𝑹𝟐 = 𝑳 𝟐𝑺𝑨𝑹𝒊 𝟐 (IX)
If the absolute value of the test statistic is greater than the absolute value of the critical point, then we reject the null hypothesis, i.e., the event has a statistically significant impact on the stock returns.
Long-term methodology
There are two main methods used to calculate the abnormal returns in a long-term event study. The first method is the buy-and-hold abnormal return (BHAR) and it consists in comparing the returns of a buy-and-hold investment strategy for an event company versus a similar non-event company or a matching benchmark portfolio, during a predetermined period. Its calculation is presented by the below equation (X):
𝑩𝑯𝑨𝑹𝒊(𝒕, 𝑻) = ∏𝑻𝒕=𝟏(𝟏 + 𝑹𝒊,𝒕) − ∏𝑻𝒕=𝟏(𝟏 + 𝑹𝑩,𝒕) (X)
Where 𝑅𝑖 is the return of the event company and 𝑅𝐵 is the return of the non-event company or the matching benchmark portfolio.
The second method is the Jensen-alpha approach (or the calendar-time portfolio approach). This method put together in a same portfolio the companies that experienced an event. And it compares the return of this portfolio with expected return given by a multifactor regression model such as CAPM or Fama-French three factor. If there is excess return that is not explained by the model, i.e., when alpha is significantly different from zero, then we have an abnormal return caused by the event. If alpha is not significantly different from zero, then the event did not have a substantial impact on the company.
Although not as reliable as the short-term methods used to analyse the abnormal returns of an activist campaign, the long-term methods of an event study are used in almost every empirical study of hedge fund activism. However, two major problems of long-term tests, as Kothari and Warner (2007) explain, are the sensitivity to a small error in
14 the risk adjustment and to the model choice. While those problems in a short-term event study do not have severe consequences on the results, in a long-term one they do.
3.2. Cevian Capital
Cevian Capital is a Swedish activist hedge fund founded in 2002 by Lars Förberg and Christer Gardell. Before, from 1996 to 2001, the duo worked together at Custos AB, a Swedish industrial company, where Gardell was CEO and Förberg CIO. Their strategy consisted of acquiring a minority stake in good public companies that were underperforming and turn them around. It was with this strategy that they then decided to create their own investment firm, Cevian Capital. In their first fund "Cevian Capital I", active from 2002 to 2006, they were able to improve the operating performance in the two companies they invested in, Lindex and Intrum Justitia, leading to an increase of their shares prices. The good performance achieved in their first fund helped them to oversubscribe their second fund "Cevian Capital II", allowing the fund to raise €1.5 billion (Mcintosh, 2012). At the end of 2018, the market value of current activist positions of Cevian Capital amounted to $11.2 billion, making it the largest European activist investor and the third in the world (Lazard, 2018).
Cevian Capital distinguishes itself from other activists by its style of activism. Cevian engages with the management and board of the target companies to find solutions that can improve companies’ performance and therefore increase their value. But, it rarely adopts an aggressive posture. Cevian, for instance, has never entered in a proxy fight to gain a seat in the company's board, as it frequently happens with other activist investors. Nevertheless, Cevian has currently a seat in nine boards across six countries. Also, it rarely goes public in confrontations with the management/board of the target companies. Instead, it works behind the scenes by establishing a constructive dialogue with them.
A traditional strategy adopted by many hedge fund activists consists to invest in sound companies and, through a special dividend or shares repurchase, transfer to the shareholders some of the extra cash that the company can possibly have. In Cevian’s case, the strategy is by default different. As said before, Cevian seeks to improve the operational performance of the target companies and thereby increase their value.
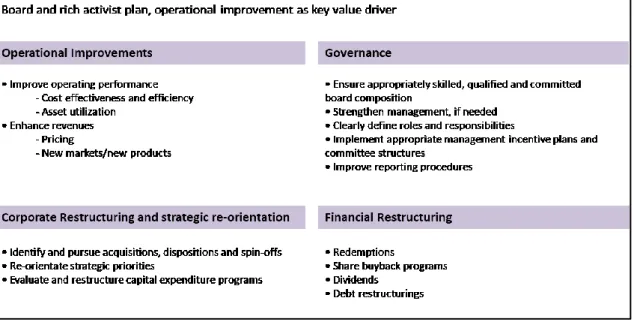
15 Therefore, operational improvement is the key value driver in the value enhancing framework that Cevian uses when is planning an intervention in a target company. However, in order to deploy these improvements, Cevian has in many cases to intervene in three other areas: corporate restructuring and strategic re-orientation, governance and financial restructuring. These three areas are thus complementary to the first one, since that, many times, it is the changes on these areas that allow the target companies to improve operationally and thus to change their fundamental value. Figure 1 below shows in more detail this framework where some of the specific actions of each of these four areas are also presented.
Figure 2: Cevian Capital enhancing value framework
Source: (McIntosh, 2012)
Another distinction that makes Cevian different from most hedge fund activists refers to the time span of its investments. In fact, a big criticism against hedge fund activists is that they are short-term oriented. But, such argument does not reflect in Cevian’s approach. Cevian frequently states that its goal is to get substantial returns of its investment over a three to five years period (Mcintosh, 2012). In two of its most successful investments, Danske Bank and Volvo, Cevian held these positions for six and eleven years, respectively. In Danske Bank, Cevian built a 9% stake in 2011 and sold it in November 2017, generating a total shareholder return of 273% (including dividends) over this period (Arnold & Fortado, 5 November 2017). In Volvo, Cevian
16 entered in the company’s capital in 2006, and in December of 2017 the hedge fund announced that it has sold its 8.2% stake (corresponding to 15.6% of voting rights) in AB Volvo (truck and bus division) to the Chinese group Geely Holding, owner of Volvo Car Group. The deal was done by 3.25 billion euros, allowing the Swedish activist to make a profit of about 2 billion euros (Milne, 2017b). These two investments exemplify well the long-term engagement of the Swedish activist in the target companies. In both cases, Cevian invested in underperforming companies and gradually was able to build trust among the other shareholders. As it happens in many of its campaigns, it has gained a seat in the board of both companies, which it has used to exert more influence on the strategic direction of them. This posture and way of conducting activism seems to fit well in the European corporate governance environment, especially in the DACH region, Scandinavian countries and UK, where Cevian is more active. Among the many activist campaigns since its inception, Cevian has only had one realised loss, which was with the German reinsurer Munich Re. In this investment, the fund lost 60 million euros between 2007 and 2009, corresponding to the period that it held a position in the company. But, even in Munich Re, it is difficult to talk about a failing campaign, because the fund sold its position in Munich Re to redeploy capital into other positions (Lovell, 2018).
Although Cevian has investments in some countries around Europe, our purpose here is to focus only on the ones in Germany. However, as it also happens with other hedge funds, the available information about Cevian and its investments is not much. Therefore, the way we found to identify the campaigns pursued by the Swedish activist was to use the news. More specifically, we used the archive of the German business newspaper “Handelsblatt”. Taping in “Cevian Capital” in the searching bar of the archive, it returned 381 results. Then, a filter of the archive identifies the companies and organizations showed in these results. From this list of companies identified by the archive, we ignore the non-German ones. For the remaining companies, we checked each one individually to confirm if they were targeted by Cevian. The final result is composed by four German companies: Munich Re AG, Demag Cranes AG, Bilfinger SE and ThyssenKrupp AG.34 Therefore, these are the four activist campaigns pursued by Cevian in Germany that we will study.
3 Cevian also had a position in Daimler AG of about 2%, but there is not enough information available to
17
4
ThyssenKrupp is the only one of the four companies where Cevian has still a position in its capital. Therefore the analysis cannot be complete, because it is not possible to know what the future result of the activism will be. Nevertheless, I will cover the campaign until the present day.
18
4. Analysis of the activist campaigns
The analysis of each of these campaigns will be separated in four points: a) Portrait of the target company5
b) Description of the activist campaign c) Event study
d) Evolution of the key financial figures and ratios
4.1. Munich Re
a) Portrait of the target company
Founded in 1880 by Carl Thieme, Munich Re AG (Muenchener Rueckversicherungs Gesellschaft AG) has developed into one of the leading risk carriers in the world. With its headquarters in Munich, Germany, the company operates globally through its three different business segments: a) Reinsurance, b) Primary insurance, and c) Asset management.
The reinsurance business segment is the biggest source of income for the company. A reinsurance company works basically as an insurance company for insurance companies. The idea is that an insurance company can spread the risk of a major local event such as a hurricane. Therefore, the business of a reinsurance company is by nature international so that the costs with such event can be covered by gains of other locations. That is also what happens with reinsurance group of Munich Re. The reinsurance group is present in every continent (with the exception of Antarctica) and is one of the world’s leading reinsurers. The business of the reinsurance group is divided in two different classes: life and health and property-casualty.
The primary insurance business segment is the second source of income for Munich Re group. It is composed by the ERGO Insurance Group, the Europäische Reiseversicherung, the Watkins Syndicate and the Mercur Assistance. Most of the premium income (95%) from this segment comes from the ERGO Insurance Group that
5 The companies are described based on their profiles at the time of the campaigns. Information is
19 operates essentially in Europe, with a strong presence in Germany. Similarly to the reinsurance group, the primary insurance business is then also divided in life and health and property-casualty.
Lastly, the asset management segment refers to the activity of the company MEAG (MUNICH ERGO AssetManagement GmbH). The company is responsible for the investment activities of Munich Re and ERGO and is held 60% by Munich Reinsurance Company and the remaining 40% by ERGO Insurance Group. It is the third and last source of income for the Munich Re group.
Figure 3: Munich Re Group business segments
Source: Munich Re Group Annual Report 2007
Munich Re group is listed in the German stock market. This means that the company has a two-tier system, i.e., it has a management board and a supervisory board. In 2007, Dr. jur. Nikolaus von Bomhard was the chairman of the management board, while Dr. Hans-Jürgen Schinzler was the chairman of the supervisory board and both chairs have not changed during the period Cevian was a shareholder of the company. Before becoming chairman of the supervisory board, Dr. Hans-Jürgen Schinzler was also chairman of the management board until 2003, when he was then replaced by Mr Bomhard. Curiously, both have been their entire careers in the Munich Re, which they joined after finishing their studies.
20 b) Description of the activist campaign
On December 7, 2007, Cevian announced that it has acquired nearly 3% of Munich Re’s capital. For Lars Forberg, co-founder of Cevian, “there was a good potential in the company” adding that Munich Re could improve “strategically and operationally”. However, he also highlighted the importance of having that discussion with the company’s management (O’Donnell & Odefalk, 2007). This point of view reveals not only the long-term perspective that characterizes Cevian’s investments, but also the non-hostile way the fund interacts with the companies’ management.
In the opinion of analysts, Cevian intended to sell the insurer ERGO (given that for them ERGO was not fully reflected in Munich Re valuation) and to make Munich Re focus on its core business – reinsurance. However, on Munich Re’s management side, ERGO was a core part of the business and therefore it had no intention of selling it. The fact is that Cevian never assumed publicly that intention. And that was exactly what Christer Gardell, the other co-founder of Cevian, told to Handelsblatt journal a few months later, at the annual general meeting of 2008 (Höpner & Steuer, 2008).
What Christer Gardell believed, however, was that Munich Re could double its value in a period of two to three years (Steuer, 2008). But in reality that never happened. Instead, Munich Re share price went from 131 to 102 euros in the two and half years that Cevian was a shareholder. In May, 2010, Cevian announced that had sold its participation in Munich Re, at the same time it also announced to have acquired a position in Demag Cranes AG. Nevertheless with dividends and shares buybacks, Cevian claim to have had a return of 6.7% with the investment in Munich Re (Handelsblatt, 2010a).
Cevian eventually benefited from the "Changing Gear" initiative that was announced in spring 2007, which aimed to distribute € 8bn by the end of 2010 through a share buyback programme (Munich Re Annual report, 2007).
c) Event study
In this section, we analyse the impact of the announcement of the entry of Cevian Capital in the capital of Munich Re. If the announcement is perceived as positive for the company, then the market must react favourably to it, leading to an appreciation of the value of the stock. In the long run, this appreciation may or may not reverse depending on the activist's ability to influence the company's performance. The methodology
21 behind this analysis is that of an event study. And this section is therefore divided into two parts: the short term and the long term performance.
i. Short-term performance:
The study of the short-term impact of the campaign is done by testing if the event caused significantly abnormal return (AR) and cumulative abnormal return (CAR) in the period around the announcement day. To calculate the abnormal return it is first necessary to calculate the normal return. To find the normal return, we use the market model defined by the equation I:
𝑅̂𝑖𝑡 = 𝛼̂𝑖 + 𝛽̂𝑖𝑅𝑚𝑡+ 𝜀𝑖𝑡
Alpha and beta are coefficients of the model and are estimated using an estimation window of 250-day prior to the event window. Alpha and beta are respectively, the intercept and the slope of the regression between the Munich Re stock returns (MUV2) and the market index returns (CDAX)6. Below, figure 4 shows the estimated values of
these coefficients as well as the variance and the standard deviation: Figure 4: Market model coefficients
After estimating the coefficients of the market model, we can then proceed with the calculation of the normal return of the MUV2 during the event period (-20: +20). The abnormal return results from the difference between the security actual return and the normal return. Table 1 presents the abnormal return and the significance test for each day of the event window.7
Table 1: Abnormal return and significance test of MUV2
6
MUV2 and CDAX returns use the daily adjusted close price in their calculation.
7
*, ** and *** represent the test results respectively at 10%, 5% and 1% significance level; 0 represents the announcement day, -1 represents one day before the announcement, 1 represents one day after the announcement, and so one.
Alpha -0,00062 Beta 0,81434 Sample var 0,00005 Sample std dev 0,00714 t Ri (MUV2) Rm (CDAXX) Normal Return Abnormal Return t-test (AR) -20 -0,0158 -0,0035 -0,0035 -0,0123 -1,7262 *
22 As table 1 shows, the announcement day (t=0) was the only day, from the whole event window, where Munich Re stock had a significant fluctuation over the market. The
-19 0,0064 -0,0032 -0,0032 0,0096 1,3468 -18 -0,0022 -0,0061 -0,0055 0,0034 0,4709 -17 0,0002 0,0028 0,0017 -0,0015 -0,2097 -16 -0,0107 -0,0157 -0,0134 0,0027 0,3789 -15 -0,0084 -0,0091 -0,0080 -0,0004 -0,0609 -14 -0,0151 -0,0183 -0,0155 0,0004 0,0537 -13 0,0044 0,0150 0,0116 -0,0072 -1,0133 -12 -0,0132 -0,0185 -0,0157 0,0025 0,3473 -11 0,0073 0,0047 0,0032 0,0041 0,5679 -10 0,0088 0,0082 0,0061 0,0028 0,3871 -9 0,0027 -0,0037 -0,0037 0,0063 0,8848 -8 0,0036 -0,0036 -0,0035 0,0071 0,9966 -7 0,0159 0,0270 0,0214 -0,0055 -0,7661 -6 0,0085 0,0059 0,0042 0,0043 0,6018 -5 0,0064 0,0141 0,0108 -0,0045 -0,6248 -4 -0,0002 -0,0047 -0,0045 0,0043 0,6007 -3 -0,0040 -0,0055 -0,0051 0,0011 0,1481 -2 0,0110 0,0176 0,0138 -0,0027 -0,3786 -1 -0,0018 -0,0009 -0,0014 -0,0005 -0,0675 0 0,0516 0,0077 0,0056 0,0460 6,4427 *** 1 0,0040 0,0049 0,0034 0,0006 0,0783 2 -0,0085 -0,0026 -0,0027 -0,0058 -0,8096 3 0,0032 0,0068 0,0049 -0,0017 -0,2370 4 -0,0143 -0,0194 -0,0164 0,0021 0,2939 5 0,0015 0,0027 0,0016 -0,0001 -0,0121 6 -0,0079 -0,0171 -0,0145 0,0066 0,9249 7 0,0045 0,0036 0,0023 0,0022 0,3058 8 0,0017 -0,0023 -0,0025 0,0042 0,5911 9 0,0026 0,0041 0,0028 -0,0001 -0,0177 10 0,0092 0,0168 0,0131 -0,0038 -0,5344 11 0,0093 0,0040 0,0026 0,0067 0,9330 12 0,0051 0,0041 0,0027 0,0024 0,3430 13 -0,0014 -0,0135 -0,0116 0,0103 1,4404 14 -0,0062 -0,0067 -0,0061 -0,0001 -0,0124 15 -0,0002 -0,0144 -0,0124 0,0121 1,7014 * 16 -0,0052 -0,0029 -0,0030 -0,0022 -0,3133 17 -0,0098 0,0053 0,0037 -0,0135 -1,8864 * 18 0,0016 -0,0123 -0,0106 0,0123 1,7167 * 19 0,0031 -0,0108 -0,0094 0,0124 1,7436 * 20 0,0032 0,0003 -0,0004 0,0036 0,5016
23 stock return on that day was more than 4% higher of its expected value. This variation is significant even at 1% significance level. With the exception of few days (-20, +15, +17, +18, +19) in the extremities of the (-20; +20) event window, the rest of the days do not present significant abnormal returns. But even these days are only significant at 10% significance level and do not really seem to be related with the event itself. Therefore, from the table, we can conclude that the Cevian’s announcement caused a very positive reaction from other investors in the market, but such reaction was mainly concentrated on the day of the announcement. The chart in the figure 5 below demonstrates well this situation. The blue bars are the daily abnormal returns of MUV2, while the red line represents the cumulative abnormal returns.
Figure 5: Abnormal return and cumulative abnormal return of Munich Re over the (-20; +20) event window
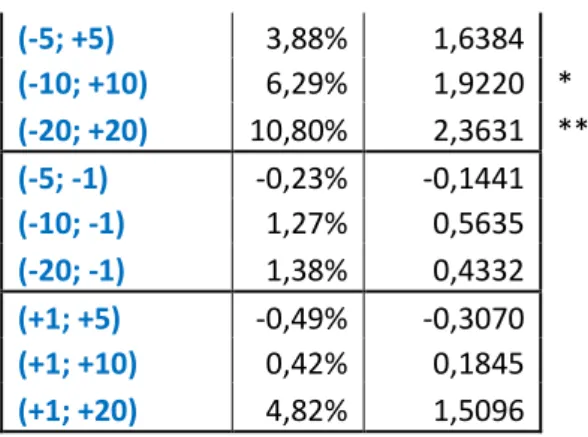
The cumulative abnormal return line has an upward trend that is mostly due to the sudden jump of the abnormal return at the announcement day. Not surprisingly, as Table 2 shows, the intervals only before or only after the event do not reveal a CAR significantly different from zero. In fact, the intervals with CARs significantly different from zero, they all include the announcement day. This reinforces the idea highlighted before with table 1 that the impact caused by the event is mostly concentrated in the announcement day.
Table 2: Cumulative abnormal returns and its significance tests for different interval periods
Interval CAR t-test (CAR) (-1;+1) 4,61% 3,7259 *** -2,00% 0,00% 2,00% 4,00% 6,00% 8,00% 10,00% 12,00% -20 -18 -16 -14 -12 -10 -8 -6 -4 -2 0 2 4 6 8 10 12 14 16 18 20 time
24 (-5; +5) 3,88% 1,6384 (-10; +10) 6,29% 1,9220 * (-20; +20) 10,80% 2,3631 ** (-5; -1) -0,23% -0,1441 (-10; -1) 1,27% 0,5635 (-20; -1) 1,38% 0,4332 (+1; +5) -0,49% -0,3070 (+1; +10) 0,42% 0,1845 (+1; +20) 4,82% 1,5096
ii. Long-term performance:
To evaluate the long-term impact of Cevian’s entry in Munich Re capital, we use the buy-and-hold abnormal return (BHAR), expressed by equation X and shown below. This method resembles an investment made at the event date in the MUV2 stock subtracted by an investment in a matching benchmark (CDAX index), with the same duration.
𝐵𝐻𝐴𝑅𝑖(𝑡, 𝑇) = ∏𝑇𝑡=1(1 + 𝑅𝑖,𝑡) − ∏𝑇𝑡=1(1 + 𝑅𝐵,𝑡)
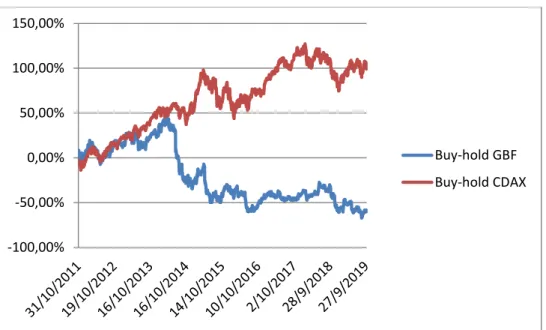
From the day Cevian announced its entry in Munich Re capital (7th Dec, 2007) until the day it announced its exit (21st May, 2010), Munich Re had a BHAR of 22.74%. This value is illustrated in figure 6 as the gap between the hold MUV2 line and the buy-hold CDAX line in the last day (21st May, 2010).
Figure 6: Buy-hold of MUV2 and CDAX, from announcement date until exit date
-60,00% -50,00% -40,00% -30,00% -20,00% -10,00% 0,00% 10,00% 20,00% 07/12/2007 07/12/2008 07/12/2009 Buy-hold MUV2 Buy-hold CDAX
25 d) Evolution of the key financial figures and ratios
The analysis of some of Munich Re's financial ratios and figures aims to understand on the one hand what changes there were in the company during the period the activist was there and on the other hand what were the sources of gains / losses for the activist. Table 3 provides the company's financial information for the period 2006 to 2010 and helps to understand its performance during that period. The following points highlight the main analyses made from this information:
The value of the total assets increased during the time the activist has been a shareholder (2007-2010). However, during the same period, the company’s equity decreased, meaning that the increase in assets’ value was funded by an increase in liabilities.
Despite the increase in the net earned premiums (which in an industrial company would be the equivalent to net sales), the operational result as well as the net income (or consolidated result) decreased. Therefore, not surprisingly, the profit margin has reduced to almost half of its 2007 value.
From the previous two points it also follows that, firstly, the asset turnover increased slightly, because sales growth was relatively higher than the assets growth. And secondly, both ROE and ROA have decreased. In the case of ROE, although equity and net income have both shortened in this period, the net income had a higher reduction.
The earnings-per-share and the share price dropped off, nonetheless, Munich Re had its dividends growing slightly. As a result, we have a stable P/E ratio, but an increase in the payout ratio and dividend yield.
The debt-to-equity, a leverage measure, had a significant jump between 2006 and 2007. However, given that the activist only came in in the last month of 2007, it is highly unlikely that this movement can be attributed to it. In the following years, this ratio had just a small increase.
The number of employees went up more than 20% since 2007.
The year 2008, was especially bad in term of results, which most likely was due to the financial crisis that burst in that same year.
26
Table 3: Main financial figures and ratios of Munich Re from 2006-2010
2010 2009 2008 2007 2006
Total Assets (€m) 236 358 223 412 215 417 214 253 215 874 Investments (€m) 188 151 178 149 172 103 173 976 175 052
Cash (€m) 2 900 3 082 2 354 2 505 2 172
Equity (less non-controlling
interests) (€m) 22 783 22 049 20 966 24 957 25 946 Total Liabilities (€m) 213 330 201 134 194 161 188 795 189 445
Debt (€m) 5 137 5 066 5 281 5 218 3 797
Net earned premiums (€m) 43 075 39 526 35 724 35 675 35 714 Operating result (€m) 3 978 4 721 3 262 5 078 5 494 Consolidated result
(attributable to Munich Re equity shareholders) (€m)
2 422 2 521 1 503 3 854 3 440
Number of staff (units) 46 915 47 249 44 209 38 634 37 210
EPS (€) 13,06 12,95 7,48 17,90 15,12
Dividend per share (€) 6,25 5,75 5,5 5,5 4,5
Share price (€) 113,45 108,67 111 132,94 130,42 Asset turnover 18,22% 17,69% 16,58% 16,65% 16,54% ROA 1,02% 1,13% 0,70% 1,80% 1,59% ROE 10,63% 11,43% 7,17% 15,44% 13,26% Profit margin 5,62% 6,38% 4,21% 10,80% 9,63% P/E 8,69 8,39 14,84 7,43 8,63 Payout ratio 47,86% 44,40% 73,53% 30,73% 29,76% Dividend yield 5,51% 5,29% 4,95% 4,14% 3,45% Debt to equity 22,55% 22,98% 25,19% 20,91% 14,63% Source: Based on Munich Re annual reports from 2006-2010
In sum, despite the short-term positive impact of when the activist became a shareholder of Munich Re, the company's financial framework showed no major improvements during the period Cevian was there. The fact that ratios such as ROA and profit margin have declined is even a sign of poorer financial and operating performance. But, in fact, it is hard to say that this Cevian investment can be seen as an activist campaign, given the following reasons: 1) During this time, there were no Cevian directors on the board, as usually happens with their campaigns; 2) there was no intention (at least publicly) to change any corporate governance practices that could suggest agency problems; 3) similarly, it did not seek any strategy change, such as the sale of a part of the company; and 4) Some of the changes that tend to happen in the target companies, have not occurred in this case. For example, the company did not become more leveraged or did not improve its operating performance. The only exception was the increase in
27 distributed funds to the shareholders, largely due to the share buy-back programme started in the spring of 2007, even before the activist came in. Nevertheless, in the 2.5 years that Cevian was a shareholder, Munich has outperformed the market. Therefore, if it is difficult to attribute any positive impact to Cevian, it is equally difficult to attribute any negative one.
4.2. Bilfinger
a) Portrait of the target company
Bilfinger SE was born in 1975 from the merger of three construction companies that had its roots still in the 19th century - Grün & Bilfinger AG, Julius Berger Tiefbau AG and Bauboag (formerly Berlinische Boden-Gesellschaft) -, thus forming Bilfinger + Berger Bauaktiengesellschaft.
At the beginning of the 21st century, the company changed its name to Bilfinger Berger AG, and at a time when construction started to have less activity, the company diversified its operations by acquiring many strong companies in the industrial, power plant and real-estate service sectors. The company moved from a construction company to an international engineering and service group. Finally, in 2012, after registering in accordance with European law (SE), the company is renamed to its present name Bilfinger SE.
At the end of 2011, when the Swedish activist became shareholder of the company, Bilfinger had Roland Kock as chairman of the executive board and Dr. h. c. Bernhard Walter as chairman of the supervisory board. The company was present in all continents except South America and was structured in five different business segments (Bilfinger annual report 2011):
Industrial services - provide services for the construction, maintenance, and modernization of industrial plants in industrial sectors including oil and gas, refineries, petrochemicals, chemicals and agrochemicals, pharmaceuticals, food and beverages, power generation and steel and aluminium;
Power services - focus on the maintenance, repair, efficiency enhancements and lifetime extensions, and the manufacture and assembly of components, especially boiler and high-pressure piping systems for power plants;
28 Building and facility services - provide technical, commercial and infrastructural
real-estate services;
Construction - design and execute demanding civil engineering services;
Concessions - delivers and operates transport and social infrastructure projects as a private partner to the public sector.
Table 4 below presents the key figures per segment:
Table 4: Key figure of the five business segments in the end of 2011
€million Industrial services
Power services
Building and
facility services Construction Concession
Output volume 3,294 1,157 2,256 1,751 - Orders received 3,224 1,221 2,363 971 - Order backlog 2,467 1,437 2,369 1,506 - Capital expenditure 69 14 16 26 - EBIT 150 92 83 35 23 Number of employees 29,427 7,588 15,711 5,849 141
Source: Bilfinger annual report 2011
b) Description of the activist campaign
Cevian Capital announced its activist campaign at Bilfinger on October 31st, 2011, with the purchase of about 12% of the German construction and industrial services group's capital, becoming the company's largest shareholder. Jens Tischendorf, Cevian's partner in charge of the German market, justified the purchase by saying that the share price was below its value given the company's strong fundamentals and that Cevian supported the company's repositioning to a leading engineering and services group (Bryant, 2011). The entry of the Swedish activist contributed positively to the company's performance until 2014, having Cevian even gained a seat on the supervisory board with Jens Tischendorf, in 2013. However, by mid-2014, the company went into a negative period where it had to repeatedly adjust the earnings expectations downward within a period of just a few weeks. This was caused by the falling investment from Europe's power generation sector (to whom Bilfinger provided many industrial and power services) due to the German economy's transition to a greener environmental policy. As a consequence of the consecutive adjustments, Bilfinger's share price, dropped significantly (from 83€ at the end of June to 54€ on the 5th of September), which led to
29 the resignation of the CEO, Roland Koch. Herbert Bodner, Bilfinger's former CEO was appointed by the supervisory board to fill in the empty seat on an interim basis (Vasagar, 2014). But the turmoil did not end there. In October 2014, the chairman of the supervisory board also decided to leave. Bernhard Walter was replaced by Eckhard Cordes, who was named by the Swedish activist, Cevian Capital, thus electing their second representative in this body (Prodhan, 2014).
In June 2015, Per H. Utnegaard succeeded to Herbert Bodner as CEO of the company that had taken over on an interim basis in the year before. In the same month, the company announced a plan to sell the power business (Prodhan & Wissenbach, 2015). But that never happened, leading the company to report losses of 489 million euros in 2015 and to suspend the distribution of dividends. Consequently, due to these results, Per H. Utnegaard was replaced too in April 2016, when not even a year had passed since his start (Thomas, 2016).
The next CEO was Tom Blades, who before was on Linde's executive board. Already under Tom Blades' control, Bilfinger finalized the sale of the Building, Facility Services, and Real Estate division, which accounted for about 40% of the company's sales, for 1.2 billion euros (Sommer, Tofern & Weishaupt, 2016). Thus, the company became exclusively an industrial services company. The company's strategy also took on a new configuration: two business segments, four core regions, and six industries (2-4-6). The two business segments were Engineering & Technologies (E&T) and Maintenance, Modifications and Operations (MMO). Together they combined all the services of the company. While the first concerned a more international solution, the second had a more regional focus by providing services at the costumer's site. The four regions were Continental Europe, Northwest Europe, North America, and the Middle East. And the six industries were Chemicals & Petrochemicals, Energy & Utilities, Oil & Gas, Pharma & Biopharma, Metallurgy, and Cement. The company's new repositioning aimed to make it less complex and more efficient, thus giving conditions for profitability growth (Bilfinger annual report, 2016).
In an interview with the Financial Times (Milne, 2017a), Christer Gardell admitted that Cevian “underestimated the problems of the deals that had built Bilfinger.” But despite the difficulties that Bilfinger went through, Cevian has been increasing its position in
30 the company's capital, holding today 29.5% of the capital, which reinforces its confidence in the value of the company.
c) Event study
Similar to what was done in the study of the first campaign (Munich Re), we will separate between short-term and long-term analysis here. Similarly, we will also use the CDAX index as representative of the market portfolio and against which we compare the performance of Bilfinger (GBF) share price. And the methodology followed is the one presented in the methodology part related to event studies.
i. Short-term performance:
Using an estimation window of 250-days (-270; -21) before the event window, we estimate the values of α and β, presented in figure 7, which we use as the coefficients of the market model. Likewise, figure 7 also shows the values of variance and standard deviation that we use in the significance test of the abnormal return (AR) and the cumulative abnormal return (CAR).
Figure 7: Market model coefficients
The normal return (𝑅̂𝑖𝑡) for each day of the event window (-20; +20) is thus given by the market model (equation I):
𝑅̂𝑖𝑡 = 𝛼̂𝑖 + 𝛽̂𝑖𝑅𝑚𝑡+ 𝜀𝑖𝑡 = 0.00081 + 0.97706 ∗ 𝑅𝑚𝑡
After we calculate the normal return, we can then proceed with the calculation of the abnormal return (𝐴𝑅𝑖𝑡 = 𝑅𝑖𝑡− 𝑅̂𝑖𝑡) as well as the cumulative abnormal return (𝐶𝐴𝑅𝑖 =
∑ 𝐴𝑅𝑖𝑡). Table 5 shows the results of these calculations for the event window interval.
Alpha 0,00081
Beta 0,97706
Sample var 0,00012
31 In addition, the last column of the table gives the significance test of each abnormal return result.8
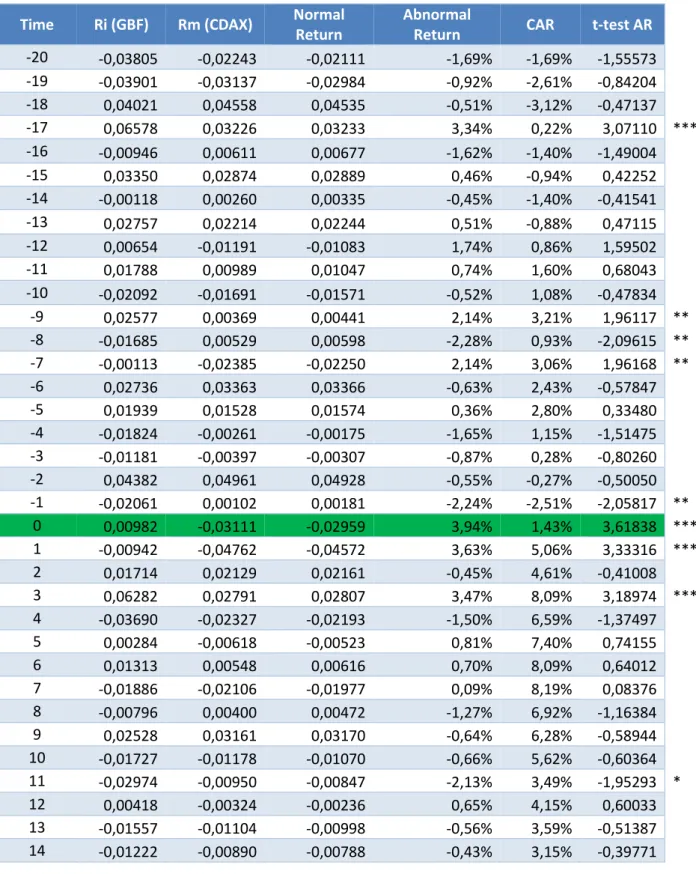
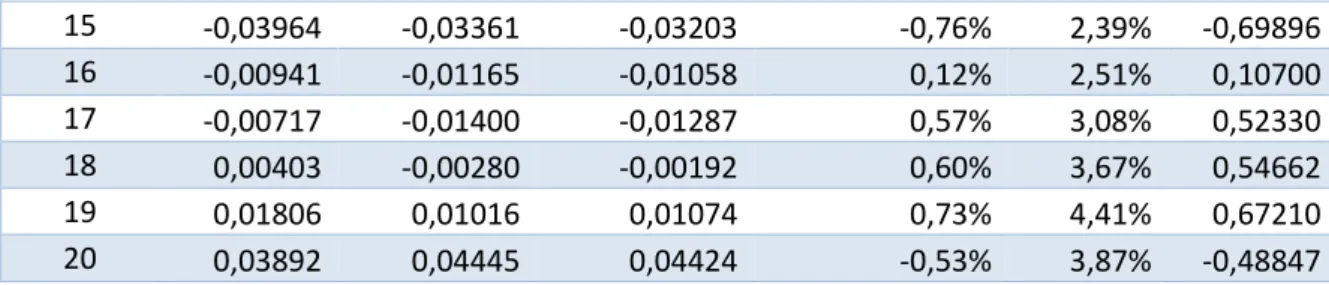
Table 5: Abnormal return and significance test of GBF
Time Ri (GBF) Rm (CDAX) Normal
Return
Abnormal
Return CAR t-test AR
-20 -0,03805 -0,02243 -0,02111 -1,69% -1,69% -1,55573 -19 -0,03901 -0,03137 -0,02984 -0,92% -2,61% -0,84204 -18 0,04021 0,04558 0,04535 -0,51% -3,12% -0,47137 -17 0,06578 0,03226 0,03233 3,34% 0,22% 3,07110 *** -16 -0,00946 0,00611 0,00677 -1,62% -1,40% -1,49004 -15 0,03350 0,02874 0,02889 0,46% -0,94% 0,42252 -14 -0,00118 0,00260 0,00335 -0,45% -1,40% -0,41541 -13 0,02757 0,02214 0,02244 0,51% -0,88% 0,47115 -12 0,00654 -0,01191 -0,01083 1,74% 0,86% 1,59502 -11 0,01788 0,00989 0,01047 0,74% 1,60% 0,68043 -10 -0,02092 -0,01691 -0,01571 -0,52% 1,08% -0,47834 -9 0,02577 0,00369 0,00441 2,14% 3,21% 1,96117 ** -8 -0,01685 0,00529 0,00598 -2,28% 0,93% -2,09615 ** -7 -0,00113 -0,02385 -0,02250 2,14% 3,06% 1,96168 ** -6 0,02736 0,03363 0,03366 -0,63% 2,43% -0,57847 -5 0,01939 0,01528 0,01574 0,36% 2,80% 0,33480 -4 -0,01824 -0,00261 -0,00175 -1,65% 1,15% -1,51475 -3 -0,01181 -0,00397 -0,00307 -0,87% 0,28% -0,80260 -2 0,04382 0,04961 0,04928 -0,55% -0,27% -0,50050 -1 -0,02061 0,00102 0,00181 -2,24% -2,51% -2,05817 ** 0 0,00982 -0,03111 -0,02959 3,94% 1,43% 3,61838 *** 1 -0,00942 -0,04762 -0,04572 3,63% 5,06% 3,33316 *** 2 0,01714 0,02129 0,02161 -0,45% 4,61% -0,41008 3 0,06282 0,02791 0,02807 3,47% 8,09% 3,18974 *** 4 -0,03690 -0,02327 -0,02193 -1,50% 6,59% -1,37497 5 0,00284 -0,00618 -0,00523 0,81% 7,40% 0,74155 6 0,01313 0,00548 0,00616 0,70% 8,09% 0,64012 7 -0,01886 -0,02106 -0,01977 0,09% 8,19% 0,08376 8 -0,00796 0,00400 0,00472 -1,27% 6,92% -1,16384 9 0,02528 0,03161 0,03170 -0,64% 6,28% -0,58944 10 -0,01727 -0,01178 -0,01070 -0,66% 5,62% -0,60364 11 -0,02974 -0,00950 -0,00847 -2,13% 3,49% -1,95293 * 12 0,00418 -0,00324 -0,00236 0,65% 4,15% 0,60033 13 -0,01557 -0,01104 -0,00998 -0,56% 3,59% -0,51387 14 -0,01222 -0,00890 -0,00788 -0,43% 3,15% -0,39771 8
*, ** and *** represent the test results respectively at 10%, 5% and 1% significance level; 0 represents the announcement day, -1 represents one day before the announcement, 1 represents one day after the announcement, and so one.
32 15 -0,03964 -0,03361 -0,03203 -0,76% 2,39% -0,69896 16 -0,00941 -0,01165 -0,01058 0,12% 2,51% 0,10700 17 -0,00717 -0,01400 -0,01287 0,57% 3,08% 0,52330 18 0,00403 -0,00280 -0,00192 0,60% 3,67% 0,54662 19 0,01806 0,01016 0,01074 0,73% 4,41% 0,67210 20 0,03892 0,04445 0,04424 -0,53% 3,87% -0,48847
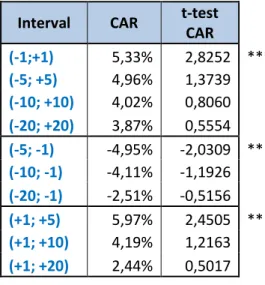
Once again the day of the announcement caused a significantly positive reaction, as evidenced by the t-test result (𝜃1 = 3.62) of the abnormal return. In contrast to the Munich Re campaign, however, Bilfinger's abnormal return was not limited to the day of the announcement only, but also to the days after (days 1 and 3). Each of these days reported abnormal returns of over 3%, which according to their t-test values, are significant at a 1% significance level. Looking at Figure 8, which shows graphically the information contained in table 5, one can better understand the evolution of both abnormal returns and cumulative abnormal returns. The positive reaction of the announcement is well expressed by the hike in the CAR line. One aspect that the chart highlights more is the higher volatility of the Bilfinger's returns when compared to the Munich Re ones. The fact that Bilfinger is a German mid-cap and therefore smaller company than Munich Re is possibly the most reasonable explanation.
The table also shows other days with statistically significant abnormal returns, especially before the announcement day, but they do not invalidate the above conclusions.
Figure 8: Abnormal return and cumulative abnormal return of Bilfinger over the (-20; +20) event window
-4,00% -2,00% 0,00% 2,00% 4,00% 6,00% 8,00% 10,00% -20 -18 -16 -14 -12 -10 -8 -6 -4 -2 0 2 4 6 8 10 12 14 16 18 20 Time