Vol. 119: 253-263,1995 MARINE ECOLOGY PROGRESS SERIES
Mar. Ecol. Prog. Ser. l Published March 23
Size structure and inequality in a commercial
stand of the seaweed Gelidium sesquipedale
Rui Santos
Universidade do Algarve. U.C.T.R.A., Gambelas. P-8000 Faro, Portugal
ABSTRACT: The temporal dynamics of the frequency distributions of 2 measures of Gelidium sesqulpedale frond size, length and welght, was investigated in a subtidal stand under commercial exploitation. Frond weight/length allometry was highly vanable, both seasonally and between years, showing that In this species weight and length cannot be used interchangeably as a measure of frond size. Physical disturbances played a fundamental role in allometric variability. The loss of branches due to commercial harvest and storms reduced the slope of the log weight/log length relationship. During spring the slope increased, indicating the production and growth of lateral branches. Size differences among individuals in the population (inequality) were quantified by 3 statistics: the skewness coeffi- cient (g,), the coefficient of variation (CV), and the Gini coefficient (G). Highly significant changes in frond length inequality, but not weight, were shown. These correspond to periods when G. sesqui- pedale length structure varied due to the combined effects of the demographic parameters that regu- late the population (frond recruitment, survival, breakage and growth). Graphical analysis of signifi- cantly Mferent length structures revealed that a recruitment peak of vegetatively developed fronds occurred dunng winter, following periods of high frond mortality and breakage caused by both human (summer harvesting) and natural (late fall storms) disturbances. During late spring and summer, the density of smaller fronds decreased due to mortality and growth into higher size classes. To assess density-dependent regulation processes, such as suppressed growth of smaller fronds and self- thinning, the time variation of both relationships, inequality/mean frond weight and biomass/density, was analysed. Inequality/mean frond weight and biomass/density values decreased from summer to winter and Increased to the following summer. The increase of inequality while mean frond weight is increasing is consistent with the asymmetric competition theory on the development of crowded plant stands, and supports the hypothesis that the slower growth of smaller fronds during this period (Santos 1994; Mar. Ecol. Prog. Ser. 107: 295-305) IS due to intraspecific competition. The time trajectory of the biomass/density relationship is perpendicular to and lies above the theoretical self-thinning line. Evi- dence for self-thinning was thus not detected. A conceptual model for the functioning of this population is proposed. Thinning and frond breakage caused by disturbances might be keeping intraspecific com- petition in these G. sesquipedale crowded stands (up to 18 000 fronds m-') at low levels.
KEY WORDS: Size structure
.
Size hierarchy.
Inequality - Gini coefficient.
Skewness . Gelidium sesquipedale . Population dynamics.
Self-thinningINTRODUCTION
To assess the structure and functioning of popula-
t i o n ~ , plant ecologists have studied the temporal
dynamics of frequency distributions of some measure
of an individual's size such as plant length, plant
mass, stem diameter or leaf area. Changes of these
size structures through time reflect the combined
effect of the demographic parameters growth, survival
and recruitment.
Variation in size structure within and among popula-
tions has been studied graphically (Mack &
Harper
1977) or mathematically by considering some statis-
tical measure of distributions such as mean, variance,
skewness and kurtosis (Hara 1988). Research has
focused on the skewness of size structures because
most plant populations consist
ofmany small indi-
viduals and relatively few large ones (Koyama &
k r a
1956, Rabinowitz 1979, Higgins et al. 1984, Schiel
1985, Higgins
&Mack 1987). The coefficient of varia-
O Inter-Research 1995254 Mar. Ecol. Prog. Ser. 119. 253-263, 1995
tion (CV
= standard deviatiodmean) has been used asa statistical measure of the variability among members
in a population (Kira et al. 1953, Edmeades & Daynard
1979, Mack & Pyke 1983).
Weiner & Solbrig (1984) recently proposed the use of
the Gini coefficient to define how individuals of a plant
population are ranked in size classes. The Gini coeffi-
cient measures the mean size differences among indi-
viduals in a population (inequality). There have been
several applications of the Gini coefficient to study size
variability in higher plant populations (Weiner 1985,
Schmitt e t al. 1986, 1987, Weiner
&Thomas 1986,
Bonan 1988, Geber 1989, Thomas
&Weiner 1989).
Populations of seaweeds have seldom been described
in such a way (Martinez
& Santelices 1992).During the development of crowded monospecific
stands, weight inequality generally increases over time
until the onset of self-thinning due to differential
growth rates between larger and smaller 'suppressed'
plants. Then, inequality decreases as self-thinning pro-
gresses d u e to higher mortality rates of smaller plants
(Weiner & Thomas 1986, Bonan 1988, Weiner & Whig-
ham 1988, Geber 1989). This trend is interpreted as
being consistent with the asymmetric competition
hypothesis of dominance and suppression of smaller
individuals by larger ones (Begon 1984, Hara 1988).
Self-thinning has also been studied in terms of con-
current changes in mean plant mass (or total biomass)
and density. In crowded plant stands under self-
thinning, the relationship between biomass and den-
sity forms a thinning line of slope -3/2 with an inter-
cept of 4.3, when mea.n plant weight and density are
plotted on a log scale; a n equivalent line of slope -1/2
a n d with the same intercept is defined when the loga-
rithm of stand biomass is plotted in place of average
plant weight (see review in Westoby 1984). This rela-
tionship was defined as a general 'law' governing any
even-aged plant population, the self-thinning rule, or
the -3/2 power law (Yoda et al. 1963), and is supported
by a wide variety of data from both artificial a n d
natural stands of land plants (White
&Harper 1970,
White 1980, Westoby 1984), and seaweeds (Cousens
&Hutchings 1983). Weller (1987) has since shown that
the slopes and intercepts of thinning lines are more
variable than previously thought. Even within the
same species, different stands might have different
'dynamic self-thinning lines' (Weller 1990).
Gelidium sesquipedale (Clem.) Bornet et Thuret
(Rhodophyta, Gelidiales) is a clonal alga that grows in
the subtidal zone off the northeast Atlantic coast.
Upri9h.t fronds are produced from a small, prostrate
system of axes (Dixon 1958, Fan 1961). Dense mono-
specific stands of clumped fronds develop on exposed
shores along the Portuguese coast, covering wide
areas of the bottom. The populations are subjected
every summer and fall to commercial harvesting by
divers, who hand-pluck the seaweed for its agar
(Santos
& Duarte 1991).In a previous tagging study of the dynamics of frond
number in Gelidium sesquipedale (Santos 1994), it was
found that during the favourable growth season (spring/
early summer), growth and survival of smaller fronds
were lower than those of longer fronds. Intraspecific
competition may be determining the survival and
growth of small fronds within G. sesquipedale's dense
stands. Natural wave-induced physical stresses also
play an important role in G. sesquipedale demo-
graphics (Santos 1994).
This study assesses Gelidium sesquipedale popula-
tion dynamics through a n analysis of its size distribu-
tion variability. As size is not a unified concept in plant
species showing plasticity in growth form (Weiner
&Thomas 19921, 2 size measures, frond weight and
frond length, are used, and their allometric variabll~ty
through time is followed. Three statistics are used to
quantify size variability, and to detect significant
changes of size structures through time: the skewness
coefficient
(g,),
the coefficient of variation
(CV),and
the Gini coefficient ( G ) . Graphical analysis of the
significantly different size structures reveals the
underlying demographic events (recruitment, sur-
vivorship and growth) that regulate those changes.
Seasonal changes of population level parameters
such as total biomass a n d density per unit area, and
mean frond weight and length, are also investigated.
The temporal variation of the empirical relationships
biomass/density and inequality/mean frond weight
is followed to assess density-dependent processes of
growth suppression and self-thinning. Based on the
information gathered, a conceptual model for the func-
tioning of the population is proposed.
METHODS
The field study was conducted in one of the most
important GeLidium sesquipedale commercial beds,
off Cape Espichel, Portugal (Santos
&Duarte 1991).
Santos (1993a) described the main abiotic and biotic
interactions in the bed. Additional information on the
species size-dependent demographic rates in a dense
stand of this bed is available in Santos (1994). In this
study, the same stand was sampled monthly from July
1989 to September 1990, except for November and
December 1989 and February 1990, wh.en sea storms
prevented diving Both frond morphology and size
structure appeared to be d~fferent
in the upper and
lower portlons of the incllned strata upon which the
population develops (Santos pers. obs.). Sampling was
thus restricted to the middle zone of the strata, at a
Santos: Size structure and inequality in Gelidium sesquipedale 255
constant depth of 9 m. Quadrat samples were spread
through an area where G, sesquipedale is most abun-
dant (transect 2; see Santos 1993a), and thus most
likely to be harvested. Samples represent a mixture
of harvested and nonharvested plants, reflecting the
harvest efficiency of commercial divers. Sam.pling in
July was just prior to the harvest season, which starts
mid-July and extends through the summer and fall
(Santos & Duarte 1991).
It is difficult to match upright fronds with their pros-
trate system of axes within Gelidium sesquipedale's
dense stands, and thus to distinguish fronds that origi-
nated from different spores (different genets sensu
Harper 1977). Therefore, G. sesquipedale population
dynamics was studied a t the frond level. A sample size
of five 40 X
40 cm quadrats was selected, following a
study of the variation of biomass sample precision
(Riddle 1989) for different quadrat sizes (15, 25, 40 and
50 cm) and a fixed diving time (Santos unpubl. data).
All fronds inside the quadrats were removed by care-
fully scraping the substrate; the fronds were placed in
a mesh bag. The resultant frond-length frequency dis-
tribution was similar to that obtained when fronds
were scraped and collected with a compressed-air
device (Santos unpubl. data).
All plant material was preserved by freezing Geli-
dium sesquipedale mean frond weight and length were
estimated for each monthly quadrat sample by meas-
uring all fronds to the nearest mg and mm, respectively,
in 3 randomly selected subsamples. Prior to measuring,
the frozen fronds were thawed and surplus water was
removed by blotting with paper towels. Allometric
relationships between log weight and log length were
analyzed by regression for all monthly samples.
Quantifying size structure variability. All data analy-
ses were computed using Systat 5.1 for Macintosh
(Wilkinson 1989), except the Gini coefficient calcula-
tions, which were done using a BASIC program. The
skewness coefficient
( g , ) ,the coefficient of variation
(CV) and the Gini coefficient ( G ) , (Kendall &
Stuart
1969, Sokal
&Rohlf 1969), were computed for all
quadrats, to assess the shape and inequality levels of
both frond length a n d weight distributions. Skewness
is a shape parameter quantifying deviations from a
normal distribution; positive values indicate a long
right tail (more small fronds and fewer large fronds)
and vice versa for negative values. In contrast, CV and
G are measures of relative precision that reflect the
ratio of a measure of dispersion (respectively the stan-
dard deviation and the coefficient of mean difference,
n n
x x l x ,
-x , l l n ; from Gini 1912 in Weiner
& Solbrig i j1984) to the mean. Unbiased Gini coefficients, G '
(Weiner
& Solbrig 1984), were calculated as:where X,
and X,
are the measures of all possible pairs of
individuals. If all observations are the same, represent-
ing a minimum inequality, then G =
0. In an infinitepopulation where all observations are zero except one,
then G is maximum and has a value of 1.
Variability of size-structure coefficients through time
was analyzed using a l-way ANOVA. May 1990 values
were not included in the statistical analysis, because
only
2quadrats were sampled. Data were log trans-
formed, when necessary, to fulfil the condition of
heteroscedasticity (Sokal
&Rohlf 1969). Post hoc
multiple contrasts analysis was done following Rodger
(1974, 1975), to detect significant transitions between
contiguous time periods. The critical values for reject-
ing null contrasts were taken from the F-value tables
provided in Rodger (1975).
Density-dependent empirical relationships. To assess
density-dependent processes, the temporal variation of
the relationship between the logs of stand biomass a n d
density were analyzed, rather than the more common
approach of plotting log mean frond weight a n d
log density (Yoda et al. 1963, White
&Harper 1970,
Westoby 1981, 1984, White 1981). Weller (1987) showed
that use of average plant weight is statistically incor-
rect. The time trajectory of the relationship between
weight inequality, given by the Gini coefficient, and
mean frond weight were also analyzed (Weiner
&Thomas 1986,
Bonan 1988, Geber 1989).
RESULTS
Temporal variation of population parameters
There were significant differences among sampling
dates ( l - w a y ANOVA,
p
I0.001) for mean frond
weight, mean frond length, biomass and density in
Gelidium sesquipedale. Post hoc multiple contrast
analyses revealed
3significant (p
<
0.05) seasonal
transitions of mean frond weight (Fig. 1A) and total
biomass m-2 (Fig. 1C). High summer preharvest condi-
tions in July 1989 were followed by lower levels, coin-
cident with the start of harvesting. Unlike biomass,
July 1989 mean frond weight was not significantly dif-
ferent (p < 0.01) from summer/early fall. Both para-
meters troughed in winter, after a period of severe sea
conditions (November/December 1989), when waves
u p to 7 m high hit the coast of Cape Espichel (Santos
1994). In the seasonal transition from winter to
spnng/summer, mean frond weight a n d biomass
increased, but never recovered to the levels of July
256 Mar. Ecol. Prog. Ser 119: 253-263, 1995
4 , m , , , , , , , , , , , , m
J A S O N D J F M A M J J A S
Fig. 1. Gelidium sesquipedale. Temporal variation in (A) mean frond weight, (B) mean frond length. (C) biomass m-' and (D) den- sity m-2 Error bars indicate 1 SD from the mean (n = 5). Sample means under honzontal bars are not significantly different (p < 0.05). Horizontal bars at the same level are not sign~iicantly different The May sample (n = 2) was not included in statistical
analysis
Gelidium sesquipedale mean frond length showed a
similar
seasonal pattern to mean frond weight and total
biomass: a
low
in winter
and
incomplete
recovery
to
postharvest levels
of
1989.
However,
mean
frond
length
did
not
decrease
during
harvest
seasons
(Fig. 1B).
Frond
length
increase, observed after the lowest level
(January 1990),
was faster than
frond
weight (Fig. lB),
indicating
that
during
this
period
fronds
elongate
rather than
branch.
Branching
was
more intense
after
April
1990, based
on the rapid
increase
in mean frond
weight (Fig. 1A).
Seasonal
variation
of
Gelidium
sesquipedale
frond
density was
not
as great as the other variables,
and
in
fact
seasonal
periods
could
not
be
detected
at
a
sig-
nificance
level
of
p
=0.01. Four seasonal
periods
are
separated
at
p
<0.05
(Fig.
ID).Density
decreased from
July
1989
to August
1989,
and troughed during fall and
early
winter.
In
spring/early summer,
frond
density
recovered
to
July
1989
levels,
decreasing
again
in
August
1990.
This
was
the
only
significant
drop
in
population
parameters
during the
1990
harvest season
(Fig.
ID),
but
it is
likely
not
related to
harvest since the
rest
of the
population
parameters
did
not
decrease
during this period
(Fig.
1A to C).
September
1990
den-
sity
was not
significantly
different
from August
1990,
but
when the
2months were lumped, density
was
not
significantly different
( p
> 0.05)from
July.
Frond weight1 length allometry
Linear and second-order regressions between log
frond weight and log frond length are highly signifi-
cant for all months ( p
< 0.001), and varied significantly
through time (Slope
+
SE; Table 1).
The coefficients of
determination of linear regressions, r2, are generally
Table l. Gelidium sesqulpedale. Allometric relationships be- tween log frond weight and log frond length. n: no. of observa- tions; r2. coefficient of determination of linear model; SE: slope standard error; Increase in r2: fraction of sample variation that is explained by second-order term, i.e. r 2 2nd-order - r 2 linear Date n r Z Slope
*
SE Increase in r2 4 Jul 1989 2 Aug 1989 6 Sep 1989 4 Oct 1989 8 Jan 1990 9 Mar 1990 24 Apr 1990 18 May 1990 16 Jun 1990 10 Jul 1990 29 Aug 1990 25 Sep 1990Santos: Size structure and inequality in Gehdium sesquipedale 257
high, particularly from April 1990 to September 1990
when allometric relationships were almost linear
(Increase in r2; Table 1). Although the second-order
terms were significant for all months (p
< 0.001), they
only slightly improved the models' performances.
Ex-
ceptions are September 1989 and March 1990, when the
increase in r 2 was
11and 14%, respectively (Table 1).
The slope of
Gelidium sesquipedale
log weight
/log
length relationship decreased from a maximum in July
1989 to a minimum in March 1990, suggesting the loss
of branches due to harvest and storms. It increased
during spring 1990, indicating the production and
growth of lateral branches, and stabilized during
summer 1990.
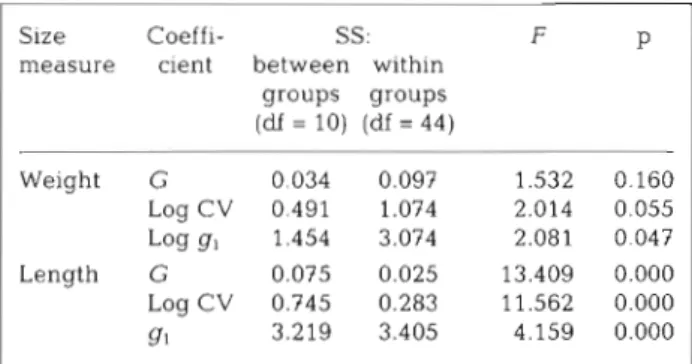
Table 2. Gelidium sesquipedale. ANOVA summary statistics for time variance of weight and length distribution inequality. G: Gini coefficient; CV: coefficient of variation; g,: skewness
coefficient
Size Coeffi- SS: F P
measure cient between within groups groups (df = 10) (df = 44) Weight G 0.034 0.097 1.532 0.160 Log CV 0.491 1.074 2.014 0.055 Log g, 1.454 3.074 2.081 0 047 Length G 0.075 0.025 13.409 0.000 Log CV 0.745 0.283 11.562 0.000 91 3.219 3.405 4.159 0.000
Temporal variation of population structure
Gelidium sesquipedale
weight distributions had high
inequality values (Fig. 2), and were highly skewed.
All coefficients showed a general decreasing trend
through time, but the statistical significance was low
(p-values; Table 2). Seasonal patterns were not de-
tected. Temporal variation of
C Vand g, (Fig. 2B
&C),
at significance levels of
p
= 0.06 and p =0.05, were due
to the reduction of
C.
sesquipedale
fronds in the small
a n d large weight classes (Fig.
3) between August 1989
a n d August 1990. This caused both a decrease in the
variation of frond weights in relation to the mean
(CV)and a flattening of the shape of the distribution, reduc-
ing the skewness coefficient value
(gl).
In contrast, length inequality and skewness have
lower values and their time variation is highly signifi-
cant ( p
i0.001; Table 2). Length inequality and skew-
ness increase to winter and decrease to summer. Three
significant seasonal transitions were detected by post
hoc multiple contrast analysis (p
< 0.05), when using G
and
C Vstatistics (horizontal lines in Fig. 4A, B). The
2 periods, August-October 1989 a n d June-September
1990, are not significantly different from each other.
When analyzing the length distributions with the
skewness coefficient
( g , ) ,
only
2significant transitions
are revealed (Fig. 4C). Length distribution skewness in
July 1989 was not significantly different from that of
August/September 1990.
Significant transitions in size distribution inequali-
ties represent periods when the combined effect of
frond growth, breakage and mortality, and recruitment
of new fronds was significant. To investigate these, all
1
-J
S N J M M J S
1989 1990
Fig. 2. Gelidium sesquipedale. Annual variabon of weight dis- tribution inequalities, measured by (A) the Gini coefficient (G). (B) the coefficient of variation (CV) and (C) the skew- ness coefficient
(gl).
Error bars indicate 1 SD from the mean (n = 5). The May sample (n = 2) was not included in statisticalanalysis
0.01 0.05 0. I 0.15 >0.2
Frond
weight (g)
Fig. 3. Gelidium sesquipedale. Changes in weight distribu- tions from August 1989 to August 1990
258 Mar. Ecol. Prog. Ser. 119: 253-263, 1995 I
.o
C0.8
6
0.6 0.4 0.2 0.0J
S N J M M J
S
Fig. 4. GeLidium sesquipedale. Annual variation of length dis- tribution inequalities, measured by (A) the Gini coefficient (G), (B) the coefficient of variation (CV) and (C) the skewness coefficient ( g , ) . Error bars indicate 1 SD from the mean (n = 5). Horizontal lines show significant p < 0.05) seasonal transi- tions. The May sample (n = 2) was not Included in stat~stlcal
analysls
length data in each time
period
were pooled
and fre-
quency
distributions
plotted
(1 cmsize
class
density
m-2; Fig.
5).There
was
a
general
reduction
in
frond
density
between
July
1989
and
the
period
August-
October
1989
(Fig.
5A),
due
to
harvesting.
Also,
the
right tail
of
the distribution increased, reflecting
elon-
gation
of
shorter fronds and determining
the increase
of
length inequality and skewness
(Fig.
4).The next
significant
inequality
increase was between
August-October
1989
and
January-April
1990, char-
acterized by
a
pulse
of
fronds
< 4 cm, and a
decrease
in
density
of
fronds
> 6
cm
(Fig.
5 B ) .
During
the
last
seasonal transition, to the period June-September
1990,
a
reverse
pattern
was
observed
(Fig. 5C).
Length
in-
equality
decreased
d u e
to
the
decrease
in
density
of
smaller fronds,
a n d
growth into higher size classes.
Density-dependent empirical relationships
Additional data from
7quadrat samples obtained at
the same site in July 1988 were included in the analy-
sis of both relationships, inequality-mean frond weight
(Fig. 6A) and biomass-density (Fig. 6B). GeLidium ses-
quipedale weight inequality was positively correlated
Frond height (cm)
Fig. 5. Gelidium sesquipedale. Comparison of the 3 signifi- cant changes on the inequality of length distributions; from (A) July 1989 to August-October 1989, (B) August-October 1989 to January-Apnl 1990 and from (C) January-April 1990
to June-September 1990
with
mean frond
weight
(r2 =
0.45,
p
<
0.001).
The
highest
values were
in
July 1988 and July
1989,
while
the lowest values occurred the
following
winter (Janu-
ary
1990-March
1990;
Fig. 6A).
The temporal variation
of
the
relationship
swings
between
summer
high
values and winter low
values,
along
the
line
y =
0.88
+
0.23
X(Fig.
6A).
Data
points
of
the
biomass/density
relationship
(Fig.
6B)
lie
mostly
above
the
theoretical
boundary
line for
self-thinning
populations
shown in
the
graph,
logloB
= 4.3 -1/2
logloN,
where
B is
stand
biomass
(m-')
and
N
is
frond
density
(m-2)(Fig. 6B).
The
time
trajectory
of
this relationship
shows
a similar pattern to
the
inequality/mean
weight
relationship
(Fig.
6A); it
increased
from
winter
to
summer,
decreasing
after-
Santos Size structure and inequality in
Gelidium sesquipedale
259
log mean weight (g)
Jul89
Jul90
Jan 90 Mar 90 Allvalues
with
the
1989
harvest
suggests
that some
fronds may
have lost
their
branches
while
their
main
axis
re-
mained
intact,
or
that
heavier fronds
(more branched
with
more
surface)
are more likely to be detached
than
longer,
less-branched
fronds.
Asimilar
situation
was
observed
in
Chondrus
crispus
commercial
beds
off
Prince
Edward
Island,
Canada,
where
the
drag-rake
method
of
harvesting
appears
to
select
for
the
branched
fronds
(Pringle
&Semple
1988).
Winter low values
for
the measured population para-
meters
followed
a
period
of
unusually
strong storms.
The dynamics of
frond
survival and growth during this
period, derived from the analysis of
the
seasonal
tran-
sitions
of
length structures
(Fig. 5),
are
supported
by
Santos'
(1994)
tagging study
of
Gelidium
sesquipedale
4.0 -
frond
dynamics.
Summer
to
winter
transitions
are
h B 0
Jul88
caused
by
the
longer
fronds'
higher
mortality
during
(Y3.5 - a
harvest and
higher
frond
breakage
during
storms.
bb o o
Ju189
m
The pulse
of
short
fronds
(54
cm)
observed
in
3.0- A
Jul90
V)
,.I
wintedearly
spring
(Fig.
5B)
reflects
recruitment
of
V) -... 4.
;!
Jan 90new
fronds
rather
than breakage
of
longer fronds, be-
;
2.5 - ‘.-...
-._.Mar
90
.L.-..
cause density
increased
during
this
period
(Fig.
ID).
0.
-
-...-... All
values
Santos
(1993b)
showed
that
the
number
of
size
class
a
2.0 -U) TIICO~CI~CJ~'-'.--.
1 fronds
(4 to
10 cm)
is
high
even
after
discounting
0 SCII'.III~IIII~II~ IIIIC
both
frond
breakage
and
growth,
respectively,
into
1.5 I I
3.0 3.5 4.0 4.5 5 0
and
out
of
the
class. The
pulse
of size
class
1
fronds
was
detected
in
March/April,
indicating
that
new
log
density
(m-2)
fronds
developed
some
months
earlier,
probably
in
reaction
to
the
reduction
of
the
canopy
due to
late
fall
Fig. 6 . Gelidiumsesquipedale.
Time trajectory of the relation-storms.
ships between (A) frond weight inequality (Gini coefficient)
F~~~~
recruitment
appears to
by
vegetative
and log mean frond weight and (B) log biomass (m-2) and logdensity (m-2). Line in (B) is the theoretical self-thinning line,
growth
ofthe prostrate
'ystem
(Dixon
Fan
1961)1 log biomass = 4 . 3 - 1/2 log density (see text). Regressionrather
than
through
the
development
of
new
fronds
between the Gini coefficient and log mean weight includes
from
spores.
Vegetative
growth is the most
important
July
1988
valuesprocess
for
the
recovery
of
populations
of
Gelidium
species
(Santelices
1988).
This
was
supported
by
the
wards. Biomass/density
values
dunng
1990
peaked
in
low
frond
recruitment
of
G.
sesquipedale
on
ceramic
July,
but
did
not
reach
the
values
of
July
1988
and
tiles
placed
in
the
study
site (Santos
unpubl,
data).
A
1989.
similar
dynamic
has
been
suggested
for
the
highly
disturbed
commercial stands
of
Chondrus
crispus
off
Prince
Edward
Island,
which
have
higher
densities of
DISCUSSION
small fronds
than
do
nonharvested
beds
(Chopin
et
al.
1992).
Population
dynamics
Gelidium
sesquipedale
fronds recruited
in
winter
grew
to
longer
size classes
during
spring/summer
GeLidium
sesquipedale
population
parameter
van-
1990
(Fig.
5C). Yet, the
stand
did
not
recover
to
the
ability
(Fig.
1)was
related
to
both
environmental
and
maximum
values
of
July
1989. Frond
length distribu-
human-induced
disturbances
(storms
and
harvest).
The
tion
changes
from
summer
1989
(Fig.
5A)
to
1990
sharp
drop
in all population parameters
(except
mean
(Fig.
5C)
reflect
this.
The
same
trend
is
shown
in
frond
length
after
July 1989) reflected
in the first sig-
demographic
simulations
of
the
population and was
nificant transition
of
frond
length
distribution
(Fig.
5A)supported
by
the
large
decrease in
harvest
landings
is
coincident
with
the
start
of
the
harvest
season.
between
1989 and
1990
(Santos
199313).
The
effects
During
this season,
12
boats
carrying
an average
of
4of
harvesting
on
the
G.
sesquipedale
population
divers
collected
about
1700
t of
wet
seaweed
(J.
Oliveira
parameters
were
not
detected in
1990, likely
due to
pers.
comm.).
That
mean
frond
length
did
not decrease
reduced
effort.
260 Mar.
Ecol. Prog.
Ser. 119: 253-263, 1995Size distribution coefficients
branches
and branch initials increased markedly
with
irradiance,
rather
than
temperature
(Fredriksen
&The
behaviour
of
the 3 statistics used
to
quantify the
Rueness
1989).
temporal
variability
of
the
size
distributions
of
Geli-
d i m
sesquipedale
generally agrees with those reported
in
the
literature
(Weiner
&Thomas
1986,
Bendel
et
Density-dependent empirical relationships
al.
1989).
The
Gini
coefficient
and
the
coefficient
of
variation had
similar
performances, whereas skewness
The
time
trajectory
of
the
Gelidium sesquipedale
was more related to the latter. G and
CV
were highly
inequality/mean
frond weight
relationship
(Fig.
6A)
is
correlated
to
one
another
for both
weight
and length
consistent
with
the
asymmetric
competition theory
(r = 0.84
and
r
=0.98, respectively), while
g,was,
in
(Begon 1984, Hara
1988),
where, in
crowded stands,
both cases,
more correlated
to CV
(r
=0.78
and r
=0.68,
weight
inequality
is
predicted
to
increase
with
in-
respectively)
than to
G (r
=0.36 and r
=0.57, respec-
creased
mean
plant
weight
until
the
onset
of
self-
tively).
G
is
a more robust inequality measure than CV
thinning.
At
this point,
inequality
decreases
as
mor-
and gl;
it
has
lower
values
of
sum of
squares within
tality
of
smaller
plants
progresses
(Weiner
&Thomas
groups (Table
2),
because
it is less sensitive to variation
1986).
The
G.
sesquipedale
population
studied
here
in
the distribution
tails
(Bendel
et al.
1989).
never
reached
a
self-thinning situation.
Contrary
to
length,
the
dynamics
of
weight
struc-
The
Gelidium
sesquipedale
weight inequality
/mean
tures did
not
reveal
clear
seasonal variations
(Fig.
2),
frond
weight
relationship
increased
from
a
low
in
because
the statistics are sensitive to variations of
the
winter to a maximum
in
summer (Fig. 6A),
suggesting
right
tail
of
these
highly
skewed
distributions.
The
a
differential biomass
increase
between
heavier
and
presence of
sporadic heavy fronds
has
a great effect on
lighter fronds
during
this period. A similar pattern
was
weight statistics.
also
observed
for
frond
elongation rate
(Santos 1994).
Differential growth
may
be due to density-dependent
suppression
of
smaller
fronds
by
larger
ones
or
by
a
Allometric relationships
density-independent
difference
in
growth
patterns.
Although a
G.
sesquipedale
axis elongates by
division
G e l i d i m
sesquipedale
frond
weight
/length allometry
of
1 apical cell
(Rodriguez
&Santelices
1987),
the
rate
was
highly
variable,
both
seasonally
and
between
of
elongation
of
subsequent
cells
may
be
higher
years,
indicating great
plasticity
in
the
species
form.
in
larger
fronds,
independent
of
crowding.
Further
Inferences
from one
size
measure
to
another
in
G.
studies
are
needed
to
clarify this
point.
sesquipedale
must
take
into
account
the
temporal
Both
inequality/mean
frond
weight
and
biomass/
variability
of
weight/length
allometry. Plant
allometric
density relationships in
Gelidium
sesquipedale
showed
changes
can
be
explained
in
terms
of
intraspecific
no
evidence
of
self-thinning.
Thomas
&Weiner
(1989)
competition and size-dependent growth after the onset
noted that the ability
of
small, suppressed plants of
the
of
competition
(White
1981,
Weller
1987,
Weiner
&annual
Irnpatiens
pallida
Nutt.
to
survive
was
critical
Thomas 1992).
Yet,
in
natural populations
of
G.
sesqui-
in determining
the
relationship
between
mean
plant
pedale,
physical disturbances
are
likely
to
play
a
weight
and size inequality. They
report
a
slope of
0.41
fundamental
role in allometry
variability.
The loss of
before
the
onset
of
self-thinning, which is
similar
to
the
branches due
to
commercial
harvest
and
storms
slope
of
0.45 found
for
G.sesquipedale
(Fig.
6A).
In
reduced
the
slope
from summer
1989 to
winter
1990.
plant
populations
where
self-thinning
is
important,
The
same
was
not
observed
during
the
summer
of
slopes of
-0.20
and -0.10 were
reported, respect~vely,
1990,
due to the reduced
harvest
effort
in
this season.
for
2conifer
species
(Weiner
&Thomas
1986)
and for
Gelidiurn
sesquipedale
weight/length
allometry
the annual
wild-rice
Zizania
aquatica
(Weiner
&Whig-
shows
that
frond
branching was
high
in
the
spring.
ham
1988).
Branching was also
evident
from the increase in mean
The
onset
of
natural
self-thinning in
Gelidium
ses-
frond
weight
from
April
to
May/June,
after
a
period
qulpedale
populations
is
perhaps
precluded
by
the
when
weight
was
constant
despite
the
increase
of
thinning
and
frond breakage caused by
harvest
during
frond mean length (Fig.
lA, B).
Higher
branching
dur-
early summer.
Gelidium
spp. generally occur in habi-
ing
spring
and
summer
is
typical
of
Gelid.ium species
tats
exposed
to
strong
wave
surge
(Santelices
1988),
(Seoane-Camba
1969,
Barilotti
&Sdverthorne
1972,
hence they likely
rarely reach
a self-thinning situation.
Reguera
et
al.
1978,
Carter
&Anderson
1986).
Higher
Following
summer
production
peaks,
large
biomass
irradiance
during this
season
may be
the
environmen-
losses
occur
during
fawwinter
storms.
Tossed
Gelid-
tal
factor determining this response. Culture studies of
ium
spp. are
harvested
along
the
shores
in
different
Gelidium
latifolium
showed
that
the
number
of
parts of
the world
and
constitute the basis of
important
Santos: Size structure and inequality in Gelidium sesquipedale 261
agar industries (Michanek 1975, Santelices 1988, San-
tos 1 9 9 3 ~ ) .
A general trend towards increasing weight inequal-
ity with increased mean plant weight through time has
been observed in greenhouse studies (see review by
Weiner
&Thomas 1986) and in natural land plant
stands (Schmitt et al. 1987, Thomas
&Weiner 1989). In
seaweeds, there are insufficient data to determine
whether density-dependent thinning is common. Pos-
sibly the only published work analyzing this relation-
ship is that of Martinez
&Santelices (1992), who found
no significant relationship between G and mean frond
weight in a Chilean population of the red alga Iridaea
laminanoides. The authors suggest this might be com-
mon in seaweed species, resulting from a lack of self-
thinning, as Pitelka (1984) reported for physiologically
integrated clonal ramets. However, Martinez
&San-
telices (1992) studied this relationship at only 1 point
in time. It is thus not possible to understand the time
trajectory of the relationship. Ang
&De Wreede (1992)
observed a general increase in size inequality in the
development of seeded blocks and cleared plots of
Fucus distichus (L.) Powell from winter to spring, prob-
ably due to a greater mortality of smaller plants (Ang
&De Wreede 1992). This trend became less distinct in
summer due to increased mortality of larger plants.
In seaweeds, the more appropriate competition
model might be the l-sided as opposed to 2-sided
model, in which resource depletion will have an effect
proportional to the size of the plant (see review of plant
competition models in Weiner
&Thomas 1986). The
l-sided competition model predicts that small plants
will be more suppressed than bigger ones when
resources are not evenly distributed, i.e. when larger
plants can have more resources than the smaller ones,
because of size. This is the generally accepted model
in higher plants when competition is for light, but,
when it is for nutrients, the 2-sided model may be more
appropriate. In subtidal seaweeds, not only is light
more readily available for larger plants, but so are
nutrients due to the fluid mechanics of this environ-
ment. Under the canopy, water movement is reduced
and the boundary layers of small fronds can be more
easily nutrient depleted (Koehl 1986, Denny 1988).
Larger plants are more exposed to both light and water
movement, at least in the upper parts of the thallus.
This might be particularly important in species such
as Gelidium spp. in which growth is apical.
Conceptual model of population
This work shows the importance of disturbances,
both natural (storms) and human (harvesting) on the
regulation of Gelidium sesquipedale population size
Self-thinning line
.-
,.
.-.
--
..
/. Early summer '2c..,,1
Spring '.. lnequal~ty trajectoryWinter ... ... Recruitment and
differential frond growth
log Density (or Mean frond weight)
Fig. 7 Gelidium sesquipedale. Conceptual model of popula- tion dvnamics. Relationshi~s between both loa biomass and log density and between inequality (Gini coefficient) and log mean frond weight increased from winter to summer. This was due to the suppressed growth of smaller fronds during this period of high elongation rates. The population studied did not attain a self-thinning condition, when the time trajec- tory of the relationships should bend along opposite directions (dashed arrows). Physical disturbances (harvest and storms; dotted lines) caused high mortality and breakage, particularly of larger fronds, reducing intraspecific competition pressure to low levels where self-thinning does not occur. Both rela-
tionships decreased during this period to a low in winter
structure. The following conceptual model of the
species population dynamics is suggested (Fig.
7).Both the relationships, biomass/density and inequality/
mean frond weight, decrease from summer to winter
(Fig.
6)due to physical disturbances. Disturbances
cause high mortality and breakage of larger fronds
during summer and fall (Santos 1994), keeping intra-
specific competition at low levels. During such
periods, smaller frond elongation rate is high and
their mortality is low (Santos 1994). The recruitment
peak of vegetatively developed fronds follows these
disturbances (Fig. 5B), and is probably induced by
biomass loss. During spring and early summer, the
opposite pattern was observed (Fig. 7) due to faster
growth and lower mortality of larger fronds (Santos
1994). The
G. sesquipedale stand studied never
reached the level where extensive self-thinning
caused the time trajectory of these relationships to
bend in opposite directions (Fig.
7),as Weiner
&Thomas (1986) and Weller (1987, 1990) reported for
higher plants. The dynamic/thinning line (Weller
1990) of this G . sesquipedale stand may be well
above the interspecific self-thinning line (Yoda et al.
1963, Weller 1987).
262 Mar. Ecol. Prog. Ser. 119: 253-263, 1995
Acknowledgements. P. Duarte and A. Morais provided invaluable field and laboratory support. The comments of J . Pringle, G. Sharp, S. Walde, P. Ang, R. De Wreede, C. Hudon, J . Welner and B. Husband greatly improved the manuscript. This research was funded by Laborat6rio Nacional de Engen- haria e Tecnologia Industrial through Dr C. Peneda's grant, to whom I am particularly grateful. Grants from Junta Nacional d e Investiga$do Cientifica e Tecnolbgica, scholarship (BIC no. 402), Government of Canada Awards, and Lett Bursary, Dal- housie University, supported my stay in Canada. The Halifax Fisheries Research Laboratory provided the conditions as well as an excellent worklng environment for data analyses and wnting.
LITERATURE CITED
Ang, P. 0. Jr, De Wreede, R. E. (1992). Density-dependence in a population of Fucus distichus. Mar. Ecol. Prog. Ser. 90: 169-181
Barilotti, C., Silverthorne, W. (1972). A resource management study of Gelidium robusturn. Proc. i ~ t . S e a ~ ~ e e d S y ~ p . 7: 255-261
Begon, M. (1984). Density and individual fitness: asymmetric competition. In: Shorrocks, B. (ed.) Evolutionary ecology. Blackwell, Oxford, p. 175-194
Bendel, R. B.: Higgins S S.: Teherg: .I. E.; Pyke, D . A . (1989)
Comparison of skewness coefficient, coefficient of varia- tion, and Gini coefficient as inequality measures within populations. Oecologia 78: 394-400
Bonan, G. B. (1988). The size structure of theoretical plant populations: spatial patterns and neighborhood effects. Ecology 69: 1721-1730
Carter, A. R., Anderson, R. J . (1986). Seasonal growth and agar contents in Gelidium pristoides (Gelidiales, Rhodo- phyta) from Port Alfred, South Africa. Botanica mar. 29: 117-123
Chopin, T., Pringle, J. D., Semple, R. E. (1992). Impact of har- vesting on frond density and biomass of Irish moss (Chon- drus crispus Stackhouse) beds in the southern Gulf of St. Lawrence. Can.
J.
Fish. Aquat Sci. 49: 349-357 Cousens, R., Hutchings, M. J . (1983). The relationship be-tween density and mean frond weight in monospec~f~c seaweed stands. Nature 301: 240-241
Denny, M. W. (1988). Biology and the mechanics of the wave- swept environment. Princeton University Press, Princeton Dixon, P. (1958). The structure and development of the thallus in the British species of Gelidium and Pterocladia. Ann. Bot. 22: 353-368
Edrneades, G. O., Daynard, T. B. (1979). The development of plant-to-plant variability in maize at different planting densities. Can. J. Plant Sci. 59: 561-576
Fan. K. C. (1961). Morphological studies of the Gelidales. Univ. Calif. Publ. Bot. 32: 315-368
Fredriksen, S . , Rueness, J . (1989). Culture studies of Gelidium latifolium (Grev.) Born. et Thur. (Rhodophyta) from Norway. Growth and storage In response to varying photon flux density, temperature and nitrogen availability. Botanica Mar. 32: 539-546
Geber, M. (1989). Interplay of morphology and development on size inequality: a Polygonium greenhouse study. Ecol. Monogr. 59: 267-288
Hara, T. (1988). Dynamics of size structure in plant popula- ti.ons. TREE 3: 129-133
Harper. J. L. (1977). Population biology of plants. Academc Press, London
Higgins, S. S., Bendel, R. B., Mack., R. N. (1984). Assessing
competition among skewed distributions of plant biomass: an application of the jackknife. Biometrics 40: 131-137 Higgins, S. S., Mack, R. N. (1987). Comparative responses of
Achillea miNefoLium ecotypes to competition and so11 type. Oecologia 73: 591-597
Kendall, M. G., Stuart, A. (1969). The advanced theory of statistics, Vol. 1, Distribution theory. Hafner, New York Kira, T., Ogawa, H., Sakazaki, N. (1953). Intraspecific com-
petition among higher plants I. Competition-yield-density interrelationships in regularly dispersed populations. J. Inst. Polytech. Osaka City Univ. Ser. D 4: 1-16
Koehl, M. A. R. (1986). Seaweeds in moving water: form and mechanical function. In: Glvnish, T. J . (ed ) On the economy of plant form and function. Cambridge Univer- sity Press, Cambridge
Koyama, H., Kira, T (1956). Intraspecific competition among higher plants. VIII. Frequency distributions of indi- vidual plant weight as affected by the interaction be- tween plants. J . Inst. Polytech Osaka City Univ Ser. D 7: 73-94
Mack, R. N., Harper, J . L. (1977). Interference in dune annu- a!s: spatla! pattern and neighborhooc! effects. Eco!ogy 65: 345-363
Mack, R. N., Pyke, D. A. (1983). The demography of Bromus tectorum: variation in time and space. J . Ecol. 71: 69-93 Martinez, E., Santelices, B. (1992). Size hierarchy and the
-3/2 'power law' r~latinnship in a coalescent seaweed J . Phycol. 28: 259-264
Michanek, G. (1975). Seaweed resources of the ocean. FAO Fish. tech. Pap. 138: 127
Pitelka, L. F. (1984). Application of the -3/2 power law to clonal herbs. Am. Nat. 123: 442-449
Pringle, J. D., Semple, R. E. (1992). Impact of harvesting on Irish moss (Chondrus crispus Stackhouse) frond size- class structure. Can. J . Fish. Aquat. Sci. 45: 763-373 Rabinowltz, D. (1979). Bimodal distributions of seedling
weight in relation to density of Festuca paradoxa Desv. Nature 277: 297-298
Reguera, B., Salinas, J. M., Gancedo, R. (1978). Biometria en Gelidium sesquipedale (Rhodophyta). Segunda Parte. Bol. Inst. esp. Oceanogr. 4: 101-138
Riddle, M. J . (1989). Precision of the mean and the design of benthos sampling programmes: caution adv~sed. Mar. Biol. 103: 225-230
Rodger, R. (1974). Multiple contrasts, factors. error rate and power. Br. J . math. statistic. Psychol. 27: 127-198
Rodger, R. (1975). The number of non-zero, post hoc contrasts from ANOVA and error-rate. I . Br. J . math. statistic. Psy- chol. 28: 71-78
Rodriguez, D , Santelices, B. (1987). Patterns of aplcal struc- ture in the genera Gelidium and Pterocladia (Gelidiaceae, Rhodophyta). Hydrobiologia 151/152: 199-203
Santelices. B. (1988). Synopsis of biological data on the sea- weed genera Gelidium and Pterocladia (Rhodophyta). FAO Fish. Synopses 145: 1-55
Santos, R . (1993a). A multivanate study of b~otic and abiotic relationships in a subtidal algal stand. Mar. Ecol. Prog. Ser. 94: 181-190
Santos. R. (1993b). Plucking or cutting GeLidium sesqui- peddle? A demographic simulation of harvest impact using a population projection matrix model. Hydrob~o- logia 260/261: 269-276
Santos. R. ( 1 9 9 3 ~ ) . Population ecology of the commercial seaweed Gelidium sesquipedale: biological Input for resource management. Ph.D. dissertation, Dalhousie University. Halifax
Santos: S ~ z e structure and inequal~ty in Gel~dium sesquipedale 263
Gelidium sesquipedale: effects of size and of frond history. Mar. Ecol. Prog. Ser. 107: 295-305
Santos, R., Duarte, P. (1991). Marine plant harvest in Portugal. J . appl. Phycol. 3 . 11-18
Schiel, D. R. (1985). Growth, survival and reproduction of two species of manne algae at different densities in natural stands. J. Ecol. 73: 199-217
Schmitt, J., Eccleston, J., Ehrhardt, D. \V. (1987). Dominance and suppression, size-dependent growth and self-thinning in a natural Impatiens capensis population. J . Ecol. 75: 651-665
Schmitt, J., Ehrhardt, D. W., Cheo, M. (1986). Light-dependent dominance and suppression in experimental radish popu- l a t i o n ~ . Ecology 67: 1502-1507
Seoane-Camba, J . (1969). Crecimiento, produccion y de- sprendimiento de biomassa e n Gelidium sesquipedale (Clem.) Thuret. Proc. int. Seaweed Symp. 6: 365-374 Sokal, R. R., Rohlf, F. J. (1969). Biometry. The principles and
practice of statistics in biological research. W. H. Freeman, San Francisco
Thomas, S. C., Weiner, J. (1989). Growth, death and size distribution change in a n Impatiens pallida population. J . Ecol. 77: 524-536
Weiner, J'. (1985). Size hierarchies in experimental popula- tions of annual plants. Ecology 66: 743-752
Weiner, J . , Solbrig, 0. T (1984). The meaning and measure- ment of size hierarchies in plant populations. Oecologia 61: 334-336
Weiner, J., Thomas. S. C. (1986). Size variability and competi-
tion in plant monocultures. Oikos 47: 211-222
Weiner, J , Thomas, S. C . (1992). Competition and allometry in three species of annual plants. Ecology 73: 648-656 Weiner, J., Whig'ham, D. F. (1988). Size variability and self-
thlnning in wild-rice (Zizania aquatics). Am. J. Bot 75 445-448
Weller. D. E. (1987). A reevaluation of the -3/2 power rule of plant self-thinning. Ecol. Monogr. 57: 23-43
Weller, D. E. (1990). Will the self-thinning rule please stand up? A reply to Osawa and Sugita. Ecology 71. 2004-2007 Westoby. M. (1981). The place of the self-thinning rule in
population dynamics. Am. Nat. 118: 581-587
Westoby, M. (1984). The self-thinning rule. Adv. ecol. Res. 14: 167-225
White, J. (1980). Demographic factors in populations of plants. In: Solbrig, 0 . T. (ed.) Demography and evolution in plant populations. Blackwell Scientific Publications, Oxford, p. 21-48
White, J. (1981). Allometric interpretation of the self-thinning rule. J. theor. Biol. 1989: 474-500
White. J., Harper, J. L. (1970). Correlated changes in plant size and number in plant populations. J. Ecol. 58: 467-485 Wllkinson, L. (1989). SYSTAT: the system for statistics. SYS-
TAT, Inc., Evanston, IL
Yoda, K., IGra, T., Ogawa, H., Hozunli, K. (1963). Self-thinning in overcrowded pure stands under cultivated and natural conditions (intraspecific competition among higher plants XI). J. Inst. Polytech. Osaka City Univ. Ser. D 14: 149-166
This article was submitted to the editor Manuscript first received: May 6, 1994 Revised version accepted: November 26, 1994