UNIVERSIDADE DA BEIRA INTERIOR
Ciências Sociais e Humanas
The financial determinants of corporate cash
holdings: Evidence from growing firms
Marília de Sena Gomes
Dissertação para obtenção do Grau de Mestre em
Economia
(2º ciclo de estudos)
Orientador: Prof.ª Doutora Ana Paula Matias Gama
iv
Master thesis additional credits
2012 – Co-Author of the paper submitted and accepted for ISBE – INSTITUTION FOR SMALL
BUSINESS AND ENTREPRENEURSHIP: “The financial decision of holding cash in growing firms”.
2012 – Co-Author of the paper submitted for RENT – RESEARCH IN ENTREPRENEURSHIP AND
SMALL BUSINESS (1st Submission): “The financial decision of holding cash in growing firms” (under review).
vi
Acknowledgements
Finished one more important leg of my life, I would like to thanks everyone who contributed in a direct and indirect way so that this investigation’ work can be done.
Firstly, my deep acknowledgement goes to Teacher Ana Paula Matias Gama, my advisor, for her support and comprehension and for her orientation and critical rigour and analyses. I will always see her as a professional example and a woman example. Thank you for making this work contributes to my personal and professional development.
I would also like to thanks Teacher Tiago Sequeira for the concern and availability who he always demonstrated during these years.
In addition, I would like to thanks and dedicate, all my love and gratitude, my master thesis to my parents, but specially to my sister, because all days she believes in me.
In the same way, the success of this work is dedicated to God for the strength and capacity who He gave me to overcome all the problems, and to my best friends (they know who they are!). Thanks not only for the friendship and support but also for the patience and for all happiest moments.
To all them, “o meu bem-haja”.
“Genius is 1% talent and 99% percent hard work.”
ix
Abstract
Holding cash is a matter of managerial discretion. High growing firms face a very dynamic market competition. To maintain their competitive advantages those firms have to devote capital to new investment projects. Because these firms face a higher degree of asymmetry about the value of assets in place and future growth opportunities, this study contends that the entrenchment effect becomes less significant between managers and shareholders. Hence, this paper examines the financial determinants of corporate cash holdings in a sample of 231 French IPOs firms over the period 2000 to 2007. By using dynamic estimators, the results show that growing firms keep considerably higher cash ratios comparing with mature firms. In line with trade-off theory, growing firms follow an optimal level of cash holdings. Moreover, the results show that the adjustment of cash levels to their target level is faster than those found in previous studies. This faster adjustment could be synonymous of a higher business complexity which results in less information transparency, greater likelihood of financial distress and higher financial constraints costs. Furthermore, for firms that are more likely to suffer financial constraints, that is with low credit rating or the absence of them, cash flows and net working capital are seen a valid substitute of cash. Overall, the findings confirm that cash holdings of French IPOs firms increase (decrease) as the growth options climb (fall).
Keywords
Cash holdings, Trade-off Model, Pecking Order Theory, Agency costs, Growth opportunities.
xi
Resumo
As empresas de forte crescimento são em geral empresas mais jovens, com um maior risco financeiro e um maior volume de activos intangíveis, sendo os seus fluxos de caixa instáveis. Estas empresas actuam em mercados muito competitivos e dinâmicos, quando comparadas com empresas que operam em mercados mais tradicionais. Para crescerem estas empresas empreendem avultados projectos de investigação e desenvolvimento (I&D), associados a processos produtivos de alta tecnologia e maior complexidade. O valor destas empresas é essencialmente determinado pelas suas oportunidades de crescimento, o que se traduz numa maior assimetria de informação e, consequentemente, num acesso aos mercados de capitais mais difícil, enfrentam por conseguinte mais constrangimentos financeiros, bem como maiores custos de falência. Neste contexto, para estas empresas a liquidez é um activo essencial na sua estrutura financeira, pois tal permite mitigar a dependência face aos fundos externos. Assim, este estudo sustenta que nestas empresas existe um maior alinhamento de interesses entre os gestores e os accionistas, uma vez que, os gestores são menos avessos ao risco e empreendem projectos que apesar de registarem um maior risco, revelam também maiores taxas de retorno para os accionistas.
A literatura sobre cash holdings tem-se debruçado mais sobre empresas onde os problemas de free cash flow são mais pertinentes, isto é, empresas de maior dimensão e com ciclos de vida longos. Este estudo tem como objectivo principal preencher esta lacuna relativamente aos determinantes financeiros por detrás da decisão da alocação de dinheiro em empresas que registam um forte crescimento. Usando uma amostra de 231 empresas francesas que realizaram uma oferta pública de aquisição no período de 2000 a 2007, os resultados obtidos a partir de estimadores dinâmicos mostram que estas empresas detêm, em média, maiores rácios de liquidez comparativamente a empresas mais maduras e tradicionais. Os resultados também confirmam que estes tipos de empresas alocam maiores reservas de liquidez para empreenderam as opções de crescimento fazem parte do seu portfólio de investimento. A evidência empírica confirma ainda o comportamento dinâmico dos cash holdings nestas empresas e, consequentemente, a teoria do trade-off, pois o ajustamento para o nível óptimo de liquidez nestas empresas é mais rápido face aos resultados reportados em empresas tradicionais. Este ajustamento pode ser justificado pela complexidade do seu negócio, induzindo numa maior opacidade informacional e, consequentemente, maior probabilidade de incorrerem em dificuldades financeiras. Os resultados também confirmam que as empresas que enfrentam mais constrangimentos financeiros, isto é, com baixo rating de crédito ou ausência deste, detêm menores níveis de liquidez. Em síntese, os resultados mostram que o portfolio de projectos de investimento detidos por estas empresas afectam as decisões sobre o nível de liquidez a deter.
Palavras-Chave
Cash Holdings, Modelo trade-off, Teoria da Pecking Order, Custos de Agência,
Oportunidades de Crescimento.
xiii
Contents
1. Introduction
1 2. Corporate cash holdings: theory and empirical evidence 4
2.1. The trade-off theory 4
2.2. The financial hierarchy theory 5
2.3. The agency theory 5
2.3.1. Agency problems in context of growing firms 6
2.4. Empirical evidence 7
3. The determinants of cash holdings: Research hypotheses 8
3.1. Growth Opportunities 8
3.2. Leverage 8
3.3. Financing Deficit 9
3.4. Net Working Capital 10
3.5. Probability of Financial Distress 10
3.6. Firm Size 11
3.7. Age 11
4. Sample, variables’ definition and method
4.1. Sample 12 4.2. Variables 12 4.3. Method 15 5. Results 5.1. Univariate analysis 17 5.2. Multivariate analysis
5.2.1. Determinants of cash holdings: full sample 21 5.2.2. Determinants of cash holdings: small versus large growing firms 25 5.2.3. Determinants of cash holdings: low growth firms versus high
growth firms 27
6. Summary and conclusions
29
7. References 31
xv
List of tables
Table 1 – Financial Determinants of Cash Holdings in Growing Firms Table 2 - Descriptive statistics
Table 3 - Cash Holdings and Growth Opportunities by technological industries and knowledge based
services
Table 4 - GMM cash holdings regressions: dynamic panel data estimation results Appendix A - Correlation Matrix
1
1. Introduction
In financial environment without asymmetric information, taxes and agency and/or transaction costs, firms would not have need to hold cash since there are no benefits or costs of allocating cash. If internal cash of company is not enough they can obtain external financing at fair prices, without to compromise growth and investment. Hence, in a frictionless world, decisions about cash would not impact the firm value (Stiglitz 1974) or shareholder wealth (Opler, Pinkowitz,
Stulz and Williamson 2001). Nevertheless, the markets are far from perfect; thus, raising external
capital is more costly for firms relative to internal resources, due to market imperfections
(Greenwald, Stiglitz and Weiss 1984; Myers and Majluf 1984). As Denis and Sibilkov (2007) point out,
some firms with attractive growth options in their portfolio take fewer investments than the first-best optimum. Therefore, in imperfect market cash holdings are an important asset in financial structures of these firms.
Keynes (1936) began the financial literature about cash holdings, suggesting two key
benefits from allocating cash: i) reduction transaction costs since to make payments firms do not need to liquidate assets and ii) cash is a precious buffer to meet future uncertainty. Accordingly, two main economic theories support the decision of firms to hold cash: the trade-off theory and the financial hierarchy theory, also known by the pecking order theory. Developed by Miller and Orr
(1966), the trade-off theory suggests that firms define a target level of cash holdings by trading off
the marginal costs and marginal benefits of cash allocation. In the opposite direction, the financial hierarchy theory sustain that there is neither optimal level of cash holdings nor an optimal debt for firms (Myers and Majluf 1984). Thus, in the presence of asymmetric information companies prefer finance their new investments projects first with cash generated internally, second with low risk debt and lastly with equity.
Agency costs also influence the allocating of cash. Because holding cash is a matter of managerial discretion, and turning excess corporate cash into personal benefits is less costly to managers than transferring other assets to private benefits (e.g., Myers and Rajan 1998), managers have strong incentives to hold more cash, therefore, high cash holdings may lead to the agency problem of free cash and, consequently, harm shareholders expectations (Jensen 1986). However, the agency problem of free cash flow is more likely to arise in profitable firms with limited investment opportunities (Opler, Pinkowitz, Stulz and Williamson 1999).
Growing firms are usually in more competitive and dynamic markets and are viewed as riskier, younger and with more intangible assets and unstable cash flows comparing with their mature and traditional counterparts. Additionally, these firms undertake more research and development (R&D) activities, which result in patents and are described by their intensive knowledge and high-technology as well their exclusive processes and products (Granlund and
2
the fact that value of these firms is mainly determined by their growth options, they face more severe information asymmetries which results in more expensive external financing. In addition, because their value is based in their intangible assets they are more likely to face higher bankruptcy costs and their value is compromised in presence of financial distress or bankruptcy (Harris and
Raviv 1991; Williamson 1988). Consequently, these firms also show probably more serious financial
constraints (Bertoni, Colombo and Grilli 2011; Carpenter and Petersen 2002). Hence, the agency problems concerning to cash holdings in growing firms can be opposite to those problems suggested by agency literature (Easterbrook 1984; Jensen 1986). As Ozkan and Ozkan (2004) point out, the entrenchment effect should be more trivial for firms with greater growth opportunities since in presence of higher growth opportunities the interests of shareholders and managers are in agreement.
Recent studies have documented an increase trend in the cash holdings for US firms (e.g.,
Bates, Kahle and Stulz 2009) and for European Union (EU) firms (Ferreira and Vilela 2004). Thus, empirical literature focuses a great attention on the determinants of corporate cash holdings. These include US firms (e.g., Dittmar and Mahrt-Smith 2007; D’Mello, Krishnaswami and Larkin 2008; Foley, Hartzell, Titman and Twite 2007; Harford, Mansi and Maxwell 2008; Opler, Pinkowitz, Stulz
and Williamson 1999); UK setting (Al-Najjar and Belghitar 2011; Ozkan and Ozkan 2004); European
single countries (Bigelli and Sánchez-Vidal 2012 - Italian firms; Bruinshoofd and Kool 2004 - Dutch firms; Deloof 2001 - Belgian firms; Drobetz and Grüninger 2007 - Swiss non-financial firms; García-Teruel and Martinez Solano 2008– Spanish firms); EU firms (Ferreira and Vilela 2004; Pal and
Ferrando 2010) and cross-country comparisons (e.g., Al-Najjar 2012; Dittmar, Mahrt-Smith and
Servaes 2003; Guney, Ozkan and Ozkan 2007; Pinkowitz and Williamson 2001; Ramírez and Tadesse 2009). Yet, little attention has been given to the determinants of cash holdings in growing firms. To the best of our knowledge only two papers investigate the determinants of cash holdings policy in US growing firms. Chen (2008) compares the relation between corporate governance and cash holdings in listed new economy and old economy US firms, whereas Chen and Chuang (2009)
examine this relation for the US high-tech firms. Therefore, the aim of this study is to extend the literature of cash and fill this gap by investigating the financial determinants behind of decision of holding cash in firms with plentiful investment opportunities which are characterized by lower or no agency costs of free cash flow (Jensen 1986).
Using a sample of 231 French IPOs firms over the period 2000 – 2007, the results from two-step dynamic estimators show that cash holdings of French growing firms average about 31% of total assets, much higher compared with 9.9% for UK listed firms (Ozkan and Ozkan 2004) or 8.1% for US listed firms (Dittmar, Mahrt-Smith and Servaes 2003). Furthermore, the empirical results show that sample firms characterized by high-technology and knowledge intensive show significantly greater cash ratios and higher level of growth opportunities than their counterparts. These findings confirm that cash holdings of French IPOs firms increase (decrease) as the growth options climb (fall). In addition, the results also show that growing firms follow an optimal level of cash holdings, which
3
confirms the trade-off theory. Moreover, the results show that the adjustment of cash levels of French IPOs firms to their target level is faster than those found in previous studies. This faster adjustment could be synonymous of a higher business complexity which results in less information transparency, greater likelihood of financial distress and higher financial constraints costs. Hence the strategy to hold higher levels of cash holdings is a strategy to avoid underinvestment. Moreover, for firms that are more likely to suffer financial constraints, that is with low credit rating or the absence of them, cash flows and net working capital are seen a valid substitute of cash. Furthermore, because small and fast growing firms face great challenges in obtain external finance due their higher likelihood of financial distress; those firms have greater benefits of holding large cash reserves to keep alive their growth options.
The structure of the paper is as follows. Section 2 presents an overview of the theories about corporate cash holdings and empirical evidence showed by previous studies. Section 3 develops research hypotheses and adapts the theories to a growing firms’ context. Sections 4 describe data, variables and the method, while Section 5 presents and discusses the results. Finally, Section 6 summarizes the main conclusions.
4
2. Corporate cash holdings: theory and
empirical evidence
In a world of perfect capital markets there would be no transaction costs for raising cash, thus holding of liquid assets would be irrelevant and would not affect a firm’s value (Stiglitz 1974). The volume of kept cash to deal with productive investments or temporary cash shortfalls could be obtained without problem and at a reasonable price. Moreover, the absence of a premium for liquidity or taxes would mean that keeping cash would not have an opportunity cost or fiscal disadvantages, respectively. In this context, decisions about investment in liquid assets would not affect shareholder wealth (Opler, Pinkowitz, Stulz and Williamson 2001). Cash is merely negative debt, and there is no optimal amount of cash. The financing deficit is the key driver of changes in the cash position.
But markets are far from perfect and transaction costs are relevant. Once capital market imperfections are introduced, firms are not necessarily able to pursue all value-increasing investment opportunities. For instance, capital market frictions increase the cost of outside capital relative to internally generated funds (Greenwald, Stiglitz, and Weiss 1984; Myers and Majluf 1984). Consequently, some firms that have attractive growth opportunities invest less than the first-best optimum, leading to lower future growth and reduced operating performance and firm value (Denis and Sibilkov 2007). Hence, cash holdings can be valuable when other sources of funds, including cash flows, are insufficient to satisfy firms’ demand for capital. Therefore, these imperfections do exist and are more relevant to firms with a lot of opportunities investment.
2.1. Trade-off theory
The literature about cash specifically applied to companies is generally traced back to Miller
and Orr (1966), who develop a trade-off model. According to these authors, companies must
determine the optimal level of cash holdings by trading off the marginal cost of holding liquid assets (lower return) with its marginal benefit (e.g., minimization of transaction costs, undertaking investment opportunities in case of market frictions). Thus, the trade-off theory of cash holdings posits that firms have two motives for holding cash: transaction cost and precautionary motives. In relation to the former, the theory suggests that firms hold cash because raising funds in capital markets is more costly than retaining existing cash (e.g., because external financing involves fixed and variable costs related to the amount of capital raised - Ozkan and Ozkan 2004). These cost components imply that there is an optimal amount of cash to be raised and induces a firm to hold cash as a (costly) buffer. Hence, transaction costs are higher for firms that are less closely
5
monitored and have worse access to the capital markets (Opler, Pinkowitz, Stulz and Williamson 1999). The precautionary motive emphasizes information asymmetries and the opportunity costs of foregone investments (e.g., Kim, Mauer and Sherman 1998). If the adverse selection costs of external finance and/or the costs of financial distress are excessively high, firms accumulate liquidity to meet unanticipated cash shortfalls and finance their positive net present value investments (Opler, Pinkowitz, Stulz and Williamson 1999; Ozkan and Ozkan 2004). Because growing firms face more severe market imperfections and higher bankruptcy costs, this study argues that trade-off theory can explain cash holding decisions in these firms.
2.2. The financial hierarchy theory
In the opposition of the trade-off model, the financing hierarchy theory does assume neither an optimal debt nor an optimal level of cash holdings for the company (Myers 1984; Myers and
Majluf 1984). The finance hierarchy theory (or pecking order theory) sustain that in the presence of
asymmetric information, companies prefer finance their new investments projects first with cash generated internally, second with low risk debt and lastly with equity (Myers and Majluf 1984). Moreover, if adverse selection costs become extreme, firms prefer external funding by debt compared to equity issuance since debt has lower information costs than equity or even go forego investments (Myers 1984). Hence, as argued by Dittmar, Mahrt-Smith and Servaes (2003) cash can be seen as an outcome of the different financing and investment decisions proposed by the hierarchal pattern of finance. Accordingly, cash holdings follow an inverse pattern over time, that is cash decreases when investments exceed retained earnings, and vice versa. Thus, this study contends that this financing hierarchy should be even stronger in growing firms to avoid excessive adverse selection costs or even being forced foregoing some profitable investment opportunities (e.g.,
Deloof 2001).Different financial factors, as determinants of cash holdings, have been used by
empirical studies to reflect this theory. For instance, Al-Najjar and Belghitar (2011) employ leverage and profitability as financial variables that determine the decision to hold cash whereas
Ferreira and Vilela (2004) use size and cash flow to empirically test this theory.
2.3. Agency theory
In addition to trade-off and financial hierarchy theories, corporate cash holdings can also be explained by agency theory. The agency relationship is a result of the separation between management and ownership of the firm. There are some advantages of this separation, including the ability of ownership to change without impacting operations, and the possibility of hiring experts to act as managers (Jensen and Meckling 1976). But because a company’s cash-holding
6
policy is a matter of managerial discretion, the level of cash holdings raises concerns when managers do not act in the best interests of shareholders. Hence, as Jensen (1986) argues in the presence of managerial discretion, managers have incentives to hold large amounts of cash in order to have more flexibility to pursue their own objectives. Cash allows management to make investments that the capital market would not be willing to finance. Moreover, because managers are risk-averse and are not fully diversified they cannot divide their human capital; therefore more entrenched managers hold excess cash to avoid market discipline (Fama and Jensen 1983). In addition, managers also prefer to hold large cash reserves to help cope with unexpected adversity, for example, in periods when the access to capital markets is costly (Stulz 1988).Thus, because excess cash holdings allow self-serving managers to avoid the discipline of the capital markets, investing in cash can have detrimental effects on firm value, subsequently harm the interest of shareholders (Jensen 1986). Whether or not such agency problems exist in firms with high investment opportunities stills an unanswered question in the literature.
2.3.1. Agency problems in context of growing firms
The agency problems relating to cash holdings in growing firms may not be the same as those problems in the agency literature (Dittmar, Mahrt-Smith and Servaes 2003; Easterbrook 1984;
Jensen 1986). Growing firms often involve shorter product life cycles and more capital investments
than traditional firms (Bahrami and Evans 1987; Wasserman 1988).The success of growing firms depends highly on the success and uniqueness of their innovations (Chen 2008). Hence these firms have lower cash flow, higher amount intangible assets and they spend more on R&D activities (Chen 2008). Also, growing firms are characterized by high degree of information asymmetry between managers and investors about the value of the assets in place and future growth opportunities; hence they face high adverse selection costs when raising external capital (D’Mello, Krishnaswami and Larkin 2008). In addition, their higher business risk leads more difficulty obtaining external financing, which could force them to forgo valuable investment opportunities (Chen 2008). Thus, for growing firms greater cash holdings might be more valuable because they allow the firm to invest when other sources of funds are costly, limited, or unavailable, avoiding underinvestment and reduced growth (Denis and Sibilkov 2007). Moreover, possessing certain cash levels reduces the likelihood of financial distress, especially for those firms with more volatile cash flows. Therefore, growing firms have strong incentives to retain high levels of cash in order to pursue firm value creation through intensive capital investments, which serves their shareholders best. Consequently, cash holdings are crucial for these firms because cash reserves promote investments without hindering corporate performance (e.g., Mikkelson and Partch 2003). Thus, managers of growing firms are more likely to undertake risky investments than those of traditional firms (Chen 2008). That is, managers of growing firms may not be so risk averse as those of traditional firms; rather, they will take more risks to yield higher returns (e.g., Chen 2008). Thus, in line with Ozkan and
7
Ozkan (2004), this study contends that the entrenchment effect becomes less significant as the firm’s growth opportunities increase because the interests of managers and shareholders are better aligned with greater growth opportunities.
2.4. Empirical evidence
The empirical analysis of the determinants of firms’ cash holdings has received growing attention by academics only in the last 10 years. Empirical literature focuses a great deal of attention on the determinants of corporate cash holdings and the empirical literature mainly refers to US listed companies (D’Mello, Krishnaswami and Larkin 2008; Harford, Mansi and Maxwell 2008; Kim, Mauer and Sherman 1998; Opler, Pinkowitz, Stulz and Williamson 1999), or US multinational firms (Foley, Hartzell, Titman, and Twite 2007), whereas Bates, Kahle and Stulz (2009) investigate the evolution of the US firms cash holdings and Foley, Hartzell, Titman, and Twite (2007) examine the importance of holding high cash levels in the US taxation context. Some empirical evidence has also been reported for EMU listed firms (Ferreira and Vilela 2004), EMU large firms (Pal and
Ferrando 2010) and UK listed firms (Ozkan and Ozkan 2004). Additionally, there are also empirical
researches which examine the adjustment of large Dutch firms to long-run liquidity targets
(Bruinshoofd and Kool 2004), the role of intra-group relations in the cash reserves of large Belgian
firms (Deloof 2001) and the determinants of cash levels for Spanish SME firms (García-Teruel and
Martínez-Solano 2008). Others use cross-country comparisons (Dittmar, Mahrt-Smith and Servaes
2003; Guney, Ozkan and Ozkan 2007; Pinkowitz and Williamson 2001; Pinkowitz, Stulz and
Williamson 2006; Ramírez and Tadesse 2009). Yet, little attention has been given to the
determinants of cash holdings in growing firms, which should be characterized by lower or no agency costs of free cash flows. To the best of our knowledge only two papers investigate the determinants of cash holdings policy in US growing firms. Chen (2008) compares the relation between corporate governance and cash holdings in listed new economy and old economy US firms, whereas Chen e Chuang (2009) examine this relation for the US high-tech firms. Thus, this study aims to bridge this gap in the literature by examining the determinants of cash holdings in a sample of French IPOs over the period 2000 to 2007.
8
3. The determinants of cash holdings:
Research hypotheses
High growing firms usually face very dynamic market competition. To maintain their competitive advantages, those firms have to devote capital to new investment projects actively. Hence, such firms have strong incentives to hold cash to mitigate the possibility of having to forego good investment opportunities due to the lack of funds shortage. In this context, shareholders are in a trade-off position between facing the agency problem of excess cash and losing the opportunities of higher returns.
3.1. Growth Opportunities
Firms with valuable growth opportunities are likely to demand greater funds in the future to finance these investments (D’Mello, Krishnaswami and Larkin 2008). However, because the value of those firms is largely determined by their growth opportunities, these firms face larger information asymmetry between managers and investors (Myers 1977). In addition, they have higher potential for risk-shifting and underinvestment, thus, they incur higher external financing costs due high adverse selection costs (Myers and Majluf 1984). Furthermore, growth opportunities can hardly be liquidated in the case of bankruptcy and will lose most of their value. Consequently, this type of firm will keep higher cash levels to avoid costs of financial distress and bankruptcy (Drobetz and
Grüninger 2007). Therefore, if a company has future valuable investment opportunities, it will try
not to run out of cash by the time it needs it (Bigelli and Sánchez-Vidal 2012). Boyle and Guthrie
(2003) show that holding large cash helps to keep potential investment opportunities alive.
Therefore, in line with the agency and the trade-off theories, this study expects a positive relationship between cash holdings and growth opportunities, in order not limit or cancel their profitable investment projects. Thus, the first hypothesis states:
H1: Cash holdings are positively related to growth opportunities.
3.2. Leverage
The financial hierarchy theory suggests a negative relationship between leverage and cash holdings. When investment exceeds retained earnings, cash decreases and leverage increases, provided that firms follow the pecking order of financial instruments. In addition, high-leverage firms are more subject to investor monitoring, implying limited managerial discretion and thus
9
lower cash holdings (Drobetz and Grüninger 2007). In addition, Ferreira and Vilela (2004) show that firms with high level of debt are less able to stockpile cash due the higher monitoring role of financial institutions. Moreover, because leverage can act as a proxy for the ability of firms to issue debt, debt is a substitute for holding cash (Ozkan and Ozkan 2004). Furthermore, firms with more liquid assets can covert these assets to cash and in turn hold lower levels of cash, thus a negative link between leverage and cash holdings is expected (e.g., Opler, Pinkowitz, Stulz and Williamson
1999; Ozkan and Ozkan 2004).
In contrast, the flip side of this argument however, is that, leveraged firms are more likely to hoard cash due to the higher probability of financial distress (Baskin 1987). Moreover, high leverage provokes Myers’ (1977) underinvestment problem, and thus, holding cash minimizes the potential agency costs of debt (Parrino and Weisbach 1999). Furthermore, Guney, Ozkan and Ozkan
(2007) indicate that the relationship between leverage and cash holdings can be non-monotonic.
Therefore, because growing firms may have different investment opportunities, this study contend that firms have different marginal trade-offs with respect to cash and leverage. Thus:
H2: Cash holdings are positively related to leverage.
3.3. Financing deficit
A higher frequency of cash flow shortfalls in the presence of capital market imperfections increases a firm’s cost of accessing external capital. This adversely affects the level of investment (Ozkan and Ozkan 2004). As Dittmar, Mahrt-Smith and Servaes (2003:116) argue: “firms with low
cash flows draw down their cash and issue debt to finance investment, but they refrain from issuing equity because it is too costly”. Thus, according to the financial hierarchy theory, firms
prefer to fund themselves with resources generated internally before resorting to the market (Myers
and Majluf 1984). In these circumstances, firms with large cash flows will keep higher cash levels
(e.g., Opler, Pinkowitz, Stulz and Williamson 1999). To the extent that cash flows are also a proxy for firms’ growth opportunities, the positive impact may indicate that firms with higher cash flows also hold higher cash reserves to avoid situations in which they give up valuable investment opportunities in some states of nature (Almeida, Campello and Weisbach 2004; Ozkan and Ozkan 2004). However, Kim, Mauer and Sherman (1998) claim that the relation is in fact negative, as they consider that cash flows represent an additional source of liquidity for the firm and can therefore substitute cash. Therefore:
10
3.4. Net working capital
The other typical substitutes of cash are bank lines of credit (Demiroglu and James 2011) or those current assets that can easily be transformed into cash (Bigelli and Sánchez-Vidal 2012). Receivables, for example, can be easily cashed out through factoring in small firms or by securitization processes in larger ones. The existence of liquid assets will lead firms to be less reliable on capital markets to obtain cash (Al-Najjar 2012). Furthermore, how much the firm has substitutes for cash that could be liquidated in periods of financial distress, less cash it holds (e.g.,
Bigelli and Sánchez-Vidal 2012; D’Mello, Krishnaswami and Larkin 2008; García-Teruel and Martínez-Solano 2008; Ozkan and Ozkan 2004). Accordingly, it is expected that the costs to convert liquid assets to cash are much lower than other assets. Thus, firms with more liquid assets can covert these assets to cash and in turn are less likely to hoard cash. Hence, the fourth hypothesis states:
H4: Cash holdings are negatively related to firm liquid assets.
3.5. Probability of financial distress
The precautionary motive for cash holdings is also related to potential concerns about having to cut dividends, suffer potential losses from forced divestitures of assets to obtain cash or even avoid the costs of financial distress. The costs of financial distress arise when the firm cannot meet its payment obligations contracted with creditors. Therefore, these costs affect firms’ cash holding decisions, but there is some controversy about the direction. Han and Qiu (2007) and Ozkan and Ozkan (2004) show that higher levels of uncertainty are associated with higher levels of cash reserves in order to reduce default risk, especially for financially constrained firms. In the opposite direction, Kim, Mauer and Sherman (1998) argue that firms with difficulties in meeting their payment commitments have lower levels of liquidity and cannot accumulate cash, since they will use any liquid resources available to pay what they owe. Moreover, growing firms may also incur greater costs in financial distress because their value depends on their growth opportunities rather than on tangible assets or specific cash flows (Harris and Raviv 1990; Shleifer and Vishny 1992). In addition, Faulkender and Petersen (2006) sustained that low credit ratings (or the absence of them) is an indicator of financial constraints. Therefore, based on the trade-off theory this study contends that:
11
3.6. Firm Size
Firm size is an important determinant of cash holdings, but the expected relationship is ambiguous (e.g., Drobetz and Grüninger 2007; Niskanen and Niskanen 2007). Firm size may be related to potential agency problems, analyst coverage, and monitoring by the market for corporate control. Since there are substantial fixed costs of acquiring outside financing as well as economies of scale in cash management, both mature and larger companies are expected to get financing in an easier and cheaper way (Dittmar, Mahrt-Smith and Servaes 2003). In addition, Almeida, Campello
and Weisbach (2004) and Faulkender and Wang (2006) argue that large firms have easier access to
capital markets relative to small firms; hence they face fewer financial constraints. Moreover, because large companies tend to be more diversified (Rajan and Zingales 1995), raising cash by selling non-core assets in periods of financial distress should be easier for these firms (Lang, Poulsen
and Stulz 1995). In addition, large and more diversified firms are prone to less bankruptcy related
costs, and hence less likely to stockpile cash reserves (Al-Najjar and Belghitar 2011). Thus, in accordance with the trade-off theory:
H6: Cash holdings are negatively related to firm size.
3.7. Age
Older firms should have a longer history of capital market transactions as well as successful operations which should, all else equal, give them a better reputation and an improvement in the amount of information the markets have about such firms. Thus, older firms have a lesser degree of information asymmetry, relative to their no-longer-existing counterparts, therefore they are able to better obtain their optimal cash position and continued investments, which allowed them to survive (e.g., Faulkender 2002). Therefore, in agreement with the financial hierarchy theory:
12
4. Sample, variables’ definition and
method
4.1. Sample
Initial public offering data (IPOs) are from Universoft – Spin - Off Dell Universita Degli Studi di Bergamo. The initial sample comprises 295 French IPOs over the period 1995 – 2007. Financial data were obtained from AMADEUS, a private database provided by Bureau van Dijk (BVD). This database includes standardised annual accounts (consolidated and unconsolidated) of European companies. We chose 2000 as the beginning date because before this year the financial data is scarce. After exclude financial and utility firms, as their cash holdings can be subject to some form of regulatory supervision, and eliminating companies with high levels of missing and inconsistent data (e.g., total assets different from total shareholders’ capital plus liabilities), we obtained a final sample of 231 listed firms in Euronext Paris (1,848 firm-year observations), for which data for at least three years are available.
4.2. Variables
Dependent endogenous variable
The dependent variable represents corporate cash holdings, which is the ratio of cash and cash equivalents dived by total assets (net of cash), as in D’Mello, Krishnaswami and Larkin (2008); Harford, Mansi and Maxwell (2008); Kuan, Li and Chu (2011); Kusnadi (2011) and Opler, Pinkowitz, Stulz and Williamson (1999).
Independent Variables
Because differences between firms within a country are largely attributable to fundamental firm characteristics (Opler, Pinkowitz, Stulz and Williamson 1999), this study employs them as independent variables. Hence, the study measures growth opportunities (H1) as the ratio of intangible fixed assets to sales (e.g., D’Mello, Krishnaswami and Larkin 2008). The company’s leverage (H2) is the ratio of ratio of long term debt to noncurrent liabilities, as in D’Mello,
Krishnaswami and Larkin (2008). The financing deficit is proxied by the cash flow (H3), calculated
as the ratio of earnings before interest and taxes and interest (EBIT) to total assets net of cash, as in Kuan, Li and Chu (2011), Opler, Pinkowitz, Stulz and Williamson (1999) and Ozkan and Ozkan
13
(2004). Net working capital (H4) is the ratio of current assets net of cash holdings minus current liabilities to total assets (net of cash holdings), and proxy for the level of liquid assets that firms hold (e.g., Bao, Chan and Zhang 2012; D’Mello, Krishnaswami and Larkin 2008; Kuan, Li and Chu 2011). A company’s credit rating (H5) represents its financial risk. Thus, this study defines three dummies variables: low, medium and high risk which are dummy variables that takes the value of one if the financial risk of the company is low (i.e., credit rating - A, AA and BBB), medium (i.e., credit rating B, BB and CCC) and high risk (i.e., credit rating C, CC and D), 0 otherwise (e.g.,
Faulkender and Petersen 2006). Firm size (H6) is the natural logarithm of total assets, as in Chen
and Chuang (2009) and Kuan, Li and Liu (2012). The age (H7) is the time between company’s
founding date and measurement year. Because the macroeconomic and industry uncertainties are found to have an influence on companies’ cash holdings (e.g., Baum et al. 2006 a, b), the study also includes year and industry dummy variables. Industries in our sample aggregate companies with the same NACE code at the two digit level code. The statistic classification of economic activities in the European Community is referred to as NACE - Nomenclature statistique des activitités économiques
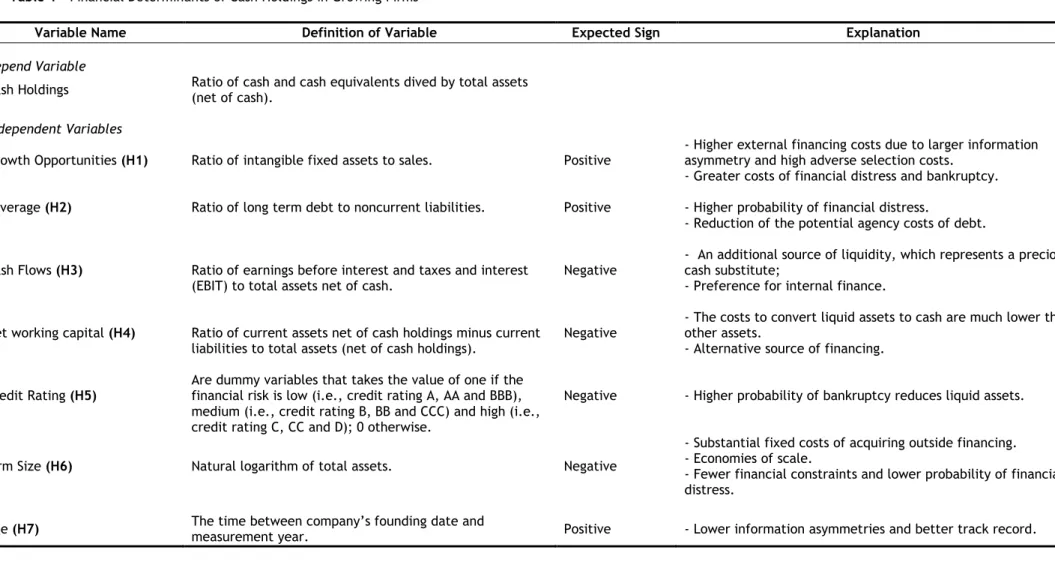
dans la Communauté Européenne. Table 1 summarizes the main explanatory determinants of cash
14
Table 1 - Financial Determinants of Cash Holdings in Growing FirmsVariable Name Definition of Variable Expected Sign Explanation
Depend Variable
Cash Holdings Ratio of cash and cash equivalents dived by total assets (net of cash).
Independent Variables
Growth Opportunities (H1) Ratio of intangible fixed assets to sales. Positive
- Higher external financing costs due to larger information asymmetry and high adverse selection costs.
- Greater costs of financial distress and bankruptcy. Leverage (H2) Ratio of long term debt to noncurrent liabilities. Positive - Higher probability of financial distress.
- Reduction of the potential agency costs of debt. Cash Flows (H3) Ratio of earnings before interest and taxes and interest
(EBIT) to total assets net of cash.
Negative
- An additional source of liquidity, which represents a precious cash substitute;
- Preference for internal finance. Net working capital (H4) Ratio of current assets net of cash holdings minus current
liabilities to total assets (net of cash holdings). Negative
- The costs to convert liquid assets to cash are much lower than other assets.
- Alternative source of financing. Credit Rating (H5) Are dummy variables that takes the value of one if the financial risk is low (i.e., credit rating A, AA and BBB),
medium (i.e., credit rating B, BB and CCC) and high (i.e., credit rating C, CC and D); 0 otherwise.
Negative - Higher probability of bankruptcy reduces liquid assets.
Firm Size (H6) Natural logarithm of total assets. Negative
- Substantial fixed costs of acquiring outside financing. - Economies of scale.
- Fewer financial constraints and lower probability of financial distress.
15
4.3. Method
This study examines the determinants of cash holdings policy in the context of French growing firms over the period 2000 to 2007. The study allows cash holdings to not adjust immediately to changes in the cash holdings’ explanatory variables. That is, the study allows for some sort of adjustment process to take place, justified by the existence of transaction and adjustment costs. Thus, and following Ozkan and Ozkan (2004), this study assumes each i company has an optimal level of cash level at year t, function of the above mentioned explanatory variables Xk, and an error term µ, that is:
If companies do not adjust immediately to their optimal cash levels, the difference between the actual cash and its previous year’s level is given by a proportion of the difference between optimal cash and the previous year’s cash holdings (e.g., Ozkan and Ozkan 2004). Accordingly,
Where γ represents proportion of the adjustment required to reach the optimal level, ranging between 0 and 1. If γ takes a value of 1 there are not adjustment costs and the firms adjust their cash levels immediately. In contrast, if γ takes a value of 0 this indicates that there are so high adjustment costs that it is wasteful for the firm to modify its cash level.
Since we have continuous data for 8 years sample period for the most of the observations, the study model the cash behavior getting estimates from a dynamic panel data model, as follows:
it
=
0+
1it-1
+
2it
+
3it
+
4it
+
5it
+
6it
+
7it
+
8it
+
i+
t+
itWhere, δ0= αγ, δ0= 1-γ, δk=γβk, εit=γµit, i=1,…, N and t=1…, T.
The model (3) results from substituting Eq. (1) into Eq. (2) and by addition i which are unobservable time-invariant characteristics of each firm, which could affect the level of cash holdings, and t the year dummy variables reflecting macroeconomic variables that are common to all firms in a given year and could affect their level of cash holdings.
(1)
(2)
16
Because the lagged dependent variable is included as an independent variable in the adjustment model (3), the variable CASHit-1 is correlated with i that do not vary through time, therefore OLS parameters will be inconsistent. Another source of bias may arise from possible endogeneity problems if shocks that affect companies’ cash holdings also affect some of the regressors, as could happen with risk, liquidity, leverage and growth opportunities. For these reasons the study uses dynamic estimators. The advantages from this method are: i) elimination of the companies’ non-observable individual effects; ii) great control of collinearity between explanatory variables; iii) great control of potential endogeneity problems and iv) determination of the level of adjustment in the level of actual cash (e.g., Guney, Ozkan and Ozkan 2003; Ozkan and
Ozkan 2004).
To estimate equation (3), Arellano and Bond (1991) suggest to use variables in first differences using cash holdings lags and their antecedent levels as instruments to create orthogonal conditions between εit and Cash Holdingsi,t-1, thus eliminating correlation. When the dependent variable is persistent, that is, the correlation between its current and previous period values are high, but the number of periods is not high, Blundell and Bond (1998) show that Arellano and Bond’s
(1991) estimators are inefficient. Therefore, they extend these estimators by considering a system
with variables at levels and in first differences. Accordingly, in equation (3) for variables at levels, the instruments are the lagged variables in first differences. For variables in first differences, the instruments are the variables at levels. This study employs the two-step system generalized method of moments (GMM) (Blundell and Bond 1998) dynamic estimators using all the right-hand side variables lagged from t2 to t4 as instruments in equation (3) in first differences. However, the system GMM dynamic estimators can only be considered valid if (1) the restrictions created and consequences of instruments used are valid and (2) there is no second-order serial correlation. Accordingly, we report the Hansen test for the legitimacy of variables dated t2 and t4 as instruments in equation (3). Under the null of instrument validity, the Hansen test for over-identifying restrictions is asymptotically distributed as chi-square with degrees of freedom equal to the number of instruments less the number of parameters. We report both the first-order (m1) and the second-order (m2) test for serial correlation, which are asymptotically distributed as a standard normal under the null of no serial correlation of the residuals.
17
5. Results
5.1. Univariate analysis
Table 2 presents the descriptive statistics of the variables used in this study. To conserve space, the statistics for control variables are not reported, that is, for year and industry dummies variables. The mean of variable cash holdings for French IPOs firms is 31% of total net assets, which is similar to Chen and Chuang (2009), who found an average cash ratio of 34.6% of total assets for US high-tech firms over the period 1997-2003. These result contrasts with the average values reported by Ozkan and Ozkan (2004) for UK listed firms (9.9%), Kim, Mauer and Sherman (1998) for US public firms (8.1%), Dittmar, Mahrt-Smith and Servaes (2003) (11.1%) and Ramírez and Tadesse (2009) (15%) for French firms in an the international sample. The median value of cash holdings correspond to 12% of total net assets which is also greater comparing with others empirical studies (e.g., Ozkan and Ozkan (2004) - UK listed firms, Ferreira and Vilela (2004) - EMU listed firms, and
Bigelli and Sánchez-Vidal (2012) for Italian private firms, where median values are 5.9%, 9.1% and
3.3%, respectively). Thus, these results show that growing firms hold more cash comparing with traditional and mature firms.
18
Table 2 - Descriptive statisticsVARIABLES (N=231) Obs. Mean Std. Dev. Min. 25th perc Median 75th perc Max.
Dependent Variable Cash Holdings 1503 0.31 0.69 -1.10 0.05 0.12 0.29 9.34 Independent Variables Growth Opportunities (H1) 1507 0.25 0.61 0.00 0.02 0.09 0.24 10.31 Leverage (H2) 1455 0.52 0.87 -0.33 0.00 0.62 0.85 30.29 Cash Flows (H3) 1445 0.04 0.54 -15.74 0.03 0.08 0.15 1.31 Net Working Capital (H4) 1503 0.02 0.40 -10.98 -0.11 0.05 0.21 0.68
Credit Rating (H5) Low Risk 1459 0.38 0.49 0.00 0.00 0.00 1.00 1.00 Medium Risk 1458 0.55 0.50 0.00 0.00 1.00 1.00 1.00 High Risk 1459 0.07 0.25 0.00 0.00 0.00 0.00 1.00 Firm Size (H6) 1509 10.78 2.00 0.69 9.51 10.58 11.92 19.04 Age (H7) 1688 16.04 16.72 -5.00 7.00 12.00 19.00 102.00
19
Looking at financial variables, sample firms have a high level of growth opportunities with a mean (median) of 25% (9%). Chen and Chuang (2009) report a mean value of 35%. Table 2 also exhibits that the mean (median) value of total assets (logarithm) is 10.78 (10.58) and firms have mean (median) leverage of 52% (62%). Additionally, the sample reveals that mean (median) of cash substitutes measured by net working capital is 2% (5%) of total assets and firms have a mean (median) cash flow of 4% (8%). Moreover, the two last statistics shows that the French firms are relatively young since they have a mean (median) of 16 (12) years and that growing firms are differentiated by their level of risk, since 38%, 55% and 7% of these firms have a low risk (i.e., credit rating is A, AA and BBB), medium risk (credit rating is B, BB and CCC), and high risk (credit rating is C, CC and D), respectively. Appendix 1 reports the correlation matrix. Because the correlation values of explanatory variables in the sample are below of 0.5, the multicolinearity was not a concern. This feature is confirmed by a mean of the variance inflation factor (VIF) of 1.09 across the independent variables.
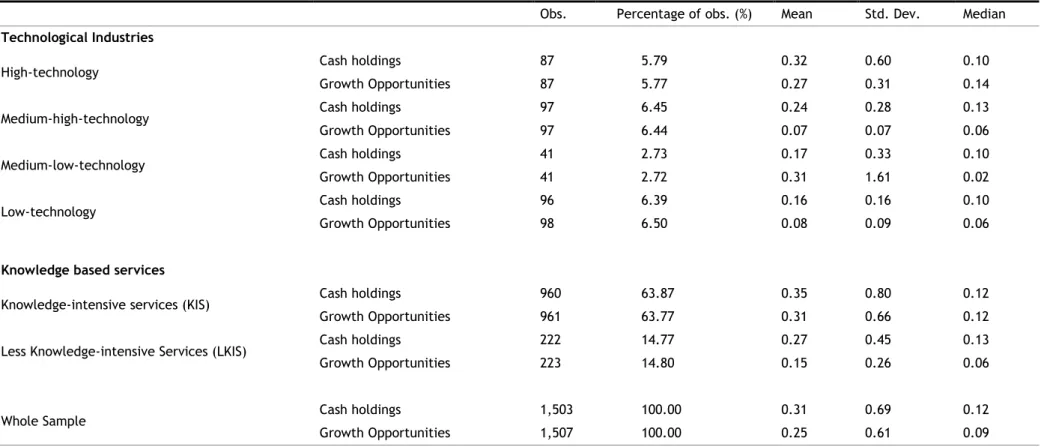
Following Eurostat1, table 3 shows the mean and median values of cash holdings and growth opportunities of sample firms by technological industries and knowledge-based services. Accordingly, the technological industry comprises high-technology firms (i.e., NACE codes: 30 - manufacture of office machinery and computers; 32 - manufacture of radio, television and communication equipment and apparatus; 33 - manufacture of medical, precision and optical instruments, watches and clocks and 24.4 - manufacture of pharmaceuticals, medicinal chemicals and botanical products), medium high-technology firms (i.e., NACE codes: 24 - manufacture of chemicals and chemical products; 29 - manufacture of machinery and equipment n.e.c.; 31 - manufacture of electrical machinery and apparatus n.e.c; 34 - manufacture of motor vehicles, trailers and semi-trailers; 40 - electricity, gas, steam and hot water supply, and 45 – construction), medium-low-technology firms (i.e., NACE codes: 13 - mining of metal ores; 26 - manufacture of other non-metallic mineral products; and 28 - manufacture of fabricated metal products, except machinery and equipment) and low-technology firms (i.e., NACE codes: 15 to 22 – manufacture of food products, beverages and tobacco; textiles and textile products; leather and leather products; wood and wood products; pulp, paper and paper products, publishing and printing; and 36 - manufacturing n.e.c.). The knowledge-based services includes knowledge-intensive services (i.e., NACE codes 64, 65, 67, 70, 72, 73, 74, 80, 85 and 92 which represent the post and telecommunications, financial intermediation, real estate, renting and business activities, education, health and social work, and recreational, cultural and sporting activities), and less knowledge-intensive services (i.e., NACE codes 50, 51, 52, 55, 60 and 63 which involve motor trade, hotels and restaurants, land transport, transport via pipelines, and supporting and auxiliary transport activities, activities of travel agencies).
20
Table 3 - Cash Holdings and Growth Opportunities by technological industries and knowledge based servicesObs. Percentage of obs. (%) Mean Std. Dev. Median
Technological Industries
High-technology Cash holdings 87 5.79 0.32 0.60 0.10
Growth Opportunities 87 5.77 0.27 0.31 0.14 Medium-high-technology Cash holdings 97 6.45 0.24 0.28 0.13 Growth Opportunities 97 6.44 0.07 0.07 0.06 Medium-low-technology Cash holdings 41 2.73 0.17 0.33 0.10 Growth Opportunities 41 2.72 0.31 1.61 0.02
Low-technology Cash holdings 96 6.39 0.16 0.16 0.10
Growth Opportunities 98 6.50 0.08 0.09 0.06
Knowledge based services
Knowledge-intensive services (KIS) Cash holdings 960 63.87 0.35 0.80 0.12 Growth Opportunities 961 63.77 0.31 0.66 0.12 Less Knowledge-intensive Services (LKIS) Cash holdings 222 14.77 0.27 0.45 0.13 Growth Opportunities 223 14.80 0.15 0.26 0.06
Whole Sample Cash holdings 1,503 100.00 0.31 0.69 0.12 Growth Opportunities 1,507 100.00 0.25 0.61 0.09
This table presents the mean and median values of cash holdings, defined as the ratio of cash and cash equivalents dived by total assets (net of cash), and growth opportunities defined as the ratio of intangible fixed assets to sales by industry and service over the period 2000-2007.
21
In line with Chen and Chuang (2009), the results suggest that firms which belong to high-technology industries hold more cash holdings and growth opportunities comparing with their counterparts. The cash holdings variable for these firms presents a mean (median) 32% (10%) of total net assets, and growth opportunities reports a mean (median) value of 27% (14%). The exception is the firms belong to the medium-low-technology which report a higher mean value for growth opportunities (31%) comparing to medium-high-technology (7%) and low-technology firms (8%). Although, the median value is only 2% for medium-high-technology firms and for low-technology firms the median value is 6%, reporting this variable a higher standard deviation. Also, firms characterized by knowledge intensive services accumulate more cash (where the mean and median values are 35% and 12%, respectively) and growth opportunities (with mean and median values of 31% and 12%, correspondingly) than firms with less knowledge intensive services, which achieves a mean (median) value of 27% (13%) for the cash holdings variable and a mean (median) value of 15% (6%) for growth opportunities. These findings suggest that the cash levels of French IPO firms increase (decrease) as the level of growth opportunities increase (decrease).
5.2. Multivariate analysis
5.2.1 Determinants of cash holdings: full sample
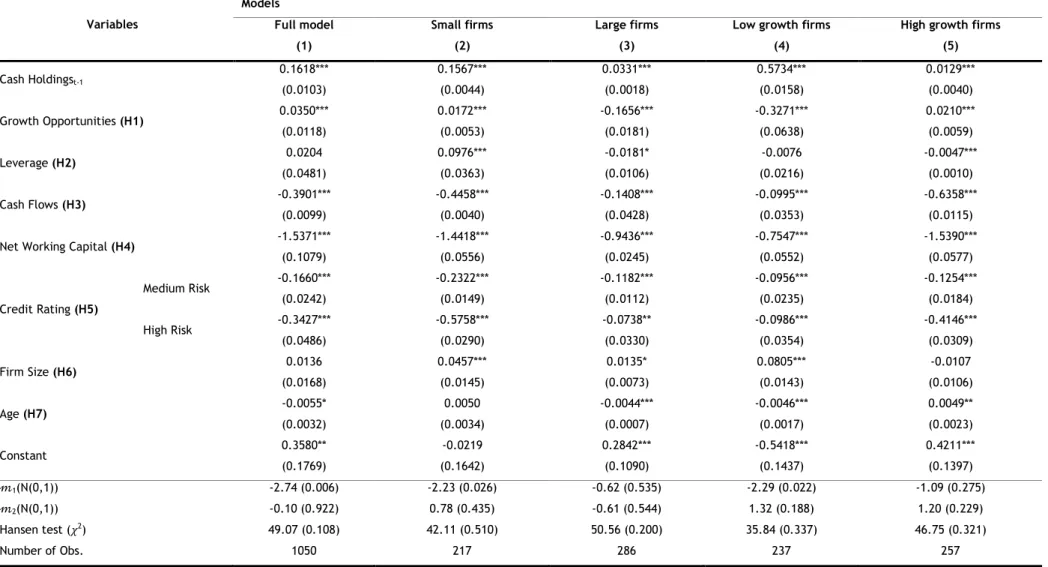
Table 4 presents the GMM regressions on the determinants of cash holdings. To obtain all the estimations, the study employs the two-stage GMM estimator.
Which uses the residuals on the one-stage estimation to construct an asymptotically weighted optimum matrix and it is more efficient than the one stage if we assume that perturbances will show heteroskedasticity for sample data such as ours (Blundell and Bond 1998). All independent variables except the dummies variables (i.e., credit rating, year and industry dummies variables) are assumed as endogenous. This procedure is justified because many variables are built from financial statements presented by the firms, thus it is difficult to regard them as exogenous (e.g., Kremp, Stöhs and Gerdesmeier 1999). In addition, the random disturbances that affect decisions about cash holdings can also influence firm characteristics such as growth opportunities (Guney, Ozkan and Ozkan 2003). Model 1 presents the estimations for the full sample, while the model 2 and 3 show the estimations for small and large firms defined as those in the 25th and 75th percentile for the variable size (natural logarithm of total assets). Model 4 and 5 report the results for the subsamples low growth firms (those in the 25th percentile for the variable growth opportunities) and high growth firms (those in the 75th percentile for the variable growth opportunities). The models includes year and industry dummies variables but their results are not reported for brevity. The estimations are consistent due: i) the absence of any second-order serial correlation in all models and ii) the acceptance of the null hypothesis of Hansen test, which
22
confirms that instruments used are valid and there is not any correlation between the instruments and the error term.
23
Table 4 - GMM cash holdings regressions: dynamic panel data estimation resultsVariables Models Full model (1) Small firms (2) Large firms (3)
Low growth firms (4)
High growth firms (5) Cash Holdingst-1 0.1618*** (0.0103) 0.1567*** (0.0044) 0.0331*** (0.0018) 0.5734*** (0.0158) 0.0129*** (0.0040) Growth Opportunities (H1) 0.0350*** (0.0118) 0.0172*** (0.0053) -0.1656*** (0.0181) -0.3271*** (0.0638) 0.0210*** (0.0059) Leverage (H2) 0.0204 (0.0481) 0.0976*** (0.0363) -0.0181* (0.0106) -0.0076 (0.0216) -0.0047*** (0.0010) Cash Flows (H3) -0.3901*** (0.0099) -0.4458*** (0.0040) -0.1408*** (0.0428) -0.0995*** (0.0353) -0.6358*** (0.0115)
Net Working Capital (H4) -1.5371***
(0.1079) -1.4418*** (0.0556) -0.9436*** (0.0245) -0.7547*** (0.0552) -1.5390*** (0.0577) Credit Rating (H5) Medium Risk -0.1660*** (0.0242) -0.2322*** (0.0149) -0.1182*** (0.0112) -0.0956*** (0.0235) -0.1254*** (0.0184) High Risk -0.3427*** (0.0486) -0.5758*** (0.0290) -0.0738** (0.0330) -0.0986*** (0.0354) -0.4146*** (0.0309) Firm Size (H6) 0.0136 (0.0168) 0.0457*** (0.0145) 0.0135* (0.0073) 0.0805*** (0.0143) -0.0107 (0.0106) Age (H7) -0.0055* (0.0032) 0.0050 (0.0034) -0.0044*** (0.0007) -0.0046*** (0.0017) 0.0049** (0.0023) Constant 0.3580** (0.1769) -0.0219 (0.1642) 0.2842*** (0.1090) -0.5418*** (0.1437) 0.4211*** (0.1397) 1(N(0,1)) -2.74 (0.006) -2.23 (0.026) -0.62 (0.535) -2.29 (0.022) -1.09 (0.275) 2(N(0,1)) -0.10 (0.922) 0.78 (0.435) -0.61 (0.544) 1.32 (0.188) 1.20 (0.229) Hansen test ( 2) 49.07 (0.108) 42.11 (0.510) 50.56 (0.200) 35.84 (0.337) 46.75 (0.321) Number of Obs. 1050 217 286 237 257
Notes: This table reports System GMM regressions predicting cash holdings. The sample period is 2000-2007 in all regressions although the available number of observations for
each company changes across firms. Model 1 reports the two-stage system GMM regression for the full sample. Model 2 and 3 present the estimations for subsamples small and large firms, respectively. Models 4 and 5 show the results for the subsample high and low growing firms. Variable definitions appear in table 1. Standard errors are reported in parentheses. This study also includes year and industry dummies variables but their results are not reported for brevity. m1and m2are test statistics for first and second order autocorrelations in residuals, respectively, distributed as standard normal N (0,1) under the null of no serial correlation. The Hansen test for overidentifying restrictions is asymptotically distributed as Chi-square under the null of instrument validity. ***, ** and * indicates significance at 1% level, 5% level and 10% level, respectively.
24
In the full model, the lagged dependent variable presents a positive and statistically significant coefficient at 1% level (0.1618), which proves the dynamic behavior of cash decisions in growing firms. This result confirms that growing firms follow an optimal level of cash holdings by trading off the marginal cost of holding cash with its marginal benefit (e.g., Ozkan and Ozkan 2004). In addition, the results show that the adjustment coefficient, given by (1-δ0) is approximately 0.84, comparing with the studies of Drobetz and Grüninger (2007) (the adjustment coefficient ranges between 0.35 and 0.50) and Ozkan and Ozkan (2004) (the adjustment coefficient is roughly 0.60). This higher adjustment speed suggests that French IPOs firms adjust more quickly their cash levels to the target level. As suggested by Ozkan and Ozkan (2004), a higher adjustment coefficient could be synonymous of a more expensive adjustment process due to more severe information asymmetries, higher financial constraints and financial distress which characterizes the firms with lot growth opportunities whose value depends fundamentally from intangible assets.
The trade-off theory assumptions found empirical support in most of expected relationships between the financial determinants and cash holdings in French IPOs firms. One of most important relations is given by positive and statistically significant coefficient at 1% level coefficient (0.0350) between the growth opportunities and cash holdings. This finding supports H1, that is, firms with more valuable growth opportunities accumulate higher cash ratios to mitigate the possibility of having to forego good investment opportunities. In addition, and in line with Chen and Chuang (2009), Opler, Pinkowitz, Stulz and Williamson (1999) and Ozkan and Ozkan (2004), more growth opportunities seem to result in less information transparency, which suggest that these firms have superior marginal benefit to allocating cash.
The positive coefficient of the variable leverage (0.0204) partially supports the H2, which suggests that the highly leverage growing firms hold more cash in order to avoid financial distress costs or because they have worse access to debt market. Hence, these firms have high cash balances to keep potential opportunities alive. Regarding the variable cash flow, the negative and statistically significant coefficient at 1% level (-0.3901) confirms the H3. This result supports directly the trade-off theory and indirectly the financial hierarchy theory by showing that growing firms which are able to generate more cash flows hold less cash. Therefore, in line with Kim, Mauer
and Sherman (1998), the French IPOs firms consider the cash flows as a substitute of cash; hence
this supplementary source of liquidity allows them to finance their positive net present value projects. Furthermore, the model 1 shows that the sign and significance of net working capital variable support the negative relation with cash holdings (H4), where the coefficient (-1.5371) is statistically significant at 1% level. This result indicates that if firm has liquid assets which can easier and cheaper convert to cash in time of financial distress or in presence of cash shortfall, they allocate lower cash levels. Therefore, the non-cash liquid assets reflect a precious cash substitute (e.g. Bigelli and Sánchez-Vidal 2012 - Italian private firms; Dittmar, Mahrt-Smith and Servaes 2003 – International sample and Ozkan and Ozkan 2004 - UK publicly traded firms).
25
The empirical support to the trade-off theory is also given by the variables of credit ratings which are proxies to firms’ probability of financial distress. The coefficient for the variables medium risk (-0.1660) and high risk (-0.3427) are both negative and statistically significant at 1% level, which support the H5. Thus, in line with results reported by Kim, Mauer and Sherman (1998), growing firms with low credit rating have lower levels of cash because they have used all the liquid resources to pay their payment commitments. Furthermore, low credit rating indicates more financial constraints (e.g., Faulkender and Petersen 2006).
The positive but not significant coefficient (0.0136) of the variable size rejects the H6. This result in opposition to Deloof (2001) for Belgium firms, Drobetz and Grüninger (2007) for Swiss non financial firms and Opler, Pinkowitz, Stulz and Williamson (1999) for US firms, suggest that large growing firms allocate more cash in order to keep the level and the value of their operations and investment actions.
Regarding the variable age, the negative and significant at 10% level coefficient (-0.0055) does not supports the H7. Hence, this finding suggests that older firms have a higher number of transactions in financial markets and successful activities which mitigate the information asymmetry between firms and investors allowing them to have better access to external financing and then lower benefit of holding cash. Overall, most of the results support the trade-off theory indicating that decision of the cash allocation in growing firms is mainly explained by market imperfections.
5.2.2. Determinants of cash holdings: small versus large growing firms
Results from table 4 from Model 1 show that growing firms have greater incentives to keep higher cash ratios to avoid underinvestment (e.g., Myers 1977). Because in model 1 the variable size does not report conclusive results, this study examines the financial determinants on cash decisions in small growing firms subsample (i.e., those in the 25 percentile of the variable size) and large growing firms subsample (i.e., those in the 75 percentile of the variable size). Model 2 and 3 from table 4 show the results.
In relation to small growing firms, the positive and statistically significant coefficient (0.1567) at 1% level of lagged dependent variable - Cash Holdingst-1, confirms the conclusions related to the full model. The value of adjustment coefficient for this subsample is similar to those in the full sample (i.e., roughly 84%). Regarding the subsample of large growing firms, the lagged cash holdings variable shows also a positive and statistically significant coefficient (0.0331 - at 1% level), which represents an adjustment coefficient of 97%, substantially great than for small growing firms. This finding suggests that large growing firms adjust their cash levels more quickly to their optimal cash ratio than the small ones. This result could be due because large firms have lower informational opacity than small counterparts, hence they face lower transactions costs when raising capital.