Abstract
In this paper, we assess and map the risk that atmospheric nitrogen (atN) pollution poses to biodiversity in Natura 2000 sites in mainland Portugal. We first review the ecological impacts of atN pollution on terrestrial ecosystems, focusing on the biodiversity of Natura 2000 sites. These nature protection sites, especially those located within the Mediterranean Basin, are under-characterized regarding the risk posed by atN pollution. We focus on ammonia (NH ) because this N form is mostly associated with agriculture, which co-occurs at or in the immediate vicinity of most areas of conservation interest in Portugal. We produce a risk map integrating NH emissions and the susceptibility of Natura 2000 sites to atN pollution, ranking habitat sensitivity to atN pollution using expert knowledge from a panel of Portuguese ecological and habitat experts. Peats, mires, bogs, and similar acidic and oligotrophic habitats within Natura 2000 sites (most located in the northern mountains) were assessed to have the highest relative risk of biodiversity change due to atN pollution, whereas Natura 2000 sites in the Atlantic and Mediterranean climate zone (coastal, tidal, and scrubland habitats) were deemed the least sensitive. Overall, results allowed us to rank all Natura 2000 sites in mainland Portugal in order of evaluated risk posed by atN pollution. The approach is of great relevance for stakeholders in different countries to help prioritize site protection and to define research priorities. This is especially relevant in countries with a lack of expertise to assess the impacts of nitrogen on biodiversity and can represent an important step up from current knowledge in such countries.
Citation: Pinho P, Dias T, Cordovil CMdS, Dragosits U, Dise NB, Sutton MA, et al. (2018) Mapping Portuguese Natura 2000
sites in risk of biodiversity change caused by atmospheric nitrogen pollution. PLoS ONE 13(6): e0198955. https://doi.org /10.1371/journal.pone.0198955
Editor: Julian Aherne, Trent University, CANADA
Received: November 25, 2017; Accepted: May 28, 2018; Published: June 21, 2018
Copyright: © 2018 Pinho et al. This is an open access article distributed under the terms of the Creative Commons
Attribution License, which permits unrestricted use, distribution, and reproduction in any medium, provided the original author and source are credited.
Data Availability: All relevant data are within the paper and its Supporting Information files.
Funding: We are grateful for the funding through the project ‘NitroPortugal: Strengthening Portuguese research and
innovation capacities in the field of excess reactive nitrogen’, funded by EU H2020-TWINN-2015 692331 and Fundação para a Ciência e Tecnologia (FCT) through the Post-Doctoral grants SFRH/BPD/75425/2010 to Pedro Pinho and SFRH/BPD /85419/2012 to Teresa Dias, and Investigador FCT contract to Cristina Branquinho.
Competing interests: The authors have declared that no competing interests exist.
Introduction
Atmospheric N pollution
Nitrogen (N) pollution is a major environmental challenge [1, 2]. Without the use of N-containing fertilizers, the human population would have been approximately half of its current size [1], but 50–75% of the N applied in agriculture is not taken up by crops. This excess is lost to the environment, affecting human health, air, water, soil, climate, and ecosystems’ stability and biodiversity. In Europe alone, this represents an estimated societal cost of 70–320 billion Euros per year [3]. Humankind’s intervention in the N cycle is considered to have already crossed the Earth’s ecological safety boundary, thus threatening our own security [2]. However, the demand for more food and energy due to increasing population and changing consumption patterns hampers the efforts of reducing N emissions [1].
Most of the observed increase in deposited N take two main forms: reduced N (NH : NH and NH ), primarily from volatilized agricultural emissions, and oxidized N (NO : nitric acid, particulate nitrate, etc.), primarily from fossil fuel combustion. These different N forms can be deposited by both dry and wet deposition, in proportions that depend on their relative concentrations, precipitation patterns, and environmental drivers of biosphere-atmosphere exchange [4, 5]. Although an approximately 50% decrease in European NO deposition has been achieved since the 1980s, progress in reducing NH deposition has been much slower. This is especially true for the Iberian Peninsula, which has become a significant meat-exporting region [6, 7], an activity that releases high levels of reduced nitrogen through excrement and fertilizer used to produce animal feed. The ongoing revision of the EU National Emissions Ceilings Directive [8] proposes a 69% reduction in NO emissions and 27% reduction in NH emissions by 2030 compared with a 2005 baseline. In the case of Portugal, a 71% reduction in NO emissions is proposed, but only a 16% reduction in NH [8]. Thus, NH is expected to make a proportionately larger contribution to Portuguese N deposition in the future. Published: June 21, 2018 https://doi.org/10.1371/journal.pone.0198955
Pedro Pinho , Teresa Dias , Cláudia M. d. S. Cordovil, Ulrike Dragosits, Nancy B. Dise, Mark A. Sutton, Cristina Branquinho
3 3 y 3 4+ x x y x 3 x 3 3
In a global perspective, increased food demands and more fertilizer use may further increase agricultural N use [9] and NH emissions, while a combination of increased agricultural production and climate warming may lead to a doubling of global NH emissions by 2100 [10].
Nitrogen pollution and biodiversity
Impacts of atN pollution on ecosystems and their biodiversity.
Most natural terrestrial ecosystems have evolved under a specific and often low N availability, and thus can be changed by excessive N (i.e. atN pollution), through both direct and indirect mechanisms [11]. High levels of gaseous or aerosol-borne N (usually NH ) can be directly toxic to higher plants [12, 13] and to organisms that adsorb elements directly from the environment, such as algae, lichens, or bryophytes [14, 15]. Existing atN pollution also acts indirectly on organisms through factors such as nutrient enrichment, soil or water acidification, altered nutrient ratios, or by intensifying the impact of other stressors such as pathogens, herbivory or climate change [11]. Under atN pollution, species composition changes over time and diversity often declines, as characteristic species of oligotrophic, mesotrophic or circumneutral habitats (including species of conservation interest) are out-competed by faster-growing, more nitrophytic or acid-resistant plants, many of which are ruderals or invasive [11, 16]. In general, forbs, bryophytes, lichens and oligotrophic shrubs are the main functional types negatively affected by atN pollution, while grasses, adapted to higher nutrient levels, are the main functional type to benefit.
The impacts of atN pollution on biodiversity [15, 17–19] and on species’ physiology [20, 21] are a particular problem immediately downwind of sources such as intensive livestock production. Direct foliar damage is usually due to high local concentrations of NH [11] while broader ecosystem-scale changes in soil and vegetation often result from chronically-elevated local and regional N deposition, including a combination of wet and dry deposition of NH and NO compounds [19, 22]. Within the soil, atN pollution can reduce the allocation of carbon from the vegetation to mycorrhizal fungi [23, 24] and other free-living microorganisms (e.g. other fungi, N-fixing bacteria, phosphorus solubilizers) thus impacting soil microbial communities and the ecosystem functions and services they provide (e.g. decomposition, biological N fixation). The atN pollution also impacts soil fauna [25]. N-driven changes in soil fauna and microbial communities influence the physical properties of soil, such as soil aggregation, water infiltration and organic matter turnover [26]. The impacts of atN pollution on a species or ecosystem depend on several factors [27], including the duration of exposure, total amount and form of N, species sensitivity, intrinsic ecosystem properties (e.g. fertility and acid
neutralizing capacity) and climate [11].
Overall, atN pollution threatens biodiversity globally [11, 28], but a global analysis identified northern temperate, boreal, arctic, alpine, grassland, savannah and Mediterranean biomes as being particularly sensitive to atN pollution [28]. Biodiversity loss is of special concern in biodiversity hotspots such as Mediterranean type ecosystems [29, 30], which are thought to be experiencing the greatest proportional biodiversity change [28]. Of the five global Mediterranean regions (California, central Chile, Mediterranean Basin, southern Cape region and southwestern and southern Australia), California and the Mediterranean are considered those most threatened by atN pollution [31]. In contrast to Californian ecosystems, however, those in the Mediterranean Basin are still relatively poorly studied regarding the impacts of atN pollution [11, 31, 32].
Impacts of atN pollution on European habitats, including the Natura 2000 network.
In this work, we focused on Natura 2000 areas because they host a significant portion of Europe’s biodiversity, including most of its sensitive and unique species. atN pollution constitutes a serious challenge for the conservation of such habitats and species under the Habitats Directive (92/43/EEC). The Habitats Directive, a cornerstone of Europe’s nature conservation policy, promotes the maintenance of biodiversity and requires the Member States to take measures to maintain or restore natural habitats at a favourable conservation status. The Directive established the Natura 2000 network with the aim of assuring the long-term survival of Europe’s most valuable and threatened species and habitats. These sites are afforded the highest degree of protection under European legislation: the provisions of the Directive require strict site protection measures, any avoidance of deterioration and a precautionary approach to permitting “plans or projects” which are likely to have a significant effect on a site. However, the Habitats Directive does not directly address air pollution impacts, of which N deposition and ozone are currently the most important, and until now, there has been no common European approach for determining the impacts of air pollution on individual sites or their
conservation status [33].
To protect ecosystems from atN pollution, thresholds for N have been set as critical levels (atmospheric concentration) and critical loads (deposition in ecosystems) [34]. Exceedance of critical loads for N deposition is often associated with a reduction in plant species richness in a broad range of ecosystems. Critical loads of 5–10 kg N ha yr have been defined for sensitive ecosystems [24, 35], although there is evidence that individual sensitive species may decline at levels below the critical load [36], and effects may occur over the longer-term at lower loads [11]. Combining global modelled N deposition with the spatial distribution of
protected areas under the UN Convention on Biological Diversity showed that 40% of all protected areas (or 11% of all ecosystems, by area) are projected to receive N deposition higher than 10 kg N ha yr by 2030 [37].
The Portuguese case.
The Natura 2000 network together with the national network of protected areas covers approximately 22% of the mainland Portuguese terrestrial territory. Portuguese nature conservation areas are created and managed by the national authority for nature conservation ICNF (www.icnf.pt).
Emissions of NH are distributed unevenly throughout Portugal due to the patchy location of intensive livestock farming and agriculture, which comprise 85% of the total NH emissions. Some municipalities have relatively high emission densities due to the presence of point source emissions associated with industrial activities such as intensive pig and poultry rearing (6%). Overall, there has been a downward trend in NH emissions since 1990 (-22.7%), mainly due to decreasing numbers of cattle and energy production from renewable sources [38].
Only a few studies deal with the impact of atN pollution on Portuguese ecosystems. In a Mediterranean Basin matorral habitat (http://eunis.eea.europa.eu/habitats/1699), the form and dose of available N are being manipulated in an ongoing field experiment running since 2007. The study site, located south of Lisbon (Natura 2000 site PTCON0010 Arrábida/Espichel), has low ambient N deposition (<4 kg N ha yr ) and low soil N content (0.1%). N availability is increased in three N-treatments through additions of 40 kg N ha yr as a 1:1 NH Cl to (NH ) SO mixture, and 40 and 80 kg N ha yr as NH NO . The impacts on plant composition and diversity (richness and evenness) [16, 39] and ecosystem characteristics (soil extractable N and organic matter, aboveground biomass and % of bare soil) [16, 40] and functions (decomposition, nitrification, biological N fixation) [41] are assessed. In contrast to most similar studies, plant species richness increased with enhanced N input and was more related to ammonium than to nitrate.
3 3 3 3 y x -1 -1 -1 -1 3 3 3 -1 -1 -1 -1 4 4 2 4 -1 -1 4 3
Data suggest that enhanced NH availability affects the structure of the matorral, which may promote soil erosion and N leakage, whereas enhanced NO availability leads to biomass accumulation, which may increase fire risk [16]. Based on this experiment, the first empirical critical load of N for this European habitat was set at between 20–30 kg N ha yr [35].
Sclerophyllous grazed forests (dehesas in Spain and montados in Portugal - http://eunis.eea.europa.eu/habitats/10129) have been characterized regarding their NH critical levels and N critical loads [19], including for situations in which other pollution sources co-occur with N [22]. This was done using the changes in functional diversity of one of the most sensitive components of the
ecosystem, epiphytic lichens [15]. Under atN pollution, the total plant species richness of these ecosystems did not change, but their functional diversity has undergone a complete shift from a community dominated by oligotrophic species to one dominated by nitrophytic ones [42]. This led to the establishment of a critical level for ammonia at 0.6 μgm and a critical load for N at 26 kg ha yr [19], which is within the upper range established for other semi-natural ecosystems [19].
Aim.
Taking into consideration the risk posed by N to biodiversity [43, 44], and the knowledge gaps identified for Portugal, the main objective of this work was to map the risk that atN pollution poses to changing biodiversity at Natura 2000 sites located in mainland Portugal. Because most areas with a conservation interest in Portugal occur within or in the immediate vicinity of agriculture fields, which emit mostly NH , we have focused on NH emissions and used it as a proxy for overall atN pollution. We used the most recent spatially distributed NH emission inventory available for Portugal at the municipality level together with the location of the Natura 2000 sites. Then we ranked the sensitivity of the habitats within the Habitats Directive (92) to atN pollution using expert knowledge and produced a risk map integrating both NH emissions and Natura 2000 sites’ susceptibility to atN pollution. The risk map enables prioritisation of conservation strategies within the Natura 2000 network and identification of research gaps in evaluating the impacts of atN pollution on habitat conservation. In the following section, we review the ecological impacts of N deposition within the context of the EU Natura 2000 network and in relation to Portuguese conditions. Afterwards, we describe the assessment and mapping methodologies applied, and then present and discuss the results.
Material and methods
We considered all Portuguese Natura 2000 sites where habitat information is publicly available (http://www.icnf.pt), resulting in a selection of 60 sites in mainland Portugal. Within these Natura 2000 sites, all habitats listed in Annex 1 of the Habitats Directive were considered for further analysis (88 habitats).
Only two of the habitats occurring in mainland Portugal have been studied regarding their sensitivity to atN pollution (see section 2.3). Therefore, the assessment of the sensitivity to atN pollution of the habitat types of Annex I of the Habitats Directive occurring in mainland Portugal was done by expert judgment. Seven experts were selected from professionals working in environmental companies and researchers working in biogeography, vegetation science, conservation and ecology with considerable experience of Portuguese habitats and an understanding of nitrogen pollution impacts. A higher number of experts was not possible since we required them to classify most of the habitats present in mainland Portugal, and only a restricted number of people have enough knowledge of such high number of habitats. Moreover, the impacts of nitrogen on biodiversity remain understudied in Portugal, making the choice of experts even narrower. Nevertheless, we are confident in the knowledge of the expert’s selected for this work. We are also confident that the results obtained are a major step up in current knowledge.
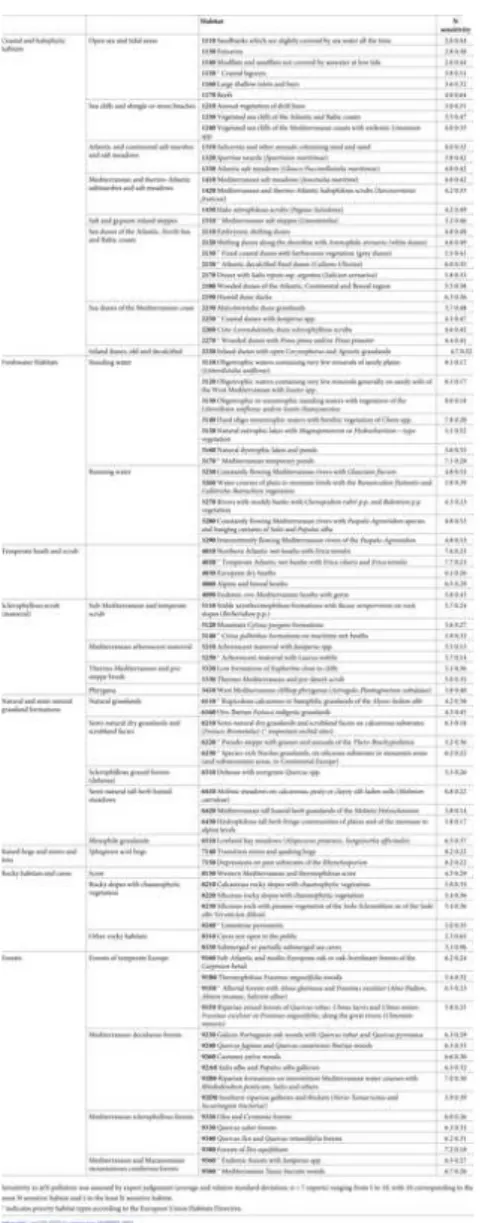
Each of the habitats in Table 1 was assessed by these experts regarding sensitivity to atN pollution on a score of 1 (least sensitive) to 10 (most sensitive). The N sensitivity of a given habitat was taken as the likelihood of biodiversity changes in response to atN pollution due to the proximity of an agricultural area. The average classification given by all experts (n = 7) was assumed as the habitat’s sensitivity to atN pollution, and the habitats were ranked accordingly. The relative standard deviations of the experts’ estimates are also shown (averaged per habitat), providing as a measure of uncertainty in the classification.
4+ x -1 -1 3 −3 −1 −1 x 3 3 3
Table 1. Sensitivity of habitats designated under the Habitats Directive (92 - http://ec.europa.eu/environment/nature/legislation/habitatsdirective) to atN pollution and occurring in mainland Portugal.
https://doi.org/10.1371/journal.pone.0198955.t001
We considered as the habitat’s susceptibility the potential adverse effects caused by atN pollution to the organisms living in each Natura 2000 Portuguese sites. Then, all Natura2000 sites were classified according to their susceptibility to atN pollution, considering the average of their habitats’ sensitivity to atN pollution.
The NH emissions reported by the Portuguese authorities (http://www.apambiente.pt/) were used as a proxy for atN pollution (including atmospheric concentrations and dry deposition of ammonia). This is feasible because NH is generally deposited close to its emission sources [45–47]. The most recent NH emission data available at the municipality level (year 2009) were spatially disaggregated to the area occupied by each Natura 2000 site. Then the average NH emissions were calculated for each Natura 2000 site.
Finally, we considered environmental risk as "the combination of the probability, or frequency, of occurrence of a defined hazard and the magnitude of the consequences of the occurrence" [48]. Combining each site’s susceptibility to atN pollution with the estimated local NH emissions enabled assessment of the relative risk of biodiversity change occurring for each Natura 2000 site, due to atN pollution. The maximum risk was defined as the combination of highest NH emissions and highest susceptibility to atN pollution; in total, nine classes of risk were defined.
Results & discussion
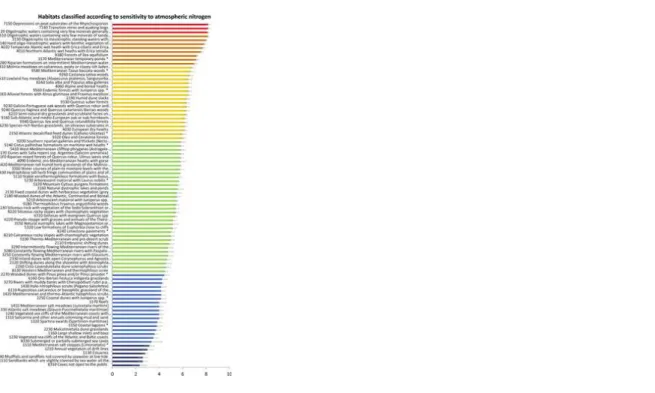
Of the 88 habitat types defined for Natura 2000 sites across mainland Portugal (Fig 1), 37 occur in the Atlantic region, 81 in the Mediterranean region and 36 in both (see S1 File). Furthermore, from the 121 plant species of Community Importance, 117 occur in the Mediterranean region, and 27 in the Atlantic region, thus making the Mediterranean region biologically ‘richer’ than the Atlantic one for conservation purposes. Table 1 shows all habitats classified according to their sensitivity to atN pollution, with average expert ranking ranging from 2.3 to 8.2 (higher values representing the most sensitive habitats). Ranking the habitats’ sensitivity to atN pollution (Fig 1) gave that the most sensitive habitats as:
i). ‘Raised bogs and mires and fens–Sphagnum acid bogs’, particularly habitat 7140—Transition mires and quaking bogs and habitat 7150—Depressions on peat substrates of the Rhynchosporion;
3 3 3 3 3 3
ii). ‘Freshwater Habitats—Standing water’, particularly habitat 3130—Oligotrophic to mesotrophic standing waters with Littorelletea uniflorae and/or Isoete Nanojuncetea, habitat 3110—Oligotrophic waters containing very few minerals of sandy plains (Littorelletalia uniflorae) and habitat 3120—Oligotrophic waters containing very few minerals generally on sandy soils of the West Mediterranean with Isoetes spp.
Fig 1. Ranking of the habitats (Habitats Directive) occurring in mainland Portugal according to their sensitivity to atmospheric Nitrogen pollution (higher values in red indicate higher sensitivity).
The bars represent the average relative standard deviation (the same as in Table 1). See full habitat names in Table 1. https://doi.org/10.1371/journal.pone.0198955.g001
The least sensitive habitats were:
i). ‘Rocky habitats and caves–Other rocky habitats’, particularly habitat 8310—Caves not open to the public;
ii). ‘Coastal and halophytic habitats—Open sea and tidal areas’, particularly habitat 1110—Sandbanks which are slightly covered by sea water all the time, habitat 1140—Mudflats and sandflats not covered by seawater at low tide and habitat 1130—Estuaries.
The most sensitive habitats were acidic and oligotrophic while the least sensitive were coastal open sea, tidal habitats and caves, which often house large bat colonies that emit large amounts of NH through the accumulation of guano in the caves.
Distributing the 88 habitats along the 60 Natura 2000 sites in which they occur enabled mapping the susceptibility to atN pollution for each site (Fig 2). The sites’ susceptibility to atN pollution ranged from 6.6 at the most susceptible site to 3.9 at the least susceptible site. Sites located inland in the northern mountains were considered to be more susceptible to atN pollution than the sites located along the coast. Sites located inland in the Mediterranean region of mainland Portugal showed intermediate scores of susceptibility to atN pollution. Examples of the Natura 2000 sites most susceptible to atN pollution included PTCON0039 (Serra de Arga), PTCON0040 (Côrno do Bico) and PTCON0025 (Montemuro), while examples of the least susceptible to atN pollution included PTCON0006 (Arquipélago da Berlenga), PTCON0058 (Ria de Alvor) and PTCON0013 (Ria Formosa/Castro Marim).
Fig 2. Map and plot of Natura 2000 sites in mainland Portugal, classified according to their susceptibility to atmospheric Nitrogen pollution. Higher values indicate higher susceptibility, on a scale from 1 to 10.
https://doi.org/10.1371/journal.pone.0198955.g002
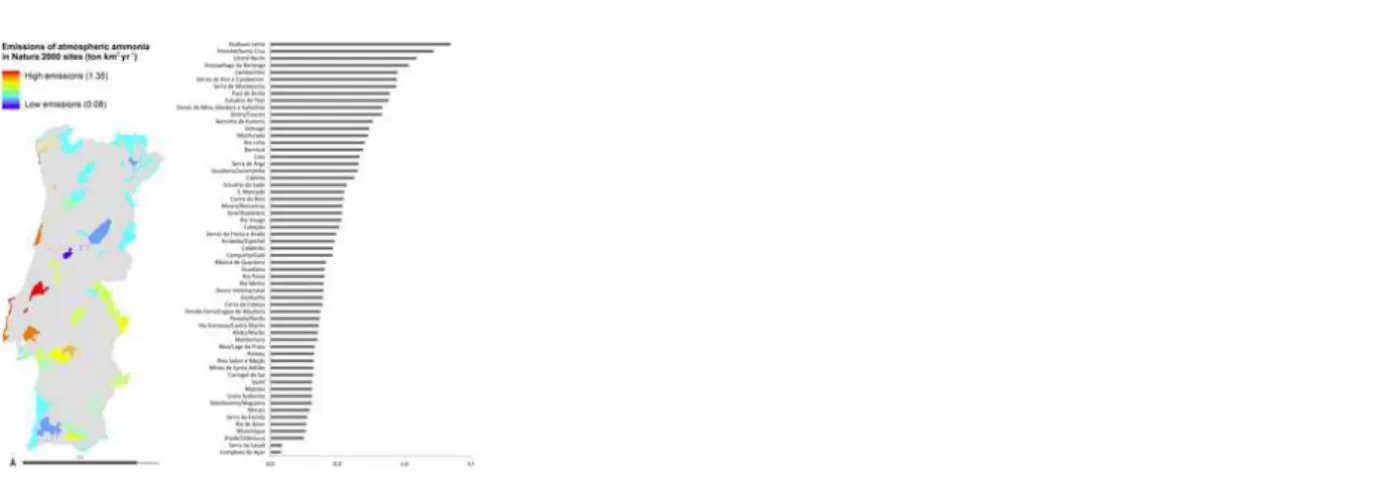
Given that the Natura 2000 network and protected areas occupy ca. 22% of the area of mainland Portugal, and that the distribution of the Portuguese population and anthropogenic activities is not uniform across the territory, several Natura 2000 sites are in close proximity to important sources of NH pollution. Such sites near intensive agricultural areas were within grid squares with the highest NH emissions (and so were assumed to have high NH concentrations), in contrast to more remote sites (Fig 3). PTCON0006 (Arquipélago da Berlenga), PTCON0017 (Litoral Norte), PTCON0056 (Peniche/Santa Cruz) and PTCON0046 (Azabuxo- Leiria) had NH emissions > 1 ton km yr while PTCON0051 (Complexo do Açor) and PTCON0060 (Serra da Lousã) had NH emissions one order of magnitude smaller (< 0.1 ton km yr ).
Fig 3. Map and plot of Natura 2000 sites in mainland Portugal, classified according to the average atmospheric ammonia emissions (2009, tonne km year ).
https://doi.org/10.1371/journal.pone.0198955.g003
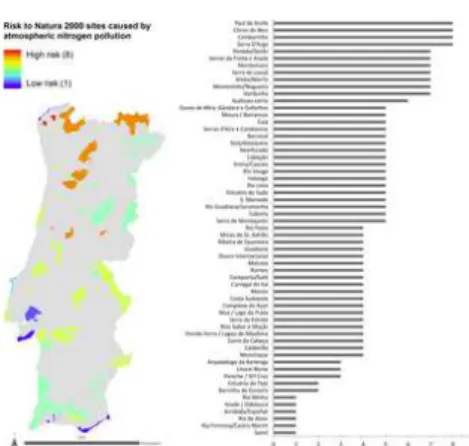
The combined analysis of the Natura 2000 sites’ susceptibility to atN pollution and NH emissions was used to calculate the relative risk of habitat change caused by atN pollution (Figs 4 and 5 and S1 File). No Natura 2000 site was found to fall into the maximum risk category (9), i.e. a combination of the highest susceptibility to atN pollution and highest NH emissions (Fig 4). Four sites were considered to be in the second-highest risk category (8): Paúl de Arzila, Côrno do Bico, Cambarinho and Serra d’Arga. The sites with the lowest risk (category 1) were Rio Minho, Arade/Odelouca, Arrábida/Espichel, Ria de Alvor, Ria Formosa/ Castro Marim and Samil. In general, the Natura 2000 sites with the lower relative risk of biodiversity change due to atN pollution were either coastal or dominated by Mediterranean evergreen species (Matorral and semi-natural grassland formations). Most coastal sites have saltmarshes, which are thought to cope relatively well with atN pollution because their naturally low aerobic conditions make ammonia the predominant N form [49]. Sites dominated by evergreen Mediterranean oaks, which dominate most of the southern part of mainland Portugal, are already adapted to some degree of disturbance, i.e. mainly low-intensity agriculture and grazing [50]. These ecosystems were shaped over millennia, and their current species pool–including those of conservation interest–reflect that long-term process, by showing a lower susceptibility to atN pollution and thus an overall lower relative risk of biodiversity change due to atN pollution.
Fig 4. Plot of Natura 2000 sites’ susceptibility to atmospheric nitrogen (atN) pollution vs. average ammonia emissions, showing the relative risk of biodiversity change due to atN pollution.
It is notable that there are no Natura 2000 sites in the highest risk category (9) of highest susceptibility to atN pollution and highest ammonia emissions, which may reflect some degree of spatial separation between agricultural activities and natural habitats. https://doi.org/10.1371/journal.pone.0198955.g004 3 3 3 3 -2 -1 3 -2 -1 -2 -1 3 3
Fig 5. Map and plot of Natura 2000 sites classified according to the relative risk of biodiversity change caused by atmospheric Nitrogen (atN) pollution.
Higher values indicate higher risk, which is caused by a combination of site’s high susceptibility to atN pollution and high emission of ammonia.
https://doi.org/10.1371/journal.pone.0198955.g005
The Natura 2000 sites located further north are dominated by deciduous Mediterranean oaks and showed higher risk of biodiversity change due to atN pollution than the southern sites. This is likely associated with granitic soil in these areas, and the presence of the most N sensitive habitat types, i.e. peatland, mires and bogs. These habitats were not shaped by low-level agricultural activities and their soil (more acidic) offer less buffering capacity to atN pollution. Although studies have shown that the species richness of bogs is less sensitive to N deposition than other oligotrophic habitats such as acid grassland or heathland [51, 52] (which are not represented in the Natura 2000 sites), this is because bog vegetation, particularly Sphagnum, can shift from pollution-sensitive species to less sensitive ones as pollution increases [52, 53], resulting in comparatively little change in species richness but a significant change in community composition.
In this study, we only mapped the Natura 2000 sites at higher relative risk of biodiversity change due to atN pollution taking NH3 as a proxy for overall atN pollution. Other forms of N could be considered, namely NOx. However, NOx is only relevant for a few sites located near large urban or industrial areas and in general, reduced N (ammonia/ammonium) has been shown to cause more negative impacts than similar doses of oxidized N [16, 54, 55]. Altogether, NH emission can be regarded as a surrogate of overall atN pollution on each site, because it is the prevailing N form emitted in the airsheds of Portuguese Natura 2000 sites. In our study, all habitats were treated as being of the same conservation value. Further studies could investigate ranking habitat value within the Ecosystem Services framework [56], by including which services would be lost or gained if a given habitat disappeared due to atN pollution. In this work we focused in atmospheric nitrogen. However, for habitats greatly influenced by running water, the main threats may come from surface runoff of nitrogen rich water. Thus, those habitats risk of change would have increased if we could consider such nitrogen source. However, that information is not available, and thus this work represents the best approach possible to those habitats susceptibility to nitrogen pollution.
This study relied on the relative classification of all Natura 2000 in mainland Portugal using expert knowledge. Thus, we stress that we obtained the relative position of sites, not an absolute valuing of their sensitivity. Moreover, this study is limited by the use of expert knowledge. However, this is currently the only approach available to define research and action priorities regarding atN pollution. The alternative option would be to establish the empirical critical loads for N of the habitats present in all Natura 2000 sites, and if those critical loads are being exceeded. However, this type of knowledge is not available for the vast majority of the Portuguese mainland ecosystem (but see [40] [41]). Thus, the use of expert knowledge is currently the only option available for this study. Although seven experts may seem a small number of replicates, we could only consider those experts with knowledge on most habitats and on N issues, and that combination of skills is not frequent. One way to take into account the uncertainty of the responses of experts is to consider the habitat classification deviation (see standard deviation values in Table 1). This deviation was not very high (average relative standard deviation average = 0.35) reflecting that experts coincided in general in their appraisal. However, some habitats presented rather conflicting evaluations, with a relative standard deviation of 0.55 or higher, namely 3160 (Natural dystrophic lakes and ponds), 1170 (Reefs), 8310 (Caves not open to the public) and 8330 (Submerged or partially submerged sea caves). Among the other habitats with high deviation, we found mostly marine and aquatic habitats, which probably reflect the poorer knowledge available for those habitat types.
Conclusions
In this study, we combined mainland Portuguese NH emission estimates with an expert-based classification of Natura 2000 habitats’ sensitivity to atN pollution. This allowed us to calculate and map the relative risk of biodiversity change in Natura 2000 sites due to atN pollution. Results identified mountain habitats with mires, fens and bogs as the most sensitive to atN pollution, while coastal salt marshes were considered the least sensitive. By combining habitat sensitivity with local NH emissions, we identified the Natura 2000 sites in mainland Portugal that are at higher relative risk of biodiversity change due to atN pollution: these are mostly located in the northern mountains, close to areas with agricultural activities of moderate intensity.
This ranking approach can be used to prioritize conservation efforts to those sites most at risk. The most sensitive Portuguese habitats (bogs, mires) are relatively widespread in temperate northern Europe, and the impacts of atN pollution on these types of ecosystems have been previously evaluated [11, 35, 51]. It remains an open question to what extent the sensitivity of these habitats in the warm Atlantic context of Portugal is different from Northern Europe. More importantly, very little is still known about the impacts of long-term elevated atN pollution on Mediterranean habitats that, in Europe, only occur in the south, and constitute major biodiversity hotspots which are considered a global conservation priority [29, 30]. Therefore, and despite their lower current estimated susceptibility to atN pollution, we consider that these Mediterranean habitats’ uniqueness and a large contribution to
3
3
1.
View Article Google Scholar
2.
View Article PubMed/NCBI Google Scholar
3.
4.
View Article PubMed/NCBI Google Scholar
5.
View Article Google Scholar
6.
View Article PubMed/NCBI Google Scholar
7. 8.
9.
View Article Google Scholar
10.
View Article PubMed/NCBI Google Scholar
11.
View Article PubMed/NCBI Google Scholar
12.
View Article Google Scholar
13.
Europe’s biodiversity and natural capital make them a priority in terms of improving future understanding the impacts of atN pollution. Understanding the role of heterogeneity, patchiness and disturbance over millennia on the resilience of these habitats [57] may also be a key to better management [58] and to building resilience in the most sensitive habitats.
Supporting information
S1 File. Final map as kml (google earth).
Map showing all Natura 2000 sites in mainland Portugal classified according to the relative risk from nitrogen pollution. Blue represent the lowest potential risk, red represents the highest risk.
https://doi.org/10.1371/journal.pone.0198955.s001 (7Z)
Acknowledgments
We are grateful for the funding through the project ‘NitroPortugal: Strengthening Portuguese research and innovation capacities in the field of excess reactive nitrogen’, funded by EU H2020-TWINN-2015 692331 and Fundação para a Ciência e Tecnologia (FCT) through the Post-Doctoral grants SFRH/BPD/75425/2010 to Pedro Pinho and SFRH/BPD/85419/2012 to Teresa Dias. We also acknowledge INMS—Towards the Establishment of an International Nitrogen Management System. Finally, we are grateful to the team of Portuguese experts for their expert judgment.
References
Erisman JW, Sutton MA, Galloway J, Klimont Z, Winiwarter W. How a century of ammonia synthesis changed the world. Nature Geoscience. 2008;1(10):636–9. PubMed PMID: WOS:000260004700002.
Rockstrom J, Steffen W, Noone K, Persson A, Chapin FS, Lambin EF, et al. A safe operating space for humanity. Nature. 2009;461(7263):472–5. PubMed PMID: WOS:000270082900020. pmid:19779433
Sutton MA, Howard CM, Erisman JW, Billen G, Bleeker A, Grennfelt P, et al. The European Nitrogen Assessment. Cambridge: Cambridge University Press; 2011.
Fowler D, Coyle M, Skiba U, Sutton MA, Cape JN, Reis S, et al. The global nitrogen cycle in the twenty-first century. Philosophical Transactions of the Royal Society B-Biological Sciences. 2013;368(1621). PubMed PMID: WOS:000319502100013. pmid:23713126
Hertel O, Skjoth CA, Reis S, Bleeker A, Harrison RM, Cape JN, et al. Governing processes for reactive nitrogen compounds in the European atmosphere. Biogeosciences. 2012;9(12):4921–54. PubMed PMID: WOS:000312668100003.
Reis S, Grennfelt P, Klimont Z, Amann M, ApSimon H, Hettelingh JP, et al. From acid rain to climate change. Science. 2012;338(6111):1153–4. PubMed PMID: WOS:000311666200026. pmid:23197517
FAO FaAO. FAOSTAT—Food and Agriculture Data. na.
Comission E. Directive 2016/2284 of the European Parliament and of the Council of 14 December 2016 on the reduction of national emissions of certain atmospheric pollutants, amending Directive 2003/35/EC and repealing Directive 2001/81/EC. 2016.
Winiwarter W, Erisman JW, Galloway JN, Klimont Z, Sutton MA. Estimating environmentally relevant fixed nitrogen demand in the 21st century. Climatic Change. 2013;120(4):889–901. PubMed PMID: WOS:000324830500015.
Sutton MA, Reis S, Riddick SN, Dragosits U, Nemitz E, Theobald MR, et al. Towards a climate-dependent paradigm of ammonia emission and deposition. Philosophical Transactions of the Royal Society B-Biological Sciences. 2013;368(1621). PubMed PMID: WOS:000319502100015. pmid:23713128
Bobbink R, Hicks K, Galloway J, Spranger T, Alkemade R, Ashmore M, et al. Global assessment of nitrogen deposition effects on terrestrial plant diversity: a synthesis. Ecological Applications. 2010;20(1):30–59. PubMed PMID: WOS:000275358100004. pmid:20349829
Britto DT, Kronzucker HJ. NH4+ toxicity in higher plants: a critical review. Journal of Plant Physiology. 2002;159(6):567–84. PubMed PMID: WOS:000176687800001.
Dias T, Martins-Loução MA, Sheppard L, Cruz C. Plant tolerance of ammonium varies between co-existing Mediterranean species. Plant and Soil. 2015;395(1–2):243–52. PubMed PMID: WOS:000361757400018.
View Article Google Scholar
14.
View Article Google Scholar
15.
View Article Google Scholar
16.
View Article PubMed/NCBI Google Scholar
17.
View Article PubMed/NCBI Google Scholar
18.
19.
View Article Google Scholar
20.
View Article PubMed/NCBI Google Scholar
21.
View Article PubMed/NCBI Google Scholar
22.
View Article PubMed/NCBI Google Scholar
23.
View Article Google Scholar
24.
View Article Google Scholar
25.
View Article Google Scholar
26.
View Article Google Scholar
27.
View Article Google Scholar
28.
View Article PubMed/NCBI Google Scholar
29.
View Article PubMed/NCBI Google Scholar
30.
Balakrishnan N, Subramanian KS. Mycorrhizal symbiosis and bioavailability of micronutrients in maize grain. Maydica. 2012;57(1–4):129–38. PubMed PMID: WOS:000209182700018.
Pinho P, Dias T, Cruz C, Tang YS, Sutton MA, Martins-Loucao MA, et al. Using lichen functional diversity to assess the effects of atmospheric ammonia in Mediterranean woodlands. Journal of Applied Ecology. 2011;48(5):1107–16. PubMed PMID: WOS:000295095100006.
Dias T, Clemente A, Martins-Loução MA, Sheppard L, Bobbink R, Cruz C. Ammonium as a Driving Force of Plant Diversity and Ecosystem Functioning: Observations Based on 5 Years' Manipulation of N Dose and Form in a Mediterranean Ecosystem. Plos One. 2014;9(4). PubMed PMID:
WOS:000334103000020. pmid:24695101
Fangmeier A, Hadwigerfangmeier A, Vandereerden L, Jager HJ. Effects of atmospheric ammonia on vegetation—a review. Environmental Pollution. 1994;86(1):43–82. PubMed PMID: WOS:A1994NT86900007. pmid:15091648
Pinho P, Branquinho C, Cruz C, Tang YS, Dias T, Rosa AP, et al. Assessment of Critical Levels of Atmospheric Ammonia for Lichen Diversity in Cork-Oak Woodland, Portugal. In: Sutton M, Reis S, Baker S, editors. Atmospheric Ammonia: SPRINGER; 2009. p. 109–19.
Pinho P, Theobald MR, Dias T, Tang YS, Cruz C, Martins-Loucao MA, et al. Critical loads of nitrogen deposition and critical levels of atmospheric ammonia for semi-natural Mediterranean evergreen woodlands. Biogeosciences. 2012;9(3):1205–15. PubMed PMID: WOS:000302179500025.
Munzi S, Loppi S, Cruz C, Branquinho C. Do lichens have "memory" of their native nitrogen environment? Planta. 2011;233(2):333–42. PubMed PMID: WOS:000286613200011. pmid:21053009
Pintó-Marijuan M, Da Silva AB, Flexas J, Dias T, Zarrouk O, Martins-Loução MA, et al. Photosynthesis of Quercus suber is affected by atmospheric NH3 generated by multifunctional agrosystems. Tree Physiology. 2013;33(12):1328–37. PubMed PMID: WOS:000329132600008. pmid:24150034
Pinho P, Llop E, Ribeiro MC, Cruz C, Soares A, Pereira MJ, et al. Tools for determining critical levels of atmospheric ammonia under the influence of multiple disturbances. Environmental Pollution. 2014;188:88–93. PubMed PMID: WOS:000334001000012. pmid:24568792
Treseder KK. A meta-analysis of mycorrhizal responses to nitrogen, phosphorus, and atmospheric CO2 in field studies. New Phytologist. 2004;164(2):347–55. PubMed PMID: WOS:000224346900012.
Pardo LH, Fenn ME, Goodale CL, Geiser LH, Driscoll CT, Allen EB, et al. Effects of nitrogen deposition and empirical nitrogen critical loads for ecoregions of the United States. Ecological Applications. 2011;21(8):3049–82. PubMed PMID: WOS:000299166300016.
Ochoa-Hueso R, Rocha I, Stevens CJ, Manrique E, Lucianez MJ. Simulated nitrogen deposition affects soil fauna from a semiarid Mediterranean ecosystem in central Spain. Biology and Fertility of Soils. 2014;50(1):191–6. PubMed PMID: WOS:000329094600020.
Bugalho MN, Caldeira MC, Pereira JS, Aronson J, Pausas JG. Mediterranean cork oak savannas require human use to sustain biodiversity and ecosystem services. Frontiers in Ecology and the Environment. 2011;9(5):278–86. PubMed PMID: WOS:000291514900018.
Holmberg M, Vuorenmaa J, Posch M, Forsius M, Lundin L, Kleemola S, et al. Relationship between critical load exceedances and empirical impact indicators at Integrated Monitoring sites across Europe. Ecological Indicators. 2013;24:256–65. PubMed PMID: CCC:000311059900030.
Sala OE, Chapin FS, Armesto JJ, Berlow E, Bloomfield J, Dirzo R, et al. Biodiversity—Global biodiversity scenarios for the year 2100. Science. 2000;287(5459):1770–4. PubMed PMID: WOS:000085775300030. pmid:10710299
Klausmeyer KR, Shaw MR. Climate change, habitat loss, protected areas and the climate adaptation potential of species in Mediterranean ecosystems worldwide. PLoS One. 2009;4(7):e6392. PubMed PMID: WOS:000268494500007. pmid:19641600
Phoenix GK, Hicks WK, Cinderby S, Kuylenstierna JCI, Stock WD, Dentener FJ, et al. Atmospheric nitrogen deposition in world biodiversity hotspots: the need for a greater global perspective in assessing N deposition impacts. Global Change Biology. 2006;12(3):470–6. PubMed PMID:
View Article Google Scholar
31.
View Article PubMed/NCBI Google Scholar
32.
View Article PubMed/NCBI Google Scholar
33.
View Article PubMed/NCBI Google Scholar
34. 35.
36.
View Article PubMed/NCBI Google Scholar
37.
View Article PubMed/NCBI Google Scholar
38. 39.
View Article Google Scholar
40.
View Article Google Scholar
41.
View Article Google Scholar
42.
View Article Google Scholar
43.
44.
View Article Google Scholar
45.
View Article Google Scholar
46.
View Article Google Scholar
47.
View Article PubMed/NCBI Google Scholar
48.
WOS:000236023000006.
Ochoa-Hueso R, Allen EB, Branquinho C, Cruz C, Dias T, Fenn ME, et al. Nitrogen deposition effects on Mediterranean-type ecosystems: An ecological assessment. Environmental Pollution. 2011;159(10):2265–79. PubMed PMID: WOS:000295493100008. pmid:21277663
Ochoa-Hueso R, Munzi S, Alonso R, Arróniz-Crespo M, Avila A, Bermejo V, et al. Ecological impacts of atmospheric pollution and interactions with climate change in terrestrial ecosystems of the Mediterranean Basin: current research and future directions Environmental Pollution. 2017;227:194.
pmid:28460237
Ekblom R, Galindo J. Applications of next generation sequencing in molecular ecology of non-model organisms. Heredity. 2011;107(1):1–15. PubMed PMID: WOS:000291635500001. pmid:21139633
Nilsson J, Grennfelt P. Critical loads for sulphur and nitrogen. Sweden: 1988.
Bobbink R, Hettelingh J-P. Review and revision of empirical Critical Loads and dose-response relationships. In: Effects CCf, editor. Netherlands: National Institute for Public Health and the Environment (RIVM); 2011.
Payne RJ, Dise NB, Stevens CJ, Gowing DJ, Partners B. Impact of nitrogen deposition at the species level. Proceedings of the National Academy of Sciences of the United States of America. 2013;110(3):984–7. PubMed PMID: WOS:000313909100046. pmid:23271811
Bleeker A, Hicks WK, Dentener E, Galloway J, Erisman JW. N deposition as a threat to the World's protected areas under the Convention on Biological Diversity. Environmental Pollution. 2011;159(10):2280–8. PubMed PMID: WOS:000295493100009. pmid:21122958
Samways J. M, McGeoch MA, New TR. Insect conservation: a handbook of approaches and methods: Oxford University Press; 2010.
Dias T, Malveiro S, Martins-Loucao MA, Sheppard LJ, Cruz C. Linking N-driven biodiversity changes with soil N availability in a Mediterranean ecosystem. Plant and Soil. 2011;341(1–2):125–36. PubMed PMID: WOS:000288455300011.
Dias T, Martins-Loução MA, Sheppard L, Cruz C. The strength of the biotic compartment in retaining nitrogen additions prevents nitrogen losses from a Mediterranean maquis. Biogeosciences. 2012;9(1):193–201. PubMed PMID: WOS:000300229000014.
Dias T, Oakley S, Alarcon-Gutierrez E, Ziarelli F, Trindade H, Martins-Loução MA, et al. N-driven changes in a plant community affect leaf-litter traits and may delay organic matter decomposition in a Mediterranean maquis. Soil Biology & Biochemistry. 2013;58:163–71. PubMed PMID:
WOS:000317158300021.
Pinho P, Bergamini A, Carvalho P, Branquinho C, Stofer S, Scheidegger C, et al. Lichen functional groups as ecological indicators of the effects of land-use in Mediterranean ecosystems. Ecological Indicators. 2012;15(1):36–42. PubMed PMID: WOS:000298129100005.
Dise NB, Ashmore M, Belyazid S, Bleeker A, Bobbink R, De-Vries W. Nitrogen as a threat to European terrestrial biodiversity. The European Nitrogen Assessment Sources, effects and policy perspectives. Cambridge, UK: Cambridge University Press; 2011.
Payne RJ, Dise NB, Field CD, Dore AJ, Caporn SJM, Stevens CJ. Nitrogen deposition and plant biodiversity: past, present, and future. Frontiers in Ecology and the Environment. 2017;15(8):431–6. PubMed PMID: CCC:000412134100016.
Dragosits U, Theobald MR, Place CJ, ApSimon HM, Sutton MA. The potential for spatial planning at the landscape level to mitigate the effects of atmospheric ammonia deposition. Environmental Science & Policy. 2006;9(7–8):626–38. PubMed PMID: CCC:000242696900004.
Sutton MA, Milford C, Dragosits U, Place CJ, Singles RJ, Smith RI, et al. Dispersion, deposition and impacts of atmospheric ammonia: quantifying local budgets and spatial variability. Environmental Pollution. 1998;102:349–61. PubMed PMID: CCC:000077893200050.
Vogt E, Dragosits U, Braban CF, Theobald MR, Dore AJ, van Dijk N, et al. Heterogeneity of atmospheric ammonia at the landscape scale and consequences for environmental impact assessment. Environmental Pollution. 2013;179:120–31. PubMed PMID: CCC:000320745800017. pmid:23669461
plant-View Article PubMed/NCBI Google Scholar
49.
View Article PubMed/NCBI Google Scholar
50.
View Article Google Scholar
51.
View Article Google Scholar
52.
View Article PubMed/NCBI Google Scholar
53.
View Article Google Scholar
54.
View Article PubMed/NCBI Google Scholar
55.
View Article PubMed/NCBI Google Scholar
56.
View Article PubMed/NCBI Google Scholar
57.
View Article Google Scholar
58.
View Article PubMed/NCBI Google Scholar
derived carbon into RNA. Proceedings of the National Academy of Sciences of the United States of America. 2007;104(43):16970–5. PubMed PMID: WOS:000250487600045. pmid:17939995
Reef R, Feller IC, Lovelock CE. Nutrition of mangroves. Tree Physiology. 2010;30(9):1148–60. PubMed PMID: WOS:000280923800010. pmid:20566581
Pereira PM, da Fonseca MP. Nature vs. nurture: the making of the montado ecosystem. Conservation Ecology. 2003;7(3). PubMed PMID: WOS:000223963100008.
Field CD, Dise NB, Payne RJ, Britton AJ, Emmett BA, Helliwell RC, et al. The Role of Nitrogen Deposition in Widespread Plant Community Change Across Semi-natural Habitats. Ecosystems. 2014;17(5):864–77. PubMed PMID: CCC:000339418400009.
Robroek BJM, Jassey VEJ, Payne RJ, Marti M, Bragazza L, Bleeker A, et al. Taxonomic and functional turnover are decoupled in European peat bogs. Nature Communications. 2017;8:1161–. PubMed PMID: CCC:000413833000005. pmid:29079831
Wilkins K, Aherne J, Bleasdale A. Vegetation community change points suggest that critical loads of nutrient nitrogen may be too high. Atmospheric Environment. 2016;146:324–31. PubMed PMID: CCC:000388051700031.
Sheppard LJ, Leith ID, Crossley A, Van Dijk N, Fowler D, Sutton MA, et al. Stress responses of Calluna vulgaris to reduced and oxidised N applied under 'real world conditions'Stress responses of Calluna vulgaris to reduced and oxidised N applied under 'real world conditions'. Environmental Pollution. 2008;154(3):404–13. PubMed PMID: WOS:000258218000006. pmid:18177985
van den Berg LJL, Jones L, Sheppard LJ, Smart SM, Bobbink R, Dise NB, et al. Evidence for differential effects of reduced and oxidised nitrogen deposition on vegetation independent of nitrogen load. Environmental Pollution. 2016;208:890–7. PubMed PMID: WOS:000368306500069. pmid:26476695
Bohan DA, Caron-Lormier G, Muggleton S, Raybould A, Tamaddoni-Nezhad A. Automated Discovery of Food Webs from Ecological Data Using Logic-Based Machine Learning. Plos One. 2011;6(12). PubMed PMID: WOS:000300677000013. pmid:22242111
Tylianakis JM, Rand TA, Kahmen A, Klein A-M, Buchmann N, Perner J, et al. Resource heterogeneity moderates the biodiversity-function relationship in real world ecosystems. PLoS Biology. 2008;6(5):947–56. PubMed PMID: WOS:000256850100007.
Fenn ME, Allen EB, Weiss SB, Jovan S, Geiser LH, Tonnesen GS, et al. Nitrogen critical loads and management alternatives for N-impacted ecosystems in California. Journal of Environmental Management. 2010;91(12):2404–23. PubMed PMID: WOS:000282926200001. pmid:20705383