eISSN: 2171-9292 http://dx.doi.org/10.5424/sjar/2015131-6375 Instituto Nacional de Investigación y Tecnología Agraria y Alimentaria (INIA)
RESEARCH ARTICLE OPEN ACCESS
they were incorporated into large-scale commercial farms (100-1 000 ha) that represent a significant capital investment in the trees themselves as well as the necessary infrastructure. Some of the introduced cultivars have shown difficulties in obtaining stable yields due to minimal or low flowering that may be related to the higher temperatures and/or the greater temperature fluctuations during the winter rest period in this region compared to the original Mediterranean
Evaluation of olive flowering at low latitude sites in Argentina
using a chilling requirement model
Vanesa E. Aybar1, J. Paulo De Melo-Abreu2, Peter S. Searles3, Angel C. Matias1, Carmen Del Río4, Juan M. Caballero4 and M. Cecilia Rousseaux3
1 Instituto Nacional de Tecnología Agropecuaria (INTA), EEA Catamarca, Ruta Provincial 33 Km 4,5, Sumalao, Valle Viejo, 4705 Catamarca, Argentina
2 Universidade de Lisboa, DCEB, Instituto Superior de Agronomia, Tapada da Ajuda, 1349-017 Lisboa, Portugal 3 Centro Regional de Investigaciones Científicas y Transferencia Tecnológica de La Rioja (CRILAR-CONICET).
Entre Ríos y Mendoza s/n, Anillaco (5301), La Rioja, Argentina
4 Instituto de Investigación y Formación Agraria y Pesquera (IFAPA), Centro Alameda del Obispo, Apartado 3092, 14080 Córdoba, Spain
Abstract
Olive production has expanded significantly from the Mediterranean Basin into the New World over the last two decades. In some cases, cultivars of European origin have been introduced at a large commercial scale with little previous evaluation of poten-tial productivity. The objective of this study was to evaluate whether a temperature-driven simulation model developed in the Mediterranean Basin to predict normal flowering occurrence and flowering date using cultivar-specific thermal requirements was suitable for the low latitude areas of Northwest Argentina. The model was validated at eight sites over several years and a wide elevation range (350-1200 m above mean sea level) for three cultivars (‘Arbequina’, ‘Frantoio’, ‘Leccino’) with potentially differ-ent chilling requiremdiffer-ents. In ‘Arbequina’, normal flowering was observed at almost all sites and in all years, while normal flower-ing events in ‘Frantoio’ and ‘Leccino’ were uncommon. The model successfully predicted if flowerflower-ing would be normal in 92% and 83% of the cases in ‘Arbequina’ and ‘Frantoio’, respectively, but was somewhat less successful in ‘Leccino’ (61%). When flower-ing occurred, the predicted flowerflower-ing date was within ± 7 days of the observed date in 71% of the cases. Overall, the model results indicate that cultivar-specific simulation models may be used as an approximate tool to predict whether individual cultivars will be successful in new growing areas. In Northwest Argentina, the model could be used to identify cultivars to replace ‘Frantoio’ and ‘Leccino’ and to simulate global warming scenarios.
Additional key words: chilling units; dormancy; Olea europaea; temperature; thermal time.
Abbreviations used: AMSL (above mean sea level); CU (chilling units); DMA model (simulation Model-1 of De Melo-Abreu
et al., 2004); DOY (day of year); RMSE (root mean square error); Tb (base temperature for calculating thermal time); To (optimum
temperature for chilling accumulation); Tx (breakpoint temperature above which chilling units are nullified); TT (thermal time from
the end of dormancy to flowering).
Citation: Aybar, V. E.; De Melo-Abreu, J. P.; Searles, P. S.; Matias, A. C.; Del Río, C.; Caballero, J. M.; Rousseaux, M. C. (2015).
Evaluation of olive flowering at low latitude sites in Argentina using a chilling requirement model. Spanish Journal of Agricultural Research, Volume 13, Issue 1, e09-001, 10 pages. http://dx.doi.org/10.5424/sjar/2015131-6375.
Received: 09 Jun 2014. Accepted: 21 Jan 2015.
http://dx.doi.org/10.5424/sjar/2015131-6375
Copyright © 2015 INIA. This is an open access article distributed under the Creative Commons Attribution License (CC by 3.0),
which permits unrestricted use, distribution, and reproduction in any medium, provided the original work is properly cited.
Funding: This research work was financially supported by INTA (Instituto Nacional de Tecnología Agropecuaria). Competing interests: The authors have declared that no competing interests exist.
Correspondence should be addressed to Cecilia Rousseaux: crousseaux@crilar-conicet.gob.ar
Introduction
In the last 20 years, there has been considerable ex-pansion of olive production at low latitudes (28-32° S) in Argentina, often including the planting of well-known cultivars from the Mediterranean Basin. The suitabil-ity of many of these cultivars for the agroclimatic conditions found in Northwestern Argentina was uncertain (Gómez del Campo et al., 2010). However,
conditions could ultimately lead to its application as a much needed predictive tool to be used before planting specific cultivars in new production areas. Thus, the objective of the present study was to evaluate the occurrence of normal flowering in three olive cultivars of Mediterranean origin when grown in the Arid Chaco of Northwestern Argentina using the DMA model. If normal flowering was predicted, the model was further used to predict flowering date. Because long-term phenological records were not available over several decades for this new region, eight sites across a wide elevational gradient were used to obtain different temperature conditions for the years evaluated.
Material and methods
Study area and plant material
Eight sites in the provinces of Catamarca and La Rioja in the Northwest of Argentina were selected at latitudes of 28-30° S and an elevation gradient of 350-1200 m above mean sea level (AMSL) (Fig. 1; Table 1). Phytogeographically, the area is considered Arid Chaco with native vegetation being mainly scrubland. At each site, one olive orchard was used for the flow-ering observations. Most of the orchards were located in modern, commercial olive farms with densities of 250-300 trees/ha and were drip-irrigated. Trees in these orchards were 7-8 years-old at the start of the observations. The exceptions were the Sumalao and Tinogasta sites, which were located in older, tradi-tional orchards with a plant density of 100 trees/ha and were flood-irrigated. Trees in these orchards were approximately 40 years-old. The orchard at the Su-malao site was part of the germplasm collection of the Instituto Nacional de Tecnología Agropecuaria (INTA). Trees were kept well irrigated at all sites dur-ing the years this study was conducted with 600-1000 mm of irrigation being applied per year depending on the amount of rainfall (70-450 mm/yr). Because rain-fall events are infrequent in the winter months, all orchards were irrigated during this period to avoid water deficit conditions, which have been shown to reduce or delay the flowering of olive trees (Orlandi et al., 2010a; Oteros et al., 2013; Pierantozzi et al., 2014). Evapotranspiration reference values have been estimated to be 1600 mm/yr in the study area (Searles et al., 2011).
Flowering data for three Mediterranean cultivars were collected from 2004-2008 at the sites (Table 1). ‘Arbequina’ is a Spanish cultivar that had been previ-Basin growing areas of these cultivars (Orlandi et al.,
2010a).
The environmental temperature regime considered to be optimal for olive production typically occurs between the latitudes of 30° and 45° under Mediter-ranean climate conditions with mild winters and long, warm summers (Bongi & Palliotti, 1994). At lower latitudes (Mexico, Peru, Argentina), Ayerza & Sibbett (2001) have reported higher temperatures in winter and much shorter periods with chilling temperatures than in traditional European olive growing areas. Despite higher average temperatures, cold fronts in some re-gions such as Northwest Argentina can still result in drastic temperature reductions with below zero tem-peratures several times a year and a direct risk of frost damage to reproductive buds.
Early studies conducted under Mediterrean climate conditions in California suggested that lack of flower-ing in certain areas could be explained by insufficient cold during the winter (Hartmann, 1953) and that cold requirements for flowering are cultivar-dependent (Hartmann & Porlingis, 1957). Physiologically-based models were later developed using phenological re-cords in the Mediterranean Basin to predict the flow-ering response of olive to temperature (e.g.; Alcalá & Barranco, 1992; Osborne et al., 2000; Cesaraccio et al., 2004; Orlandi et al., 2006; Motisi et al., 2008, Pérez-López et al., 2008). A potential limitation of many such models is that differences between culti-vars were little considered. De Melo-Abreu et al. (2004) have proposed a sequential model (abbrevi-ated as the DMA model) for different cultivars from long-term Spanish and Portuguese phenological re-cords that predicts the date when dormancy ends after reaching the chilling requirement (i.e., the end of endodormancy) and also predicts the full flowering date after the accumulation of warmer temperatures. Using a cultivar-specific model often results in a lower prediction error associated with presence or absence of flowering and flowering date than using more general models. The DMA model also discounts chilling hours in the endodormancy release calcula-tions when the temperature exceeds 20.7°C and does not accumulate chilling hours below 0°C. In growth chambers, several consecutive days of high tempera-ture (26°C) have recently been shown to produce a significant reduction (>80%) in the number of inflo-rescences irrespective of the timing of high tempera-ture application during a 75-day inductive period (Malik & Pérez, 2011).
Few attempts have been made to model olive flow-ering outside of Mediterranean climate regions (Den-ney & McEachern, 1983; Den(Den-ney et al., 1985). As-sessing the DMA model under non-Mediterranean
Hourly air temperature data was collected near each site using automatic weather stations located in El Infiernillo, Aimogasta, Pajonal, Chilecito, and Co-pacabana. For the remaining three sites, maximum and minimum temperatures were recorded daily with mer-cury thermometers. To determine the consistency and accuracy of both the automatic stations and the mometers, two mercury maximum and minimum ther-mometers were rotated between the different sites. To provide an approximate comparison of temperature data from our Northwest Argentina sites with the Mediter-ranean Basin, daily temperature values for a period of years similar to those of our study were obtained for Córdoba, Spain and Florence, Italy. The Córdoba data were from the World Olive Germplasm Bank of Córdoba, while the Florence data is publically avail-able on-line (http://clima.tiempo.com/clima-en-firenze+peretola-161700.html).
ously observed to flower consistently in the region, while ‘Frantoio’ and ‘Leccino’ are Italian cultivars with less consistent flowering under our climatic conditions. The flowering of all three cultivars were evaluated at the Chañarito, Sumalao, Aimogasta, and Pajonal sites, while only the flowering of ‘Arbequina’ was assessed at the remaining four sites due to lack of availability of the Italian cultivars. To corroborate the genetic identity of the study material, leaf buds were collected from each site and cultivar. The iden-tity of each cultivar was confirmed by microsatellite molecular markers at the Universidad Nacional de Cuyo. ‘Arbequina’ and ‘Frantoio’ material corre-sponded to the World Olive Germplasm Bank of Córdoba (Spain) patterns (Caballero & Del Río, 2008; Trujillo et al., 2014), while ‘Leccino’ material coin-cided with that cultivar as reported in Tuscany, Italy (Bandelj et al., 2004). Latitude (°S) Longitude (°W) –20 –70 –60 –50 –30 –40 Argentina Uruguay Brazil Paraguay Bolivia Chile –50 Latitude (°S) –26 Longitude (°W) –69 –67 –65 –63 –28 –30 –32 Catamarca El Infiernillo Chañarito Sumalao Aimogasta Pajonal Chilecito Copacabana Tinogasta La Rioja
Figure 1. Latitude (°S) and longitude (°W) of the eight study sites in the provinces of Catamarca and La Rioja, Argentina. The four
lowest elevation sites are marked by closed, dark symbols, while the four highest sites are marked by unfilled symbols. Maps were constructed with SimpleMappr software.
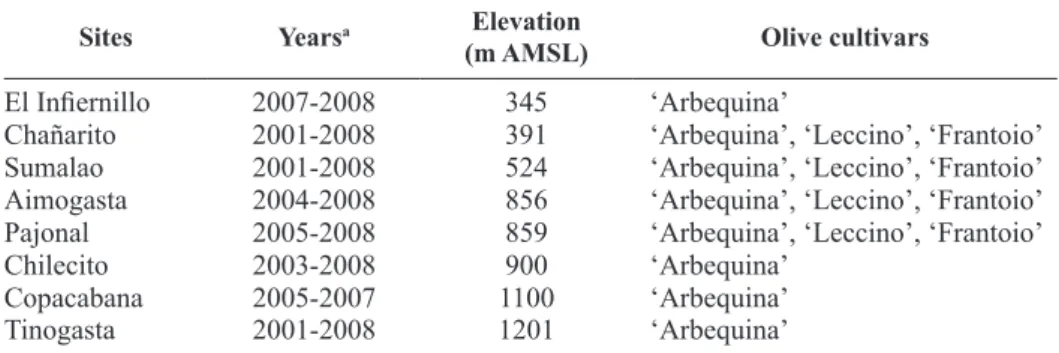
Table 1. Some characteristics of the study sites in the Catamarca and La Rioja provinces of Northwest Argentina
Sites Yearsa Elevation
(m AMSL) Olive cultivars
El Infiernillo 2007-2008 345 ‘Arbequina’
Chañarito 2001-2008 391 ‘Arbequina’, ‘Leccino’, ‘Frantoio’
Sumalao 2001-2008 524 ‘Arbequina’, ‘Leccino’, ‘Frantoio’
Aimogasta 2004-2008 856 ‘Arbequina’, ‘Leccino’, ‘Frantoio’
Pajonal 2005-2008 859 ‘Arbequina’, ‘Leccino’, ‘Frantoio’
Chilecito 2003-2008 900 ‘Arbequina’
Copacabana 2005-2007 1100 ‘Arbequina’
Tinogasta 2001-2008 1201 ‘Arbequina’
a Flowering data were recorded between the years 2004-2008. Yield data from previous years were
Model description
In order to estimate the flowering date, Model-1 of De Melo-Abreu et al. (2004) was used to calculate: 1) the number of chilling units (CU) accumulated before bud dormancy release and 2) the thermal time (TT) accumulated in degree days between the end of bud dormancy and flowering. This model also indicates the likelihood of abnormal flowering due to insufficient CU or TT. For the Southern Hemisphere, the accumu-lation of CU was considered to start on April 1 (DOY 91) in the early Fall to be consistent with the start date (October 1; DOY 275) proposed by the DMA model for the Northern Hemisphere. The last possible day of CU accumulation for flowering was defined as October 27 (DOY 300; mid-Spring) because no CU accumu-lated after this date in our region. The model requires only maximum and minimum daily temperature and geographic location (latitude, longitude) as inputs. Using these data, the model simulates hourly tempera-tures and thus the accumulation of CU or TT, depend-ing on the model phase. The model, which is written in Visual Basic for Applications, is available in Excel format on the Agrometeorology, Agriculture and En-vironment Tools webpage at the Universidade de Lis-boa (http://home.isa.utl.pt/~jpabreu/PaginaTecnica. htm). It should be noted that neither 2 or Model-3 of De Melo-Abreu et al. (2004) were tested in this study because Model-2 lacks a mechanism to reduce the CU accumulated when high temperatures occur and Model-3 only considers TT accumulation after a certain date and not CU accumulation. Thus, these models were considered a priori to be less appropriate for our warm region than Model-1.
The cultivar-specific number of CU and TT required for flowering in each cultivar were obtained for ‘Ar-bequina’ from the De Melo-Abreu et al. (2004) study (Table 2). For ‘Leccino’ and ‘Frantoio’, 15 years (1991-2005) of air temperature and flowering data from the World Olive Germplasm Bank of Córdoba (Spain) were used to make these estimations with an optimization
Flowering observations
At each study site, 10-12 trees per cultivar were marked for phenological observations that were con-ducted every 3 days from mid-winter (August) until the end of the flowering period (late October) using the procedure of Fernández-Escobar & Rallo (1981). The date of full flowering was determined using these ob-servations, and defined as the average of the dates at which at least 50% of the flowers of the observed trees were open. This is the same criteria used by the DMA model, and is equivalent to a BBCH scale value of 65 for olive growth stage phenology (Sanz-Cortés et al., 2002). Under our climatic conditions, flowering usu-ally occurred between day of year (DOY) 270-290 (i.e., Sept. 27-Oct. 17). This would be equivalent to late March and April in the Northern Hemisphere. Similar to Ramírez-Santa Pau et al. (2002), flowering inten-sity per tree was estimated visually in the field by as-signing numerical values ranging from 0 to 5 to the percentage of the tree crown that was flowering. At the low end, zero represented no flowering (0%), while five represented 80-100% flowering of the tree crown. Flowering was considered to be normal when more than half of the trees had flowering intensities equal to or greater than 2 (i.e., 20-40% flowering of the tree crown).
In addition to the flowering data (2004-2008), we also included yield data when available from previous years at the same sites to increase the number of ob-servations. In such cases, moderate and high yields were considered to reflect normal flowering, while very low yield values were considered to be due to abnormal flowering. This was done because not all cultivars were present at each of the eight sites as mentioned earlier. To reduce the possibility of errors, alternative bearing behavior and crop management information at each site were considered when assessing yield data. Neverthe-less, it is recognized that unidentified factors affecting fruit set could result in low yields even though flower-ing was normal.
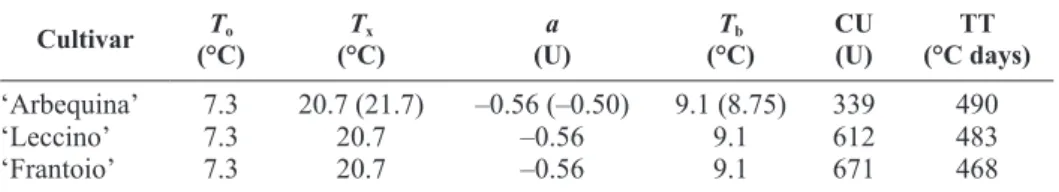
Table 2. Temperature parameter values and cultivar-specific number of chilling units (CU) and thermal time (TT) required for flowering for the three olive cultivars
Cultivar To
(°C) (°C)Tx (U)a (°C)Tb CU (U) (°C days)TT
‘Arbequina’ 7.3 20.7 (21.7) –0.56 (–0.50) 9.1 (8.75) 339 490
‘Leccino’ 7.3 20.7 –0.56 9.1 612 483
‘Frantoio’ 7.3 20.7 –0.56 9.1 671 468
To (optimum temperature for chilling accumulation); Tx (air temperature above which chilling
units are discounted); a (rate at which chilling units are discounted when Tx is reached); Tb (the base temperature for calculating thermal time); CU (total chilling units required until the end of endodormancy); TT (thermal time required from the end of dormancy to flowering). The numbers in parentheses are alternative parameter values for ‘Arbequina’ for warmer conditions.
on a chi-square distribution (Freese, 1960). For this analysis, it was tested whether the number of predicted flowering dates that fell within 7 days of the observed values was significant.
Results
Air temperatures
During the accumulation of CU and TT (early Fall-mid Spring) for our Northwest Argentina sites, the highest daily average maximum temperature was 25.2°C at 345 m AMSL. Although a statistically sig-nificant decrease in maximum temperature with in-creasing elevation was not observed, the lowest maximum was 21.6°C at 900 m (Fig. 2A). Daily minimum temperature values showed a negative lin-ear relationship with elevation (R2=0.54; p<0.05), and ranged from 10.1°C at 391 m to 2.4°C at 1100 m. The number of days with frosts (<0°C) was greater than 40 d above 1000 m with a large amount of variability at lower elevations (Fig. 2B). This variability was likely related to differences in cold air drainage as-sociated with the microtopography in and around each study site.
To provide a comparison, average maximum tem-perature for two selected Mediterranean sites, Córdoba (Spain) and Florence (Italy), was approximately 6°C and 11°C lower; respectively, than in Northwest Argentina for the same dates (early Fall-mid Spring) (Fig. 2A). In contrast, daily minimum temperature values and the number of days with frosts were within the same range as those found at our sites.
Flowering observations
Flowering at the eight sites was assessed based on 42 observations (Sites × Years) in ‘Arbequina’, 18 in ‘Frantoio’, and 18 in ‘Leccino’ (Table 3). Several ob-servations for each cultivar (i.e., 5 or 6) were dis-carded because of frost damage to reproductive buds. In ‘Arbequina’, 94% of the remaining observations were consistent with normal flowering, and percentage flowering intensity was fairly high (i.e., 60-80% of the tree crown). Abnormal flowering only occurred in ‘Arbequina’ at two low elevation sites, Sumalao and Chañarito. Over the seven years analyzed, 30% of the years had abnormally low flowering intensities at Su-malao and the percentage was 15% at Chañarito. At these sites, low flowering intensity did not seem to be related to alternate bearing behavior.
algorithm that employed the downhill simplex method (Nelder & Mead, 1965). The estimated number of CU required were very different among cultivars (‘Arbe-quina’=339, ‘Leccino’=612, ‘Frantoio’=671 units), but estimated TT was similar (468-490°C days). ‘Arbe-quina’ is considered an early flowering cultivar that was first widely cultivated under fairly mild tempera-ture conditions in several regions of Spain such as Catalonia and Andalusia, while ‘Leccino’ and ‘Frantoio’ are late flowering cultivars from colder Tuscany in northern Italy.
The calculation of CU accumulation until the end of dormancy by the DMA model utilizes several parameters related to temperature including the optimum tempera-ture for chilling (To=7.3°C) and the breakpoint tem-perature (Tx=20.7°C) above which a constant number of accumulated chilling units (a=–0.56) are nullified (Table 2). The parameter a, represents the maximum number of chilling units that are lost for each hour of high tem-perature. Hourly temperatures equal to or less than zero (Th≤0) are not included as chilling units in the DMA model, but no CU are subtracted under freezing tem-peratures. After endodormancy release, a base tempera-ture (Tb) of 9.1 is used to calculate thermal time until full flowering. In addition to these standard parameter values for olive, the De Melo-Abreu et al. (2004) study proposed alternative temperature coefficients for CU accumulation (Tx=21.7; a=–0.50) and TT (Tb=8.75) for early flowering cultivars such as ‘Arbequina’ to account for winter temperatures being above normal in some years when the model was tested in Córdoba, Spain.
Statistical analysis
Potential relationships between elevation and tem-perature variables as well as with the number of days with frosts were evaluated with GraphPad Prism 5 (San Diego, CA). The ability of the DMA model to accu-rately predict whether flowering occurred normally or not was assessed by comparing the number of successful predictions relative to the total number of observations. Prediction errors were categorized as type 1 (when the model predicted normal flowering, but it was not ob-served) or type 2 (when the model did not predict normal flowering, but it was observed). Flowering observations were excluded from the analysis if there were heavy winter frosts at a particular site in a given year.
To evaluate the model’s ability to predict full flow-ering date, a simple linear regression analysis between predicted and observed values was performed and the root mean square error (RMSE) was determined (Wil-mott et al., 1985). The differences between predicted and observed flowering dates were also evaluated based
considered normal, the percentage flowering intensity was most often between 20-40% and was never great-er than 50% of the tree crown. These obsgreat-ervations are in agreement with the number of CU values required for these cultivars based on the data of the World Olive Germplasm Bank of Córdoba (Spain) (Table 2).
Model predictions of flowering normality
The model accurately predicted whether flowering was normal or abnormal in ‘Arbequina’ in 92% of the cases (Table 4) for our eight sites when using the al-ternative temperature coefficients proposed by De Melo-Abreu et al. (2004) for early flowering cultivars under warmer than average winter conditions in Cór-doba, Spain (Table 2). The errors that did occur for ‘Arbequina’ in 3 of the 36 observations evaluated (8%) were type 1 (i.e., the model predicted normal flowering but it was not observed). The use of the standard tem-perature coefficients resulted in only slightly fewer successful predictions (84%), while the errors were divided into both type 1 and type 2 (data now shown). A type 2 error indicates that the model did not predict normal flowering, but it was observed.
In ‘Frantoio’ and ‘Leccino’, the model successfully predicted whether flowering was normal or not in 83% and 61% of the cases; respectively (Table 4). Similar to ‘Arbequina’ with the alternative coefficients, the errors that did occur for ‘Leccino’ were type 1 (5 of 13 cases evaluated). Thus, in both cultivars, the model sometimes predicted normal flowering when it did not occur. In ‘Frantoio’, only two prediction errors oc-curred with one error being type 1 and one error being type 2. In this case, the type 2 error occurred because insufficient CU accumulation was predicted, but normal flowering was observed.
Model prediction of flowering dates
The ability of the model to predict flowering dates was analyzed in ‘Arbequina’ and ‘Frantoio’ for the cases when normal flowering was successfully pre-The flowering behavior of ‘Leccino’ and ‘Frantoio’
was primarily examined at low elevation sites (391-859 m AMSL). Normal flowering occurred in some in-stances at one of the higher sites (Aimogasta; 856 m AMSL), but the overall percentages of observations with normal flowering were still low (i.e., 14% in ‘Lec-cino’ and 31% in ‘Frantoio’). Even when flowering was
0 10 20 30 y= -0.006x + 11.4 (r2= 0.54) Temperature (°C ) 0 500 1 000 1 500 0 20 40 60 80 (A) (B) Elevation (m) Frost (# of days)
Figure 2. Daily average maximum and minimum temperatures
(A) and number of days with frosts (B) as a function of elevation for eight study sites in Northwest Argentina (●) during the ac-cumulation of chilling units until the end of dormancy and ther-mal time until flowering (DOY 91-300; April 1-October 27). Data points are also shown for Córdoba, Spain (Δ) and Florence, Italy (○) for a similar Northern Hemisphere time period (DOY 275-118; October 1-April 27). The years evaluated for the Ar-gentine sites coincided with the years when flowering or yield information was available for each site (see Table 1). Data from the two Mediterranean sites are from similar years.
Table 3. Total observations for each cultivar (Sites × Years), observations discarded due to frost damage, observations with normal flowering (%), and average percentage flowering intensity of the tree crown (%)
Cultivar Observations (#) Frost damage (#) Normal flowering (%) Flowering intensity (%)
‘Arbequina’ 42 6 94 60-80
‘Leccino’ 18 5 14 0-20
fruit trees require several years of monitoring, simula-tion models can provide useful predicsimula-tions before field trials are undertaken or before orchards are commer-cially established. Quite a number of temperature-driven flowering models have been developed and evaluated for olive trees for Mediterranean climates (e.g., Alcalá & Barranco, 1992; Osborne et al., 2000; Cesaraccio et al., 2004; De Melo-Abreu et al., 2004; Orlandi et al., 2006; Motisi et al., 2008; Pérez-López et al., 2008), while fewer models have been attempted for non-Mediterranean areas (Denney & McEachern, 1983; Denney et al., 1985). Temperature-driven mod-els typically either predict the chilling requirements or heat accumulation needed to predict the flowering date of olive (Olea europaea L.) as a species. The DMA model proved to be advantageous under our conditions in Northwestern Argentina because it took into account the potential variability in flowering behavior between cultivars.
One of the most distinctive features of the climate in mountainous NW Argentina during the autumn and winter period when chilling accumulation occurs is alternating periods (i.e., days) of high and low tem-peratures (Ayerza & Sibbet, 2001). Average maximum and minimum temperatures at our study sites for this period ranged from 21.6-25.2°C and 2.4-10.1°C, re-spectively, for the years in which flowering was evalu-ated with large differences between sites due to eleva-tion. For two selected Mediterranean Basin sites, Córdoba (Spain) and Florence (Italy) had lower average maximum values for this same time period (19.1°C in Córdoba; 14.3°C in Florence), while average minimum temperatures (6.9°C in Córdoba; 4.6°C in Florence) were within the same range as those of NW Argentina. Even with the higher maximum temperatures in NW Argentina, the DMA model developed under Mediter-ranean climate conditions in Spain and Portugal suc-cessfully predicted whether flowering would be normal or not in 92% of the cases for ‘Arbequina’ and 83% for ‘Frantoio’. The percentage (61%) was somewhat lower dicted (Fig. 3). Of 21 cases, the flowering date for these
two cultivars was predicted within ±7 days in 71% of the cases using a chi-square analysis (p < 0.05), and the RMSE was just slightly higher (8 days). In ‘Arbe-quina’, the predicted flowering date was 10-15 days earlier than the observed date at some sites and in some years. In contrast, the predicted flowering date in ‘Fran-toio’ was later than the observed date in some cases. ‘Leccino’ was not included in the analysis because normal flowering could only be estimated from previ-ous production data at the Aimogasta site in two cases rather than from actual flowering data.
Discussion
Expansion of olive production to lower than tradi-tional latitudes requires information about the flower-ing response of different cultivars to key environmen-tal factors such as temperature (Orlandi et al., 2010b; Aguilera et al., 2014). Because field trials in perennial
Table 4. Model predictions of whether normal flowering occurred or not for each cultivar
Cultivar Cases(#) Successes(%)
Errors Type 1 (%) Type 2 due to CU (%) due to TT (%) ‘Arbequina’ 36 92 8 0 0 ‘Leccino’ 13 61 39 0 0 ‘Frantoio’ 12 83 8.5 8.5 0
The term successes refers to the percentage of correct predictions. Errors are type 1 (model pre-dicted normal flowering but it was not observed) and type 2 (model did not predict normal flower-ing but it was observed). Type 2 errors can occur because the model concludes that either CU or TT were insufficient.
Figure 3. Predicted versus observed flowering dates in
‘Arbe-quina’ (closed symbols) and ‘Frantoio’ (open symbols) expressed as day of year (DOY) for each site. The solid line corresponds to the 1:1 line and the dotted lines represent the ± 7 days range of the chi-square analysis. The root mean square error was 8 days.
250 270 290 310 330 270 290 310 El Infiernillo Chañarito Sumalao Aimogasta Pajonal Copacabana Chilecito
Observed flowering date (DOY)
A consideration not accounted for in the DMA model is whether a maximum threshold for thermal time accumulation to flowering exists after endodor-mancy release. In a similar manner, Orlandi et al. (2010b) used a minimum temperature threshold (Tb=7°C) in the springtime in Italy for calculating degree day accumulation until flowering, but no maximum temperature threshold was included. A maximum temperature of 35°C is considered to be the threshold above which no fruit growth occurs in peach trees (Grossman & DeJong, 1994), while Pérez-López et al. (2008) proposed a maximum temperature of 40°C for fruit growth in olive trees. However; at least in olive, no similar information is available for max-imum temperatures related to thermal time until flow-ering. If a maximum temperature of 35°C is evalu-ated for our Sumalao site, 3-17 days with daily maximum temperatures of 35°C occurred in late winter and early spring depending on the year. In contrast, temperatures of 40°C are rare at any time of the year. In Córdoba (Spain), there were no days with temperatures of 35°C for the same period and years used in our study. The inclusion of a maximum tem-perature threshold for thermal time until flowering after endodormancy release could potentially avoid early flowering date predictions in some years in our area. Predicted flowering in ‘Arbequina’ was some-times 10-15 days earlier than observed values at low elevation, warm sites. Further controlled environment studies could provide information to improve our understanding of thermal time accumulation.
The high number of CU estimated for ‘Frantoio’ and ‘Leccino’ from the World Olive Germplasm Bank of Córdoba (Spain) was confirmed by our field ob-servations. ‘Arbequina’ flowered normally in almost all cases (94%) in warm Northwest Argentina, while ‘Leccino’ (14%) and ‘Frantoio’ (31%) did not. ‘Ar-bequina’ is considered an early flowering cultivar that is often grown under fairly mild conditions in Cata-lonia and Andalusia. In contrast, ‘Leccino’ and ‘Fran-toio’ originate from colder Tuscany where the climate is markedly dissimilar to our region. At the commer-cial level, these two cultivars are being eliminated by many growers, while ‘Arbequina’ is viewed favorably because of its reliable flowering and fairly consistent yields. One practical use of the DMA model in our region may be to predict what cultivars could replace ‘Frantoio’ and ‘Leccino’. Another alternative would be to substitute the lack of CU due to insufficient cold temperatures with chemical applications. Under our conditions in Northwest Argentina, neither benzylad-enine (a cytokinin) or hydrogen cyanamide (Dor-mex®) application led to flowering in ‘Frantoio’ when applied during a particularly warm winter (Aybar, for ‘Leccino’ possibly due to cultivar differences
be-tween the trees grown in Argentina and those of the World Olive Germplasm Bank of Córdoba (Spain) from which the required chilling temperature parameters were obtained. The ‘Leccino’ evaluated in this study was from several sources including both Argentine and Italian nurseries. Further genetic characterization of ‘Leccino’ in Argentina is needed.
The validation of predicted flowering date for Mediterranean Basin areas in Spain and Portugal per-formed by De Melo-Abreu et al. (2004) indicated a RMSE value of 3 days. In our study in NW Argentina, the differences between the predicted and observed flowering dates were greater with a RMSE of between 7-9 days depending on what temperature parameters were used. A separate performance evaluation carried out by chi-square analysis indicated that ±7 days rep-resented well the model predictions, and flowering date was predicted within this range in 71% of the cases for ‘Arbequina’ and ‘Frantoio’. The greater model predic-tion error for flowering date in NW Argentina relative to the Mediterranean Basin should not be surprising considering that the model was specifically calibrated only for the Mediterranean sites. Additionally, our study evaluated fewer flowering dates (21) than the De Melo-Abreu et al. (2004) study (83 dates), which may have led to greater variability in our study. Using a different model proposed for Central Italy, Orlandi et al. (2006) reported that 86% of the predicted maxi-mum pollen concentration values, a surrogate for flowering date, were within ±5 days of the observed dates.
Temperature parameter values are often dependent on the sites for which they were calculated (Bon-homme, 2000). In this regard, Galán et al. (2005) found different Tb values for accumulating thermal time until flowering in olive depending on the values of average air temperatures at different sites in Andalusia (Spain). Aguilera et al. (2014) also reported over a wide latitu-dinal gradient from central Italy (43°N) to southern Tunisia (33°N) that more southerly olive populations had lower thermal time requirements than those in the north. It is possible that the warm temperatures in our area may have resulted in physiological changes within the tree and its buds that led to deviations from the DMA model calculations. Additionally, the rate in the model at which chilling units are discounted when Tx is reached (i.e., the a parameter) may not be ap-plicable to all temperature conditions. For example, Malik & Pérez (2011) demonstrated in growth cham-bers that several consecutive days of temperatures over 26°C during the daytime produced up to an 83% flow-ering reduction in ‘Arbequina’. Such extended periods are fairly common in our area.
References
Aguilera F, Ruiz L, Fornaciari M, Romano B, Galán C, Oteros J, Ben Dhiab A, Msallem M, Orlandi F, 2014. Heat accumulation period in the Mediterranean region: Pheno-logical response of the olive in different climate areas (Spain, Italy and Tunisia). Int J Biometeorol 58: 867-876. http://dx.doi.org/10.1007/s00484-013-0666-7
Alcalá AR, Barranco D, 1992. Prediction of flowering time in olive for the Cordoba Olive Collection. HortSci 27: 1205-1207.
Aybar, V, 2010. Floración en olivo (Olea europaea L.): evaluación del ajuste de un modelo predictivo para las condiciones del Chaco Árido Argentino y utilización de hormonas exógenas. University of Buenos Aires. MS Thesis.
Ayerza, R, Sibbett, S, 2001. Thermal adaptability of olive (Olea europaea L.) to the Arid Chaco of Argentina. Agric Ecosys Environ 84: 277-285. http://dx.doi.org/10.1016/ S0167-8809(00)00260-7
Badr, SA, Hartmann HT, 1972. Flowering response of the olive (Olea europaea L.) to certain growth regulators ap-plied under inductive and noninductive environments. Bot Gaz 133: 387-392. http://dx.doi.org/10.1086/336659 Bandelj D, Jakše J, Javornik B, 2004. Assessment of genetic
variability of olive varieties by microsatellite and AFLP markers. Euphitica 136: 96-102. http://dx.doi.org/10.1023/ B:EUPH.0000019552.42066.10
Bongi G, Palliotti A, 1994. Olive. In: Handbook of environmen-tal physiology of fruit crops (Schaffer B & Anderson PC, eds.). CRC Press, Boca Raton, FL, USA. pp: 165-187. Bonhomme R, 2000. Bases and limits to using ‘degree day’
units. Europ J Agron 13: 1-10. http://dx.doi.org/10.1016/ S1161-0301(00)00058-7
Caballero JM, Del Río C, 2008. The Olive World Germplasm Bank of Spain. Acta Hortic 791: 31-38.
Cesaraccio C, Spano D, Snyder RL, Duce P, 2004. Chilling and forcing model to predict bud-burst of crop and forest species. Agric For Meteorol 126: 1-13. http://dx.doi. org/10.1016/j.agrformet.2004.03.002
De Melo-Abreu JP, Barranco D, Cordeiro AM, Tous J, Ro-gado BM, Villalobos FJ, 2004. Modelling olive flowering date using chilling for dormancy release and thermal time. Agric For Meteorol 125: 121-127.
Denney JO, McEachern GR, 1983. An analysis of several climatic temperature variables dealing with olive repro-duction. J Am Soc Hort Sci 108: 578-581.
Denney JO, McEachern R, Griffiths JF, 1985. Modelling the thermal adaptability of the olive (Olea europaea L.) in Texas. Agric For Meteorol 35: 309-327. http://dx.doi. org/10.1016/0168-1923(85)90092-9
Fernández-Escobar R, Rallo L, 1981. Influencia de la po-linización cruzada en el cuajado de frutos de cultivares de olivo (Olea europaea L.) ITEA 45: 51-58.
Freese F. 1960. Testing accuracy. For Sci 6: 139-145. Galán C, García-Mozo H, Vázquez L, Ruiz L, Díaz de la
Guardia C, Trigo MM, 2005. Heat requirement for the onset of the Olea europaea L. pollen season in several sites in Andalusia and the effect of the expected future
2010). Benzyladenine (BA) application also did not lead to more flowering in olive cv. ‘Sevillano’ (Badr & Hartmann, 1972). Further experiments should be conducted to better understand the role of hormones in olive flowering.
Various aspects of olive tree response to global warming have been modelled for the Mediterranean Basin including flowering and other phenological stages (e.g., Osborne et al., 2000; De Melo-Abreu et al., 2004; García-Mozo et al., 2010), insect damage and olive yields (Ponti et al., 2014), and crop evapo-transpiration (Tanasijevic et al., 2014). It has been estimated that only fairly large changes in temperature (i.e., an increase of 3°C) would lead to a significant increase in abnormal flowering events for Spanish and Portuguese sites (De Melo-Abreu et al., 2004). A pre-liminary analysis of temperature data for Northwest Argentina indicates that temperature has increased by about 1°C during the Spring and Summer from 1962-2013 with no clear trend during the winter (R. De Ruyver, INTA- Castelar, pers. comm.). If such a trend holds over the coming decades in our region, it is likely that the accumulation of CU will not be greatly affected, while phenological stages during the Spring and Summer will be shortened.
In conclusion, the simulation model proposed by De Melo-Abreu et al. (2004) predicted normal flowering occurrence and flowering date with a good degree of certainty for cultivars with both low- and high-chilling requirements introduced to Northwest Argentina from the Mediterranean Basin. This suggests that although this model was developed in Spain and Portugal, it could be used as an approximate tool to determine whether the temperature regime in a proposed new growing region in South America, or elsewhere, is adequate for olive flowering and production.
Acknowledgements
The authors are grateful to Complejo Productivo Mediterráneo S.A., Agropecuaria El Bolsón S.A., Catsafe S.A., Palas Atenea S.A., and Compañía Agroindustrial de Pomán S.A. for providing access to their commercial orchards. Pacífico Ortiz, Jorge Amorena, Rodrigo Ahumada, Luis Prenol, Darío Montalván, Carlos Aranda, and Enrique Dalton of-fered technical advice. The Servicio Meterológico Nacional provided supplementary weather data and the Asociación Cultural para el Desarrollo Integral (ACDI) collaborated in the management and analysis of weather databases. VA held a graduate scholarship from INTA at the time of the study. MCR and PSS are members of CONICET.
ing in the Mediterranean. Plant Cell Environ 23: 701-710. http://dx.doi.org/10.1046/j.1365-3040.2000.00584.x Oteros J, García-Mozo H, Vázquez L, Mestre A,
Domínguez-Vilches E, Galán C, 2013. Modelling olive phenological response to weather and topography. Agric Ecosyst Environ 179: 62-68. http://dx.doi.org/10.1016/j.agee.2013.07.008 Pérez-López D, Ribas F, Moriana A, Rapoport HF, De Juan
A, 2008. Influence of temperature on the growth and development of olive (Olea europaea L) trees. J Hortic Sci Biotechnol 83: 171-176.
Pierantozzi P, Torres M, Lavee S, Maestri D, 2014. Vegetative and reproductive responses, oil yield and composition from olive trees (Olea europaea) under contrasting water availability during the dry winter-spring period in central Argentina. Ann Appl Biol 164: 116-127. http://dx.doi. org/10.1111/aab.12086
Ponti L, Gutierrez AP, Ruti PM, Dell’Aquila A, 2014. Fine-scale ecological and economic assessment of climate change on olive in the Mediterranean Basin reveals win-ners and losers. Proc Natl Acad Sci 111: 5598-5603. http:// dx.doi.org/10.1073/pnas.1314437111
Ramírez-Santa Pau M, Navarro C, Rallo L, 2002. Relation among flowering, fruitfulness and crop in ´Manzanilla de Sevilla´ olives. Acta Hortic 586: 317-319.
Sanz-Cortés F, Martínez-Calvo J, Badenes ML, Bleiholder H, Hack H, Llácer G, Meier U, 2002. Phenological growth stages of olive trees (Olea europaea). Ann Appl Biol 140: 151-157. http://dx.doi.org/10.1111/j.1744-7348.2002. tb00167.x
Searles PS, Agüero-Alcarás M, Rousseaux MC, 2011. El consumo de agua por el cultivo de olivo (Olea europaea L.) en el noroeste de Argentina: una comparación con la Cuenca Mediterránea. Ecol Austral 21: 15-28.
Tanasijevic L, Todorovic M, Pereira LS, Pizzigalli C, Li-onello P, 2014. Impacts of climate change on olive crop evapotranspiration and irrigation requirements in the Mediterranean region. Agric Water Manage 144: 54-68. http://dx.doi.org/10.1016/j.agwat.2014.05.019
Trujillo I, Ojeda MA, Urdiroz NM, Potter D, Barranco D, Rallo L, Muñoz Diez C, 2014. Identification of the World-wide Olive Germplasm Bank of Córdoba (Spain) using SSR and morphological markers. Tree Genet Genomes 10:141-155. http://dx.doi.org/10.1007/s11295-013-0671-3 Wilmott CJ, Ackleson SG, Davis RE, Feddema JJ, Klink KM,
Legates DR, O’Donnell J, Rowe CM, 1985. Statistics for the evaluation and comparison of models. J Geophys Res 90: 8995-9005. http://dx.doi.org/10.1029/JC090iC05p08995 climate change. Int J Biometeorol 49: 184-188. http://
dx.doi.org/10.1007/s00484-004-0223-5
García-Mozo H, Mestre A, Galán C, 2010. Phenological trends in southern Spain: A response to climate change. Agric For Meteorol 150: 575-580. http://dx.doi. org/10.1016/j.agrformet.2010.01.023
Gómez del Campo M, Morales-Sillero A, Vita Serman F, Rousseaux MC, Searles PS, 2010. Olive growing in the arid valleys of Northwest Argentina (provinces of Cata-marca, La Rioja and San Juan). Olivae 114: 43-65. Grossman YL, DeJong TM, 1994. PEACH: A simulation
model of reproductive and vegetative growth in peach trees. Tree Physiol 14: 329-345. http://dx.doi.org/10.1093/ treephys/14.4.329
Hartmann HT, 1953. Effect of winter chilling on fruitfulness and vegetative growth in the olive. Proc Am Soc Hortic Sci 62: 184-190.
Hartmann HT, Porlingis I, 1957. Effect of different amounts of winter chilling on fruitfulness of several olive varieties. Bot Gaz 119: 102-104. http://dx.doi.org/10.1086/335969 Malik NSA, Pérez JL, 2011. The effect of high temperature
interruptions during inductive period on the extent of flowering and on metabolic responses in olives (Olea
europaea L.). Sci Hortic 129: 207-212. http://dx.doi.
org/10.1016/j.scienta.2011.03.028
Motisi A, Fontana G, Zerilli V, Drago A, Dimino G, Ferri-gno G, 2008. Development of an olive phenological model in relation to air temperature. Acta Hortic 803: 167-174. Nelder JA, Mead R, 1965. A simplex method for function
minimization. Comput J 7: 308-313. http://dx.doi. org/10.1093/comjnl/7.4.308
Orlandi F, Lanari D, Romano B, Fornaciari M, 2006. New model to predict the timing of olive (Olea europaea) flowering: A case study in central Italy. New Zeal J Crop Hortic Sci 34: 93-99. http://dx.doi.org/10.1080/0114067 1.2006.9514392
Orlandi F, Sgromo C, Bonofiglio T, Ruga L, Romano B, Fornaciari M, 2010a. Spring influences on olive flowering and threshold temperatures related to reproductive struc-ture formation. HortSci 45: 1052-1057.
Orlandi F, Msallem M, Bonofiglio T, Ben Dhiab A, Sgromo C, Romano B, Fornaciari M, 2010b. Relationship between olive flowering and latitude in two Mediterranean coun-tries (Italy and Tunisia). Theor Appl Climatol 102: 265-273. http://dx.doi.org/10.1007/s00704-009-0239-1 Osborne CP, Chuine I, Viner D, Woodward FI, 2000. Olive