A high-throughput bioimaging
study to assess the impact of
chitosan-based nanoparticle
degradation on DNA delivery
performance.
Carla P. Gomes
a,b,c,1, Aida Varela-Moreira
a,b,d,1,2,Victoria Leiro
a,b, Cátia D.F. Lopes
a,b,d, Pedro M.D.
Moreno
a,b, Maria Gomez-Lazaro
a,b, Ana P. Pêgo
a,b,c,e,*aINEB – Instituto de Engenharia Biomédica, Universidade do Porto, Rua Alfredo Allen 208, 4200-135 Porto, Portugal
bi3S – Instituto de Investigação e Inovação em Saúde, Universidade do Porto, Porto, Portugal cFaculdade de Engenharia da Universidade do Porto, R. Dr. Roberto Frias, 4200-465 Porto, Portugal dFaculdade de Medicina da Universidade do Porto, Alameda Prof. Hernâni Monteiro, 4200-319 Porto, Portugal
eICBAS – Instituto de Ciências Biomédicas Abel Salazar, Universidade do Porto, Rua de Jorge Viterbo Ferreira 228, 4050-313 Porto, Portugal
1These authors contributed equally to this work
2Present address: Laboratory of Clinical Chemistry and Haematology (LCKH), University Medical Center Utrecht, Heidelberglaan 100, 3584 CX Utrecht, TheNetherlands
*Corresponding author at: INEB, Universidade do Porto, Rua Alfredo Allen 208,4200-135, Porto, Portugal.E-mail address:[email protected](A.P. Pêgo).
Originally published in Acta Biomaterialia, Volume 46, December 2016, Pages 129-140
https://doi.org/10.1016/j.actbio.2016.09.037
ABSTRAC
By using imaging flow cytometry as a powerful statistical high-throughput technique we investigated the impact of degradation on the biological performance of trimethyl chitosan (TMC)-based nanoparticles (NPs). In order to achieve high transfection efficiencies, a precise balance between NP stability and degradation must occur. We altered the biodegradation rate of the TMC NPs by varying the degree of acetylation (DA) of the polymer (DA ranged from 4 to 21%), giving rise to NPs with different enzymatic degradation profiles. While this parameter did not affect NP size, charge or ability to protect plasmid DNA, NPs based on TMC with an intermediate DA (16%) showed the highest transfection efficiency. Subsequently, by means of a single quantitative technique, we were able to follow, for each tested formulation, major steps of the NP-mediated gene delivery process –
NP cell membrane association, internalization and intracellular trafficking, including plasmid DNA transport towards the nucleus. NP cytotoxicity was also possible to determine by quantification of cell apoptosis. Overall, the obtained data revealed that the biodegradation rate of these NPs affects their intracellular trafficking and, consequently, their efficiency to transfect cells. Thus, one can use the polymer DA to modulate the NPs towards attaining different degradation rates and tune their bioactivity according to the desired application. Furthermore, this novel technical approach revealed to be a valuable tool for the initial steps of nucleic acid vector design.
Statement of Significance
By changing the biodegradation rate of trimethyl chitosan-based nanoparticles (NPs) one was able to alter the NP ability to protect or efficiently release DNA and consequently, to modulate their intracellular dynamics. To address the influence of NP degradation rate in their transfection efficiency we took advantage of imaging flow cytometry, a high-throughput bioimaging technique, to unravel some critical aspects about NP formulation such as the distinction between internalized versus cell-associated/adsorbed NP, and even explore NP intracellular localization. Overall, our work provides novel information about the importance of vector degradation rate for gene delivery into cells, as a way to tune gene expression as a function of the desired application, and advances novel approaches to optimize nanoparticle formulation.
Keywords:
Imaging flow cytometry; Nanoparticle degradation; Trimethyl chitosan; Nanoparticle intracellular trafficking; Gene delivery; Nanomedicine1. INTRODUCTION
The remarkable advances in molecular medicine and biology observed within the last decades have led to the development of promising therapeutic tools to be applied in the regenerative medicine field. These include the generation of nucleic acid-based approaches to correct defective proteins or to induce the expression of therapeutic proteins in situ [1]. An efficient gene vector has to be safe and capable of mediating the expression of the gene of interest for a sustained period of time, in a sufficiently large population of cells, to produce the desired biological effect. Due to their safer profile, non-viral vectors have drawn significant attention for regenerative medicine applications [2]. Among these, cationic polymers have been extensively explored, both in vitro and in vivo, for nucleic acid delivery as a result of their cationic nature, which favours both the interaction with nucleic acids and cell membranes [3], [4].
Chitosan (CH) is a cationic polymer that has been widely explored as a gene delivery vector [5]. However, despite being biocompatible and biodegradable, its poor solubility in physiological conditions has limited its widespread application. More recently, a CH derivative – trimethyl chitosan (TMC) – has been proposed for its improved solubility in a wide pH range [6]. Due to the quaternized amine groups, TMC has fixed positive charges, which enables the establishment of electrostatic interactions between the polymer and the negatively charged nucleic acids even at physiological pH [7], [8]. Previously, we have shown that the degradation profile of CH influences the biological activity of the resulting DNA-CH nanoparticles (NPs), namely in terms of their efficiency to transfect cells. Moreover, we established that the enzymatic degradation of the CH-based NPs was correlated with the polymer degree of acetylation (DA) [9]. Consequently, we advanced that the modulation of the
NP degradation profile could be an advantageous tool for the development of unique gene delivery vectors, in which one can tune the release rate of a gene of interest. Remain to be established if degradation is also a key parameter in the context of TMC NP-mediated plasmid DNA (pDNA) delivery.
In this study, we took advantage of imaging flow cytometry as a high throughput technique to evaluate the impact of the degradation rate of TMC-based NPs on their performance as a pDNA vector. The accurate quantification of NP cellular internalization, although critical for the clinical application of gene delivery systems, has been a challenge for many years [10], [11]. The accurate evaluation of NP uptake is difficult due to the strong adsorption of certain nanomaterials onto the cellular membranes. The most common methods used for NP internalization evaluation are flow cytometry or microscopy-based techniques, however, both of them have limitations. While the high throughput nature of traditional flow cytometry generates robust statistical data, it lacks spatial resolution, making the distinction between internalized from membrane-adsorbed NPs a challenge. Attempts to solve this problem have included the destruction of membrane-associated NPs followed by their removal through washes [13] or the measurement of fluorescence in the presence and absence of fluorescence quenchers with selective permeation characteristics [14], [15], among others. However, these methods are specific for certain types of NPs and/or fluorophores, making comparisons of data between studies difficult [11], [16]. Hence, “internalization” data can be misleading in terms of its impact on transfection efficiency. By combining both techniques, imaging flow cytometry provides an accurate high-throughput robust analysis tool of fluorescent signal intensities and spatial relationships between different structures and cellular features thus providing a reliable statistical quantification of NPs internalization [12], [13], [14]. Besides NP internalization kinetics, here we were capable to infer about NP intracellular behaviour through the quantification of the number of nanoparticle-loaded vesicles (NLV) per cell at different time-points. Moreover, we were able to evaluate the proximity of the internalized NPs to the cell nuclei, a parameter of great importance, as it can be associated to the NP transfection efficiency. In this way, with the use of a single technique, we assessed some of the most crucial parameters to the process of optimization of NP formulation.
2. Materials and methods
2.1. Polymers purification
Trimethyl chitosan (TMC) derived from ultra-pure chitosan was supplied by Kytozyme (Belgium) (lot VIHA0013-157). TMC was purified by filtration and dialysis, as previously described [15]. The original chitosan (CH), also provided by Kytozyme (Belgium; lot VIHA0018-019), was purified by precipitation according to a previously established protocol [16].
2.2. TMC deacetylation and re-acetylation
The purified TMC was deacetylated as previously described [17]. Briefly, the purified polymer was dissolved in a concentrated sodium hydroxide (NaOH) solution (47% w/v) and left to react for 2 h at 110 °C under a silicon bath. Next, the solution was placed under an ice bath and HCl with the same molarity as NaOH (11 M) was added drop wise for neutralization. The resulting polymer was dialyzed for three days against deionized water and then freeze dried (Labconco, USA). TMC with a higher DA was obtained by re-acetylation of deacetylated TMC accordingly to a previously described procedure
[18]. The reaction was performed using acetic anhydride as acetylating agent and 1,2-propanediol as co-solvent. The molar ratio of acetic anhydride per free amine groups added was of 0.18 and was extrapolated from a graphic described elsewhere [18], considering 20% the aimed percentage of acetylation. The acetylated polymer was precipitated by addition of methanol/diethyl ether (2:1), recovered by centrifugation and washed three times with ethanol. Subsequently, the polymer was dialyzed and freeze dried as described above.
2.3. Polymer characterization
Proton nuclear magnetic resonance (1H NMR) was performed to evaluate polymer degree of acetylation (DA) and TMC degree of quaternization (DQ). All polymer samples were dissolved in D2O (5 mg·ml−1) at 60 °C overnight and further analysed in a digital spectrometer (Bruker Advance III 400, UK) at room temperature (RT) with a total of 200 scans. The % DA was calculated according to Mourya et al. [6] and the % of DQ was calculated following the equation reported by Curti and Campana-Filho [19]. Gel permeation chromatography (GPC) was used to determine polymer molecular weight. The modular system employed was composed by an isocratic pump + autosampler + vacuum degasser module (Viscotek GPC Max VE 2001 GPC solvent/sample module), a viscometer/right angle laser light scattering (RALLS) dual detector (T60 Viscotek), and a refractive index detector (K-5002 Knaeur) operating at the same wavelength as the RALLS detector (670 nm). Separations were performed in a set of PL aquagel-OH mixed columns. Measurements were performed in 0.33 M NaCH3COOH/0.28 M CH3COOH eluent at a flow rate of 1 ml·min−1. Sample concentration in a 0.1–0.2% (w/v) range and an injection volume of 100 μl were applied. Dextran and pullulan were used as broad and narrow standards, respectively. All measurements were performed in triplicate, at RT.
Endotoxin levels of the purified polymer extracts were assessed using the Limulus Amebocyte Lysate Assay (QCL-1000, Cambrex Bio Science, USA), following the manufacturer instructions.
2.4. Plasmid DNA
The pDNA used encoded for the enhanced Green Fluorescent Protein and Luciferase (eGFP and Luc; pCMV-eGFPLuc, 6.7 kb, Invitrogen) genes. Plasmid was produced in a DH5α competent E. coli strain and purified using an EndoFree Plasmid Giga Kit following the manufacturer instructions (Qiagen, Germany). Plasmid concentration and purity were assessed by UV spectroscopy (Nanodrop 1000, Thermo Scientific, USA). Only plasmid solutions with an absorbance (260/280 nm) ratio comprised between 1.8 and 2.0 were used.
2.5. Nanoparticle preparation
TMC polymers were allowed to hydrate overnight in 5 mM HCl aqueous solution at a final concentration of 0.5% (w/v). Afterwards, 40 mM HEPES with 10% (w/v) glucose, pH 7.4 was added in order to attain a final solution at 0.25% (w/v) in 20 mM HEPES with 5% (w/v) glucose, pH 7.4. CH solutions were prepared in 5 mM acetate buffer, pH 5.5, as previously described [20]. Subsequently, solutions were filter sterilized and final polymer concentration was assessed by a colorimetric assay using Cibacron® Brilliant Red (Sigma-Aldrich, USA), as previous described [15]. NPs were prepared by mixing, while vortexing, equal volumes of pre-heated (55 °C for 10 min, Thermomixer®) pDNA solution (1 mg·ml−1) and either CH (0.1% (w/v)) or TMC solutions (0.25% (w/v)). CH- and TMC-based
NPs were allowed to stabilize for 15 min at RT before further use. NPs were prepared with 4 μg of pDNA at N/P molar ratios ranging from 1 to 18 to assess the best ratio regarding transfection efficiency in ND7/23 cells (Supplementary Fig. S1). The N/P ratio refers to the amount of positive moles from the polymer (N) (primary amine groups for CH and quaternized amine groups for TMC) to moles of pDNA phosphate groups (P). Since the TMC16 NPs presented a higher performance at the N/P ratio of 15, this ratio was chosen for all experiments throughout the study.
2.6. Determination of average hydrodynamic size and zeta
potential
Nanoparticle hydrodynamic mean diameter and zeta potential were determined using a Zetasizer Nano Zs (Malvern Instruments, UK) following the manufacturer instructions. NPs were prepared as mentioned above and then diluted 6 times in Dulbecco’s Modified Eagle Medium (DMEM) with Glutamax™, 10% (v/v) heat inactivated (55 °C) foetal bovine serum (FBS) and 1% (v/v) penicillin/streptomycin, all supplied by Gibco (Thermo Fisher Scientific, USA), and left to stabilize for 30 min prior to NP size and surface charge determination, using a high concentration cell (ZEN1010, Malvern Instruments, UK). CH and TMC-based NP size and surface charge were also measured in 5 mM acetate buffer pH 5.5 and 20 mM HEPES buffer with 5% (w/v) glucose pH 7.4, respectively (Supplementary Table S1). Size measurements were performed at 25 °C at a 173° scattering angle in the automatic mode, and the mean hydrodynamic diameters were determined by cumulant analysis (Z-average mean). The calculated zeta potential of the NPs was determined by laser Doppler velocimetry (LDV) and phase analysis light scattering (M3-PALS) at 25 °C. The software used was DTS Nano version 7.11, supplied by the manufacturer (Malvern Instruments, UK).
2.7. pDNA condensation efficiency and nanoparticle stability
Plasmid DNA condensation efficiency was assessed through the SYBR Gold® (Life Technologies, Thermo Fisher Scientific, USA) exclusion assay. NPs were prepared with a pDNA concentration of 25 ng·μl−1 (in a final volume of 100 μl). Afterwards, 20 μl of NPs were added to a black-walled 96-well plate (Greiner bio-one) containing 198 μl of either their buffer of preparation (testing their ability to condense pDNA after preparation) or in complete DMEM medium (to investigate NP stability in cell culture conditions). Finally, 2 μl of a 10,000× diluted (Tris-acetate-EDTA – TAE Buffer) SYBR® Gold solution was added to each well in order to reach a final volume of 200 μl. After 10 min incubation with continuous plate mixing, fluorescence was measured (λexc = 485 nm, λem = 540 nm). A pDNA standard curve was performed in each experiment, using a series of pDNA dilutions (Supplementary Fig. S2). The amount of free pDNA (not complexed with the polymer) for each well was calculated based on the equation obtained by the linear regression of the pDNA standard curve. Results are expressed as relative percentage of complexation where 100% means pDNA is totally complexed with polymer in NPs, and 0% means that all pDNA is free (not complexed with the polycation). Samples with the same mass ratio of polymer without DNA were used as control in order to subtract any polymer background fluorescence.2.8. Nanoparticle enzymatic degradation study
Nanoparticle enzymatic degradation was assessed by an indirect method, previously set up by our team [9]. CH or TMC-based NPs were prepared with a fixed mass ratio, independently of the polymer DA, and incubated with lysozyme (from chicken egg white) in the presence of a fluorogenic substrate
– 4-methylumbelliferyl b-d-N,N ′,N″-triacetylchitotrioside (MU-[GlcNAc]3) (both from Sigma Aldrich, USA). The enzyme substrate was dissolved in CH3COONa (1 M, pH = 5.5):H2O:dimethylformamide (1:1:1). The freshly prepared NPs, the lysozyme and the prepared fluorogenic substrate solution were added to a 96-well plate in order to obtain a final molar ratio of 3.5:0.45:1.2 (lysozyme:substrate:NPs). After 1, 2, 4, 8 or 12 h of reaction at 37 ºC under 70 rpm, NaOH was added at a final concentration of 0.05 M to stop the reaction and the fluorescence resultant from substrate enzymatic degradation was measured (λexc = 360 nm; λem = 455 nm). Results are expressed as relative fluorescence percentage normalized to the positive control (maximum fluorescence emission by the fluorogenic substrate).
To compare the degradation kinetics of the developed formulations, a non-linear fitting of the degradation data was performed by using the one phase decay equation model with the GraphPad Prism 6.0 software. By using this fitting model, we were able to infer about the rate constant of NPs degradation (k), expressed in reciprocal values of the X axis time units. Additionally, the degradation span (difference between initial time and plateau) was also computed and expressed as % of fluorescence.
2.9. Cell culture
For the in vitro assays, a sensorial neuron cell line model was used. The ND7/23 (mouse neuroblastoma (N18 tg 2) × rat dorsal root ganglion neuron hybrid) cell line was obtained from ECACC. The cells were routinely cultured in complete DMEM medium (with serum and antibiotics) and maintained at 37 °C in a 5% CO2 humidified incubator. Cells were routinely tested for mycoplasma by standard PCR.
2.10. Transfection studies
ND7/23 cells were seeded into 24-well plates at a cell density of 2 × 10⁴ viable cells per cm2, 24 h prior to incubation with NPs. TMC-based NPs were prepared at N/P ratio of 15 with 2 μg of pDNA per cm2 and suspended in complete DMEM medium (with serum and antibiotics), in a 1:6 dilution prior to addition to cells. NPs based on poly(ethylene imine) with 25 kDA (Sigma-Aldrich) were prepared at N/P ratio of 3 using the same amount of pDNA as the TMC-based NPs. Lipofectamine® 2000 (ThermoFisher Scientific) was used according to the manufacturer instructions. 24 h post-incubation the cell media was removed, and 1 ml of fresh complete DMEM medium was added to each well. Cells were incubated for an additional 48 h period, with daily renewing of the culture media. In the transfection studies using chloroquine (CQ), a final concentration of 100 μM of the reagent was used. CQ was added to cells 20 h post NP incubation to promote endolysosomal escape of NPs. Four hours after addition of CQ to cells, cell medium was replaced with fresh medium and cells were incubated for an additional 48 h period, with daily renewing of the culture media. At the defined time point (72 h post-incubation with NPs), cells were trypsinized and processed for flow cytometry for eGFP expression determination. Twenty thousand gated events were taken for each replicate and analysed using FACS Calibur flow cytometer (BD Biosciences). The resulting data was analysed using FlowJo software (version 10, FLOWJO, LLC). Untreated cells were used as negative control.
2.11. Nanoparticles internalization and intracellular localization
studies by imaging flow cytometry
Cells were seeded into 6-well TCPS plates (Greiner bio-one) at a cell density of 2 × 10⁴ cells per cm2 24 h prior to incubation with NPs in complete DMEM medium, as previously described. pDNA was labelled with YOYO®-1 (Invitrogen) as indicated by the manufacturer. CH or TMC-based NPs were prepared at N/P ratio of 15 with 2 μg of pDNA per cm2 and incubated with cells from 0.5 h to 24 h, at 37 °C. Afterwards, cells were trypsinized, fixed with 4% paraformaldehyde (PFA) and centrifuged to obtain a pellet of about 105 cells in 50 μl. Cell images were acquired using an ImageStreamX multispectral imaging flow cytometer (Amnis, EDM Millipore, Darmstadt, Germany), collecting 10,000 events per sample at 40× magnification. A 488 nm wavelength laser was used to excite YOYO®-1 and DRAQ5™. The fluorescence images were collected using the 480–560 nm and 660– 745 nm spectral detection channels, respectively. For double stained cells, single stained controls were used to compensate fluorescence between channel images on a pixel-by-pixel basis. Cell images were analysed using IDEAS® image-analysis software version 6.0 (Amnis, EDM Millipore, Germany). To discriminate internalized versus membrane-associated NPs, a mask representing the whole cell was defined by the bright-field image, and an internal mask (cytoplasm) was defined by eroding the whole cell mask by 5 pixels (each pixel being equivalent to 0.5 μm). The external region was determined by dilating the mask by 2 pixels and subtracting the internal mask (cytoplasm), which results in the mask for the cell membrane. Comparison of the fluorescence detected inside the internal mask with the whole cell fluorescence enabled the determination of the internalization score (IS). These values were calculated using the IDEAS® software, as previously described [12].
The number of nanoparticle-loaded vesicles (NLV) per cell was determined using images acquired with the Extended Depth of Field [21]. To determine the number of NLV per cell, a mask was created in order to identify the fluorescence intensity peaks at least 4-fold greater than the background. The number of individual vesicles in a cell was enumerated using the Spot Count feature from IDEAS® software, and plotted in frequency histograms.
To assess NLV proximity to the nuclear vicinity, the degree of pixel intensity correlation between the labelled pDNA and nuclear DNA of each cell was analysed. For this purpose, cells were incubated with DRAQ5™ (6.25 μM) (BioStatus, UK) prior to acquisition on the imaging flow cytometer. Nuclear proximity was also evaluated from 0.5 h to 24 h. To measure the presence of YOYO®-1 in the nuclear vicinity, the Similarity feature of IDEAS® software was used [22]. In order to identify the pixels from nucleus, a nuclear mask was created by the user taking into account the fluorescent intensity of DRAQ5™ in its respective detection channel. Gating for nuclear localization events was decided based on visual inspection of histogram bins; the translocation gate was the same for each sample within an experiment.
2.12. Transmission electron microscopy
Cells were seeded as previously described for internalization studies. pDNA and TMC were labelled with FluoroNangold™ and Quantum Dots (QDs), respectively. pDNA was biotinylated with Label IT® Biotin Labelling Kit (Mirus Bio, USA) according to the manufacturer’s instructions. Subsequently, biotinylated pDNA was reacted with Streptavidin-FluoroNanogold™ (Nanoprobes, USA) according to the manufacturer’s instructions. TMC was conjugated with QD705 bearing a carboxylic via EDC (Sigma-Aldrich, USA) as coupling agent. Briefly, TMC solution (10 mg·ml−1 in PBS) was activated by adding EDC at the mole ratio of 567:1 (EDC:TMC). Afterwards, carboxyl-QD705 solution (Life Technologies, USA) (final concentration of 0.09 μM) was slowly added to the activated TMC and stirred for 2 h at RT in the dark. Unconjugated QDs were removed by centrifugation at 10,000 rpm
for 10 min using an ultrafiltration filter tube (MWCO: 30 kDa, Millipore, USA). The purified TMC-QD solution was stocked at 4 °C until further use.
2.13. Apoptosis analysis by imaging flow cytometry
ND7/23 cells were seeded in 6-well plates, as previously described. After 24 h, cells were incubated with CH or TMC-based NPs at N/P ratio of 15 in the presence of complete DMEM medium (with serum and antibiotics). Twenty-four hours later, cells were fixed with 4% PFA, washed three times with PBS and incubated with fluorescent DNA-binding dye DRAQ5™ and imaged on the ImageStreamX system, collecting 10,000 events per sample at 40× magnification. A 488 nm wavelength laser was used to excite DRAQ5™ and the fluorescence images were collected using the 660–740 nm spectral detection channel. Apoptotic cells were identified using two standard image-based features from the IDEAS® software: Area and Spot Small Total. Untreated cells were used as negative control.
2.14. Cell metabolic activity assay
To determine cell viability, a resazurin-based assay was used [23]. After 4 h of incubation at 37 °C, 200 μl of medium was transferred to a black-walled 96-well plate (Greiner bio-one) and fluorescence was measured (λexc = 530 nm, λem = 590 nm). Cell viability was assessed 72 h after incubation of NPs with cells. Results are expressed as percentage of metabolic activity of treated cells relative to untreated cells.
2.15. Statistical analysis
Statistical analysis was performed using GraphPad Prism 6.0. Results are presented as mean ± standard deviation (SD) of at least three independent experiments. The D’Agostino-Pearson omnibus test was used to confirm the Gaussian distribution of data. Afterwards, one or two-way ANOVA with different post-tests for multiple comparison analysis were used as mentioned in each figure. Results were considered statistically significant when p < 0.05.
3. Results
3.1. Polymer characterization
In order to investigate the influence of polymer DA on the degradation profile of the TMC-based NPs, the original purified TMC was deacetylated and then re-acetylated. The unmodified CH (starting material for the TMC synthesis) was used as control. The results obtained from the polymer characterization are presented in Table 1. As expected, the original TMC polymer presented a DA value similar to the unmodified CH, which was 16%. After TMC chemical modification, a final DA value of 4% was achieved for the deacetylated polymer, whereas for the re-acetylated polymer, a value around 21% was attained.
The average number molecular weight (Mn) of the purified materials was found to be 43.3 ± 5.5 kDa for TMC16 and 37.3 ± 5.9 kDa for CH16. The selection of this Mn was based on previous studies that have shown that chitosan’s with an intermediate Mn are better suited for pDNA gene delivery, as chitosan-based polymers with molecular weight ⩾17 kDa form more compact NPs and better protect pDNA from endonuclease degradation; on the other hand, a Mn value above 50 kDa has shown to
hinder the release of pDNA from the polymer matrix [24]. GPC analysis confirmed that the applied reaction conditions for TMC modification did not lead to the hydrolysis of the polymeric chains, as no statistically significant differences were found between the deacetylated and re-acetylated polymer (TMC21) and the original one (TMC16). Endotoxin levels from the polymer extracts were found to be <0.1 EU·ml−1, respecting the US Department of Health and Human Services guidelines for implantable devices [25].
3.2. Nanoparticle physicochemical characterization
The physicochemical properties of CH or TMC-based NPs were evaluated in terms of hydrodynamic average size, polydispersity index (PdI), surface charge (zeta potential) and pDNA condensation efficiency. For the as prepared NPs, no significant differences were observed in terms of size, PdI and surface charge (see Supplementary Table S1), with all NPs presenting average sizes below 205 nm, low PdI values (<0.2) and positive surface charges (⩾ +15 mV). To mimic cell culture conditions, NP average size, PdI and surface charge were evaluated after a 6-fold dilution in complete DMEM medium (pH 7.4). Under these conditions, all the produced TMC-based NPs remained stable, presenting sizes below 191 nm, independently of the polymer DA (Table 2). On the contrary, CH16 NPs presented a significantly higher average hydrodynamic size (∼400 nm) and PdI (greater than 0.5). TMC-based NPs also maintained their positive surface charge with zeta-potential values above +10 mV, whereas CH16 NPs surface charge was close to neutrality (−0.9 mV). Moreover, the intensity versus size profile obtained before (acetate or HEPES buffer) and after NPs dilution in DMEM medium with serum clearly showed that CH NPs do not present the same colloidal stability as TMC-based NPs in cell culture conditions (Fig. 1). In the case of TMC-based NPs, no significant differences were seen in the size profiles before and after NPs dilution in medium with serum (Fig. 1b). On the contrary, in the case of CH NPs an increase of the maximum intensity peak width and a shift toward increased sizes was seen, with the appearance of small peaks between 1,000 and 10,000 nm, which indicates the presence of polymer agglomerates (Fig. 1a).
We next assessed the efficiency of CH16 and TMC-based polymers to condense pDNA by incubating the NPs in the presence of a nucleic acid intercalating dye (SYBR® Gold, Invitrogen). To the best of our knowledge, this is the first time that SYBR® Gold is used as a quantitative measurement for the assessment of the NPs ability to condense nucleic acids. The obtained results show that once prepared, all polymers were able to complex approximately 90% of the pDNA (Supplementary Table S2). However, after incubation in complete DMEM medium CH16 NPs release about half of the initially complexed pDNA. Contrariwise, TMC-based NPs remain stable and maintain all the originally complexed pDNA (Table 2).
3.3. Nanoparticle enzymatic degradation and transfection
efficiency
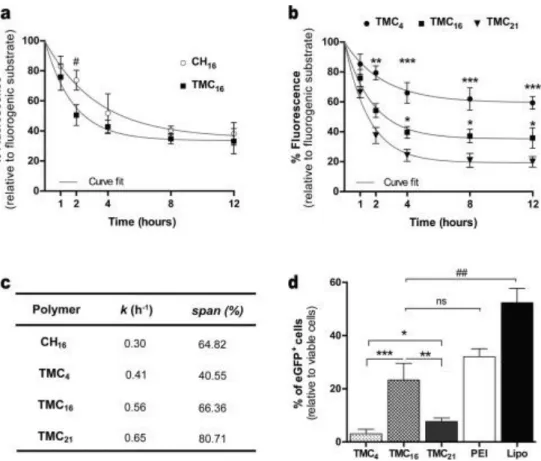
To evaluate the biodegradation of TMC-based NPs, a lysozyme-based assay previously setup by our team was used in which the competition for lysozyme between a fluorogenic substrate (MU-[GlcNAc]3) and the NPs under investigation is explored [9]. First, we compared the biodegradation profile of TMC16 and CH16 NPs (prepared with the same polymer mass). As depicted in Fig. 2a, after incubation of NPs in the presence of MU-[GlcNAc]3 for a 12-h period, a decrease in the fluorescence intensity is observed for both formulations. At the time point of 2 h, a statistically significant fluorescence reduction is observed in the case of TMC16 NPs, however, after this time period no
statistical differences were observed between the two polymeric NPs. This data indicates that while TMC16 NPs degrade to the same extent as the CH16 NPs, the former degrade at a slightly higher rate in the initial hours of reaction, indicating that the complexation of the polymer with the NAs does not alter the biodegradation behaviour of the polymers. These results were also corroborated by fitting the data with the exponential decay equation model (Fig. 2c). Using this model, a significant lower degradation rate (k) for CH16 NPs was determined, when compared to TMC16 NPs. However, the degradation span is similar between both formulations. Afterwards, we evaluated the influence of polymer DA on TMC-based NP biodegradation. Enzymatic degradation of TMC NPs with different DA was also evaluated for a 12 h incubation period with lysozyme (Fig. 2b). As previously reported for CH NPs [9], TMC-based NP enzymatic degradation is influenced by the polymer DA. A positive correlation between polymer DA and NP degradation rate as well as degradation span was observed (Fig. 2c). Among the tested TMC-based polymers, TMC4 NPs were the ones that degraded at a slower rate and to the lowest extent, while TMC21 showed the opposite results. Furthermore, with the time course of the degradation study a plateau value was reached for all formulations. This effect is probably related to the fact that at least 3–4 acetylated units are required in the hexameric binding pocket for lysozyme to allow enzymatic cleavage [26]. Since these domains are destroyed through cleavage of the glycosidic bond [26], [27], degradation by lysozyme occurs till a certain molecular weight depending on the DA of the polymer [28].
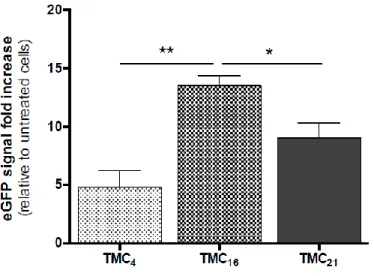
Unlike other polymeric vectors that have endosomal buffering capacity and act as proton sponges, in the case of chitosan-based vectors their buffering capacity is limited and their degradation products (oligo- and monosaccharides) are the entities responsible for the increase in osmolarity, which results in water influx and subsequent swelling and rupture of vesicular membranes [29], [30]. Since chitosan degradation strongly influences the ability of chitosan-based vectors to release pDNA, we next evaluated the impact of TMC-based NPs degradation rate on their biological performance as gene transfer vectors (Fig. 2d). Among TMC polymers, TMC16 presented a statistically significant higher percentage of transfected cells (Fig. 2d). TMC4 and TMC21 showed to be less efficient, transfecting only 3% and 8% of cells, respectively. The transfection activity was also determined as the eGFP fluorescence level fold increase relative to untreated cells (Supplementary Fig. S4). Similarly, the TMC16 NP formulation was the one to mediate the highest eGFP expression. Poly(ethylene imine) (PEI) with 25 kDa (Sigma-Aldrich) and Lipofectamine® 2000 (ThermoFisher Scientific), both well-known and widely used commercial available transfecting agents, were used as positive controls (Fig. 2d). We did not observe any significant difference when comparing the transfection efficiency of TMC16 with PEI (both polymeric NPs). On the contrary, the use of Lipofectamine® 2000 resulted in a ∼1.5-fold change in the percentage of transfected cells, when comparing to TMC16 NPs. Nonetheless, the use of this lipid-based commercial agent resulted in a statistically significant increase in cellular toxicity (Supplementary Fig. S5). The percentage of ND7/23 cells transfected using naked pDNA (without any vector) was virtually zero (data not shown), presenting similar values to those of the negative control (untreated cells).
3.4. Nanoparticle internalization profile and kinetics
To understand the extent of the impact of biodegradation on transfection efficiency we further proceeded with the study of the intracellular trafficking pathway of the developed NPs. By using imaging flow cytometry instead of conventional flow cytometry we aimed at gaining quantitative information on the number of cells with internalized NPs as a function of time, as well as on the NA cargo present in each cell treated with different NP formulations. For this purpose, pDNA was
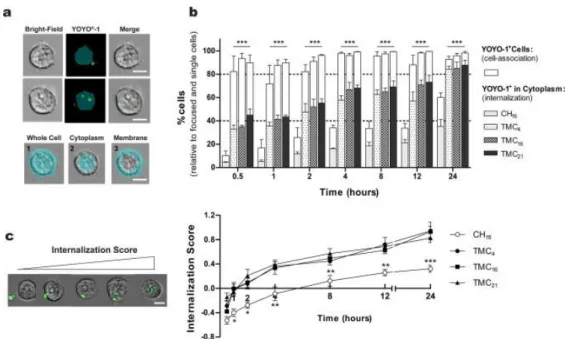
fluorescently labelled with YOYO®-1 (Invitrogen). For the distinction between the percentage of cells with internalized NPs (cytoplasm) versus the ones that were YOYO®-1 positive (cytoplasm and membrane-associated NPs), a mask representing the whole cell was defined by the bright-field image, and an internal mask was set by eroding the whole cell mask by 5 pixels (2.5 μm) in order to eliminate the fluorescent signal resulting from membrane-associated NPs (Fig. 3a).
The results from the uptake studies (Fig. 3b) showed considerable differences between CH- and TMC-based NPs. Moreover, it showed significantly differences between the percentage of YOYO®-1 positive cells (white bars) and the percentage of cells with internalized pDNA (patterned bars) for all formulations. In the case of TMC-based NPs, as early as 0.5 h after NP incubation, more than 80% of cells were positive for YOYO®-1, a value that kept unaltered with time. However, by discriminating the cells with labelled pDNA in the cell cytoplasm, one can find that the amount of pDNA internalized steadily increased over time. At 0.5 h, already 40% of cells internalized NPs, a value that significantly increased to more than 80% after 24 h of contact. The similar internalization behaviour observed among TMC NPs is not unexpected since no significant differences were observed in terms of size or surface charge between NP formulations. The internalization process of CH-based NPs was found to be less efficient. Independently of the time point, the percentage of YOYO®-1 positive cells was lower and, even after a 24 h incubation period the total amount of cells which effectively internalized pDNA was only 35% of the total cell population. This behaviour can possibly be ascribed to differences on NP net charge. At physiological pH, CH NPs present a charge close to neutrality (Table 2), which may hamper the process of NP cell association and internalization. Moreover, these NPs presented higher average sizes and lower colloidal stability in relation to the TMC-based NPs, which might also negatively influence the internalization process.
The internalization score (IS), defined as the ratio of fluorescence intensity inside the cell to the total fluorescence intensity of the cell [31], was also calculated. A positive value of IS corresponds to a cell with mostly internalized NPs, whereas a negative IS value corresponds to a cell with mostly membrane-associated NPs. The mean values of IS for CH and TMC-based NPs along the 24 h internalization study are presented in Fig. 3c. From 1 h of incubation onwards, statistically significant different IS values were found for CH16 and TMC-based NPs. In the case of CH16 NPs, only after 8 h of incubation with cells was reached a positive IS value, while cells treated with TMC-based NPs present positive IS values after 2 h of contact. No significant differences were observed among the TMC-based NPs tested, indicating that the polymer DA did not altered the kinetics of the internalization process.
Overall these results further corroborate that CH NPs are not as efficiently internalized by the cells as TMC NPs, indicating that CH16 NPs are not only internalized by a lower number of cells but also at a lower rate.
3.5. Cellular distribution of nanoparticle-loaded vesicles
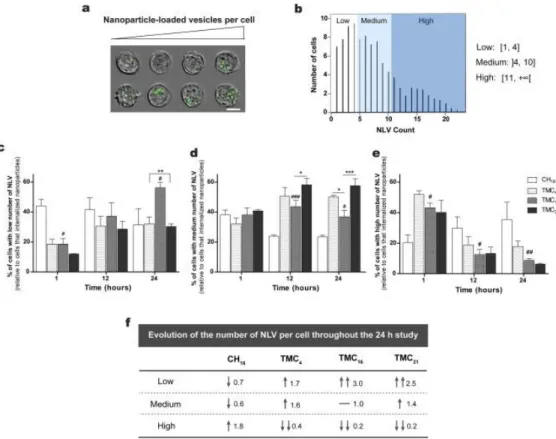
An additional advantage of using imaging flow cytometry is the possibility to quantify the number of nanoparticle-containing vesicles per cell, as well as to localize molecules of interest in intracellular compartments or its vicinity. Although imaging flow cytometry lacks resolution for single NP identification, it enables the detection of NP clusters within individual vesicles (endosomes or lysosomes) inside the cell, the so-called nanoparticle-loaded vesicles (NLV) [32]. Masking of the cell images allowed cluster identification (representative images in Fig. 4a) and transformation of the
intensity histograms to NLV count distributions (Fig. 4b). By following this parameter as a function of time, we were able to gain further insights on NP distribution and intracellular trafficking after internalization.
Three groups with low (Fig. 4c), medium (Fig. 4d) or high (Fig. 4e) number of NLV were gated among the cells that internalized NPs. The obtained results reveal that for TMC NPs, already after 1 h of incubation, a high percentage of cells (greater than 40%) had a high number of NLV (greater than 11 per cell) (Fig. 4e). Contrariwise, in the case of CH NPs, the percentage of cells with high NLV was significantly lower (∼20%). Moreover, while in the case of TMC NPs the percentage of cells with high number of NLV is decreasing with time, suggesting that these NPs are being released from the vesicles where they are entrapped, in the case of CH this percentage is increasing along the 24 h study.
Regarding the TMC-based NPs, it was observed an increase in the percentage of cells with low number of NLV and a decrease in the percentage of cells with high number of NLV. However, the observed variations were different among TMC polymers (Fig. 4f). The percentage of cells with medium number of NLV increased in the case of TMC4 and TMC21 NPs, whereas for TMC16 NPs it remains constant. After 24 h, more than 50% of cells incubated with TMC16 NPs presented a low number (<4) of NLV, whereas for the other formulations the majority of cells had between 5 and 10 NLV per cell. These results suggest that TMC16 NPs are somehow being more efficiently released from the endolysosomal compartment, which may explain their higher transfection efficiency. To further confirm this hypothesis and infer about the amount of NPs localized in endo- or lysosomes, a transfection assay in the presence of chroloquine (CQ), a well-known disruptor of the endolysosomal vesicles, was performed (Supplementary Fig. S6). After NPs incubation with cells for 20 h, CQ was added in a final concentration of 100 μM for a total period of 4 h. The obtained results confirm that both TMC4 and TMC21 NP formulations end up entrapped in the endocytic compartment, as their incubation in the presence of CQ resulted in a ∼4-fold increase in their cell transfection efficiency. TMC16 NPs also suffered from an increase in transfection efficiency after CQ incubation, although this increment was only of 0.8-fold. Moreover, no significant differences were found in the transfection efficiency of TMC16 versus TMC21 NPs after incubation with CQ, which clearly indicates that the previous observed differences arise from TMC21 less effective escape from the endolysosomal pathway. This difference may result from the different degradation rates of the developed NPs, being an intermediate rate of degradation necessary for an increased protection of pDNA during the endolysossomal pathway and/or a more efficient escape of the NPs from the endocytic vesicles.
To validate the assumption that the NPs under study are trafficked through the endolysosomal compartment, transmission electron microscopy of the cells incubated for 4 h with TMC-based NPs was performed (Supplementary Fig. S7).
3.6. Nanoparticle-loaded vesicles localization in the nuclear
vicinity
The percentage of cells with NLV in the vicinity of the cell nucleus was determined from 0.5 to 24 h incubation with NP formulations prepared with YOYO®-1 labelled pDNA and subsequent staining of cell nuclei with DRAQ5™ (Fig. 5a). The similarity feature of the IDEAS® software was applied in the quantification of the extent of pDNA nuclear translocation. This allows the quantification of the correlation between two spectrally distinct images of a single cell and is derived from the Pearson’s
correlation coefficient of the pixels intensities of the image pair [22]. The similarity score was calculated for cells both positive for 1 and DRAQ5™ (Fig. 5b). The positive region on YOYO®-1/DRAQ5™ similarity histograms represents the region of images that correlate positively (Fig. 5c). Using this analytical approach, we were able to assess the variations regarding the localization in the nuclear vicinity of the NPs under study. Over the 24 h study, one observed for all tested NPs a steady increase in the number of cells with NLV localized in the perinuclear region (data not shown), supporting the described movement of the endocytic vesicles towards the microtubule-organizing centre close to the cell nucleus [33]. After 24 h of incubation, cells treated with CH16 NPs presented the lower extent of NLV in the nuclear vicinity (Fig. 5d). Since at this time point around 35% of cells that internalized CH16 NPs have a high number of NLV, these results indicate that only one third of these NLV are being transported to the nuclear vicinity. The remaining NLV could be either in the transport pathway towards the nuclei vicinity or being recycled to the cell membrane [34]. In the case of TMC-based NPs, the data indicates that NLV localization in the nuclear region was maximum for the TMC16 NPs, more than 30% of internalized pDNA being in the nuclear vicinity, although no significant differences were found between the polymers with the highest DA (TMC16 and TMC21). Bishop and co-workers have also reported an approximately percentage of pDNA nuclear association between 10 and 40, depending on the amount of time that the cells (gliobastoma cells derived from human primary brain cancer) were exposed to the NPs [35]. Also, the NLV quantification in the nuclear vicinity corroborate the transfection efficiency data, since the NPs that mediate the arrival of higher amount of NA to the nuclear vicinity are also the most efficient to transfect cells.
3.7. Nanoparticle cytotoxicity
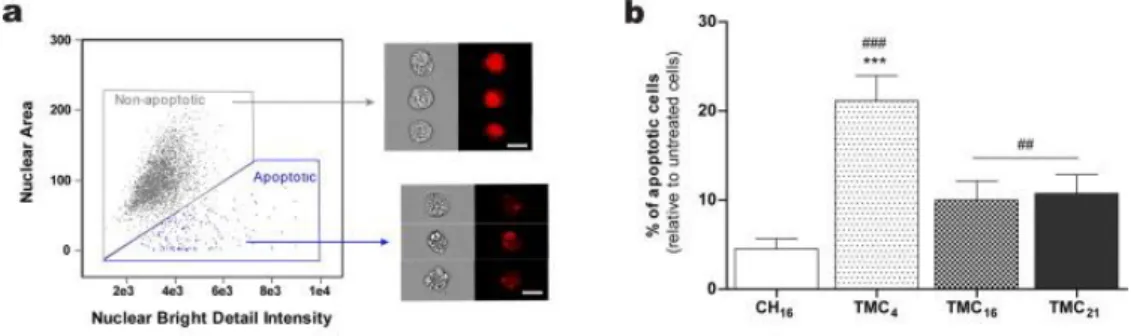
Another important consideration to take into account when designing a non-viral gene delivery vector concerns their safety profile. Taking advantage of the nuclear labelling with DRAQ5™, we were also able to evaluate cell apoptosis 24 h post-incubation with the NPs by imaging flow cytometry (Fig. 6). A consistent distinguishing feature of the apoptotic process is nuclear condensation and DNA fragmentation. Apoptotic nuclei stained with fluorescent DNA intercalating dyes typically produce small, fragmented, highly textured nuclear images (Fig. 6a). Because of this characteristic morphology, apoptotic nuclei are ideally suited for analysis with this technique [36], [37].
CH16 NPs had a negligible effect on cell apoptosis (no statistical differences were observed in relation to untreated cells). For the cells treated with the TMC-based NPs, a significant increase in cell apoptosis was observed, TMC4 NPs being the ones causing the highest detrimental effect, although it only affected approximately 20% of cells (Fig. 6b).
The results from imaging flow cytometry are in accordance with the data obtained from the cytotoxic evaluation based on the determination of metabolic activity by a resazurin-based method (Supplementary Fig. S5). The metabolic activity of the cells was measured 72 h after transfection and the most detrimental effect corresponded to a 29% decrease in cell viability for cells treated with TMC4 NPs. This effect may be a consequence of the higher amount of positively charged moieties present in this polymer or due to an increased NP accumulation inside the cells, since these NPs have also the lowest biodegradation capacity.
The presented data disclose important information regarding how NP extracellular and intracellular stability impacts the overall transfection process. When it comes to the design of non-viral gene delivery vehicles, a high number of extra- and intracellular obstacles must be overcome, and therefore it is particularly important to coordinate various functionalities of the polymeric vehicles in order to enhance their transfection efficiency. In a recent study, Bishop et al. have described cellular uptake as the limiting barrier for efficient non-viral vectors gene delivery [35], and therefore the formation of stable and small sized NPs is imperative to assure pDNA protection and colloidal stability in the extracellular environment and allow an efficient cellular binding and uptake [38]. The results obtained in this study support previous findings showing that TMC-based NPs present higher stability and pDNA condensation capacity at physiological conditions, compared to CH NPs [39], both important factors for the multistep process of gene transfection.
Nonetheless, these parameters are not sufficient to meet all the premises necessary for the design of efficient gene delivery vectors. One of the most important requirements for gene transfer consists in the arrival of therapeutically relevant amount of intact pDNA to the nucleus of a target cell. If NP release from NLV and subsequent pDNA unpacking occurs too slowly or are impaired, the latter will not be accessible to the transcriptional machinery and will eventually be lost or diluted in processes like exocytosis or mitosis. On the contrary, if release occurs too promptly, or if the polyplex is not stable enough to resist endonuclease access, the pDNA will became susceptible to degradation prior reaching its final cellular target [35], [40]. Therefore, an ideal vector would provide total protection of complexed pDNA from degradation prior to releasing it efficiently near or within the nucleus of a target cell. On the other hand, many of the polymeric features that contribute to pDNA protection also hamper its release once NPs are inside the cell, the polymer ability to protect and efficiently release pDNA being inversely related. Various strategies have been tried to design vectors able to trigger pDNA release at the right time and space but, to the best of our knowledge, little attention has been paid to the contribution of vector degradation to this process. From our point of view, pDNA availability is highly dependent on NPs disassemble and, consequently, polymer degradation. TMC biodegradation has been described in solution by Verheul and co-workers [41], who found that TMC degradation by lysozyme is also positively correlated with the polymer DA. However, to the best of our knowledge, the biodegradation of a TMC-based nanoparticulate system was never assessed before. In fact, the extrapolation to NP biodegradation is not straightforward, since when the polymer is complexed with nucleic acids the exposure of acetylated groups may not favour/allow the degradation mediated by enzymes. To address this question, we altered the biodegradation rate of the TMC NPs by deacetylation and re-acetylation of the polymer, giving rise to NPs with different enzymatic degradation profiles, while not affecting the NP size, charge or ability to protect pDNA. This proved to have an impact on the intracellular dynamics, which resulted in a significantly different transfection ability of the proposed NPs.
Taken together, these results suggest that biodegradation is a key feature for the overall transfection process and that a polymer with an intermediate DA is necessary to assure a compromise between NP stability and NA release intracellularly. These data are in accordance with previous reports that state that chitosan-based polyplexes with an optimal pDNA binding strength allow for efficient intracellular unpacking. On the contrary, excessively stable polyplexes release pDNA more slowly and less efficiently resulting in decreased levels of transgene expression [42]. To understand the extent of the impact on transfection efficiency of the polymer DA variations and, consequently, biodegradation, we further proceeded with the study of the intracellular trafficking pathway of the developed NPs. By using imaging flow cytometry instead of conventional flow cytometry we aimed
at gaining quantitative information on the number of cells with internalized NPs as a function of time, as well as on the NA cargo present in each cell treated with different NP formulations. Furthermore, with the use of a single technique, we were able to assess in vitro the major parameters necessary for an efficient gene delivery system, from cellular uptake to pDNA transport towards nuclear vicinity, including vector toxicity. This technique was found to be a great tool for the initial steps of vector design and optimization. Moreover, due to its high-throughput nature, it allowed to accurately disclose otherwise imperceptible differences between formulations. To the best of our knowledge, this was the first time that imaging flow cytometry was used to infer about NP trafficking through the endocytic pathway, by means of the quantification of the NLV per cell, without the use of additional intracellular markers. The quantification of the percentage of cells with DNA in the nuclear vicinity by imaging flow cytometry was also a novel experimental approach explored by us.
5. Conclusion
In sum, our work provides novel information about the importance of vector degradation rate for gene delivery into cells as a way to tune gene expression in function of the desired application, and advances novel approaches to optimize nanoparticle formulation.
Taking advantage of imaging flow cytometry, a high-throughput technique with unique features that combines the statistical strength of flow cytometry with image acquisition of every event, we were able to unravel some critical aspects for NP formulation and contribute to the design of more efficient nucleic acid delivery vectors.
Ultimately, the development of an efficient non-viral gene delivery vector will depend on the combination of intelligent material design with innovative imaging techniques, which would facilitate the rational design of these formulations.
Acknowledgements
The work was financed by Portuguese funds through FCT (Fundação para a Ciência e a Tecnologia) in the framework of the projects UID/BIM/04293/2013, PTDC/CTM-NAN/115124/2009 and PTDC/CTM-NAN/3547/2014. CP Gomes, CDF Lopes and PMD Moreno acknowledge FCT for their scholarships (SFRH/BD/79930/2011, SFRH/BD/77933/2011 and SFRH/BPD/108738/2015, respectively). Authors acknowledge the Bioimaging Center for Biomaterials and Regenerative Therapies of INEB (b.IMAGE) for the support with Imaging Flow Cytometry and the Biointerfaces and Nanotechnology Service (INEB-i3S) for size and zeta potential analysis.
REFERENCES
[1] I.M. Verma, M.D. Weitzman, Gene therapy: twenty-first century medicine,Annu. Rev. Biochem. 74 (2005) 711– 738.
[3] S.C.D. Smedt, J. Demeester, W.E. Hennink, Cationic polymer based genedelivery systems, Pharm. Res. 17 (2) (2000) 113–126.
[4] A.R. Kirtane, J. Panyam, Polymer nanoparticles: weighing up gene delivery, Nat.Nanotechnol. 8 (11) (2013) 805–806.
[5] C.P. Gomes, C.D. Ferreira Lopes, P.M. Duarte Moreno, A. Varela-Moreira, M.J.Alonso, A.P. Pêgo, Translating chitosan to clinical delivery of nucleic acid-baseddrugs, MRS Bull. 39 (01) (2014) 60–70.
[6] V.K. Mourya, N.N. Inamdar, Trimethyl chitosan and its applications in drugdelivery, J. Mater. Sci. - Mater. Med. 20 (5) (2009) 1057–1079.
[7] M. Thanou, B.I. Florea, M. Geldof, H.E. Junginger, G. Borchard, Quaternizedchitosan oligomers as novel gene delivery vectors in epithelial cell lines,Biomaterials 23 (1) (2002) 153–159.
[8] T. Kean, S. Roth, M. Thanou, Trimethylated chitosans as non-viral gene deliveryvectors: cytotoxicity and transfection efficiency, J. Control. Release 103 (3)(2005) 643–653.
[9] L.R. Pires, H. Oliveira, C.C. Barrias, P. Sampaio, A.J. Pereira, H. Maiato, S. Simões,A.P. Pêgo, Imidazole-grafted chitosan-mediated gene delivery: in vitrostudy ontransfection, intracellular trafficking and degradation, Nanomedicine 6 (9)(2011) 1499–1512.
[10] C. Gottstein, G. Wu, B. Wong, J. Zasadzinski, Precise quantification ofnanoparticle internalization, ACS Nano 7 (6) (2013) 4933–4945.
[11] C. Lopes, M. Gomez-Lazaro, A. Pêgo, Seeing is believing but quantifying isdeciding, Nanomedicine (Lond) 10 (15) (2015) 2307–2310.
[12] S. Vranic, N. Boggetto, V. Contremoulins, S. Mornet, N. Reinhardt, F. Marano, A.Baeza-Squiban, S. Boland, Deciphering the mechanisms of cellular uptake ofengineered nanoparticles by accurate evaluation of internalization usingimaging flow cytometry, Part Fibre Toxicol. 10 (2013) 2.
[13] Y. Phanse, A.E. Ramer-Tait, S.L. Friend, B. Carrillo-Conde, P. Lueth, C.J. Oster, G.J.Phillips, B. Narasimhan, M.J. Wannemuehler, B.H. Bellaire, Analyzing cellularinternalization of nanoparticles and bacteria by multi-spectral imaging flowcytometry, J. Vis. Exp. (64) (2012) e3884.
[14] I. Marangon, N. Boggetto, C. Menard-Moyon, N. Luciani, C. Wilhelm, A. Bianco,F. Gazeau, Localization and relative quantification of carbon nanotubes in cellswith multispectral imaging flow cytometry, J. Vis. Exp. (82) (2013) e50566.
[15] P. Moreno, J. Santos, C. Gomes, A. Varela-Moreira, A. Costa, V. Leiro, H. Mansur,A. Pêgo, Delivery of splice switching oligonucleotides by amphiphilic chitosan-based nanoparticles, Mol. Pharm. 13 (2016) 344–356. [16] C. Moreira, H. Oliveira, L.R. Pires, S. Simões, M.A. Barbosa, A.P. Pêgo,Improving chitosan-mediated gene transfer by the introduction ofintracellular buffering moieties into the chitosan backbone, Acta Biomater. 5(8) (2009) 2995–3006.
[17] S. Mima, M. Miya, R. Iwamoto, S. Yoshikawa, Highly deacetylated chitosan andits properties, J. Appl. Polym. Sci. 28 (6) (1983) 1909–1917.
[18] L. Vachoud, N. Zydowicz, A. Domard, Formation and characterisation of aphysical chitin gel, Carbohydr. Res. 302 (3–4) (1997) 169–177.
[19] E. Curti, S.P. Campana-Filho, Viscosity behavior of chitosan and N,N,N-trimethylchitosan chloride salts in acid-free aqueous solution, J. Macromol.Sci.-Pure Appl. Chem. A43 (3) (2006) 555–572.
[20] H. Oliveira, L.R. Pires, R. Fernandez, M.C.L. Martins, S. Simões, A.P. Pêgo,Chitosan-based gene delivery vectors targeted to the peripheral nervoussystem, J. Biomed. Mater. Res., Part A 95A (3) (2010) 801–810. [21] W.E. Ortyn, D.J. Perry, V. Venkatachalam, L. Liang, B.E. Hall, K. Frost, D.A. Basiji,Extended depth of field imaging for high speed cell analysis, Cytometry A 71(4) (2007) 215–231.
[22] T.C. George, S.L. Fanning, P. Fitzgerald-Bocarsly, R.B. Medeiros, S. Highfill, Y.Shimizu, B.E. Hall, K. Frost, D. Basiji, W.E. Ortyn, P.J. Morrissey, D.H. Lynch,Quantitative measurement of nuclear translocation events using similarityanalysis of multispectral cellular images obtained in flow, J. Immunol.Methods 311 (1–2) (2006) 117–129. [23] J. O’Brien, I. Wilson, T. Orton, F. Pognan, Investigation of the Alamar Blue(resazurin) fluorescent dye for the assessment of mammalian cell cytotoxicity,Eur. J. Biochem. 267 (17) (2000) 5421–5426
[24] M. Huang, C.W. Fong, E. Khor, L.Y. Lim, Transfection efficiency of chitosanvectors: effect of polymer molecular weight and degree of deacetylation, J.Control. Release 106 (3) (2005) 391–406.
[25] U.S.F.a.D. Administration, Guidance for Industry – Pyrogen and EndotoxinsTesting, in: U.S.D.o.H.a.H. Services (Ed.), U.S. Department of Health andHuman Services, 2012.
[26] R.J. Nordtveit, K.M. Vårum, O. Smidsrød, Degradation of fully water-soluble,partially N-acetylated chitosans with lysozyme, Carbohydr. Polym. 23 (4)(1994) 253–260.
[27] S. Pangburn, P. Trescony, J. Heller, Lysozyme degradation of partiallydeacetylated chitin, its films and hydrogels, Biomaterials 3 (2) (1982) 105–108.
[28] D. Ren, H. Yi, W. Wang, X. Ma, The enzymatic degradation and swellingproperties of chitosan matrices with different degrees of N-acetylation,Carbohydr. Res. 340 (15) (2005) 2403–2410.
[29] M. Koping-Hoggard, I. Tubulekas, H. Guan, K. Edwards, M. Nilsson, K.M. Varum,P. Artursson, Chitosan as a nonviral gene delivery system. Structure-propertyrelationships and characteristics compared with polyethylenimine in vitro andafter lung administration in vivo, Gene Ther. 8 (14) (2001) 1108–1121.
[30] R. Wattiaux, N. Laurent, S. Wattiaux-De Coninck, M. Jadot, Endosomes,lysosomes: their implication in gene transfer, Adv. Drug Deliv. Rev. 41 (2)(2000) 201–208.
[31] Y. Yan, Z.W. Lai, R.J.A. Goode, J. Cui, T. Bacic, M.M.J. Kamphuis, E.C. Nice, F.Caruso, Particles on the move: intracellular trafficking and asymmetric mitoticpartitioning of nanoporous polymer particles, ACS Nano 7 (6) (2013) 5558–5567.
[32] H.D. Summers, P. Rees, M.D. Holton, M.R. Brown, S.C. Chappell, P.J. Smith, R.J.Errington, Statistical analysis of nanoparticle dosing in a dynamic cellularsystem, Nat. Nanotechnol. 6 (3) (2011) 170–174.
[33] J.L. Ross, M.Y. Ali, D.M. Warshaw, Cargo transport: molecular motors navigatea complex cytoskeleton, Curr. Opin. Cell Biol. 20 (1) (2008) 41–47.
[34] D. Hofmann, S. Tenzer, M.B. Bannwarth, C. Messerschmidt, S.-F. Glaser, H.Schild, K. Landfester, V. Mailänder, Mass spectrometry and imaging analysis ofnanoparticle-containing vesicles provide a mechanistic insight into cellulartrafficking, ACS Nano 8 (10) (2014) 10077–10088.
[35] C.J. Bishop, R.L. Majewski, T.R. Guiriba, D.R. Wilson, N.S. Bhise, A. Quinones-Hinojosa, J.J. Green, Quantification of cellular and nuclear uptake rates ofpolymeric gene delivery nanoparticles and DNA plasmids via flow cytometry,Acta Biomater. 37 (2016) 120–130.
[36] E.K. Zuba-Surma, M. Kucia, A. Abdel-Latif, J.W. Lillard, M.Z. Ratajczak, TheImageStream system: a key step to a new era in imaging, Folia Histochem.Cytobiol. 45 (4) (2007) 279–290.
[37] E.K. Zuba-Surma, M.Z. Ratajczak, Analytical capabilities of the ImageStreamcytometer, Methods Cell Biol. 102 (2011) 207–230.
[38] C.M. Wiethoff, C.R. Middaugh, Barriers to nonviral gene delivery, J. Pharm. Sci.92 (2) (2003) 203–217. [39] O. Germershaus, S. Mao, J. Sitterberg, U. Bakowsky, T. Kissel, Gene deliveryusing chitosan, trimethyl chitosan or polyethylenglycol-graft-trimethylchitosan block copolymers: establishment of structure-activity relationshipsin vitro, J. Control. Release 125 (2) (2008) 145–154.
[40] C. Grigsby, K. Leong, Balancing protection and release of DNA: tools to addressa bottleneck of non-viral gene delivery, J. R. Soc. Interface 7 (Suppl 1) (2010)S67–S82.
[41] R.J. Verheul, M. Amidi, M.J. van Steenbergen, E. van Riet, W. Jiskoot, W.E.Hennink, Influence of the degree of acetylation on the enzymatic degradationand in vitro biological properties of trimethylated chitosans, Biomaterials 30(18) (2009) 3129–3135.
[42] S.P. Strand, S. Lelu, N.K. Reitan, C. de Lange Davies, P. Artursson, K.M. Varum,Molecular design of chitosan gene delivery systems with an optimized balancebetween polyplex stability and polyplex unpacking, Biomaterials 31 (5) (2010)975–987.
Fig. 1. Stability of CH- and TMC-based nanoparticles in different media. Size distribution of (a) CH or
(b) TMC NPs in their respective preparation buffer and after dilution (1:6) in complete DMEM medium. The graphic of TMC4 NPs (b) is representative of all the different TMC NPs tested. The profile of DMEM with serum and no NPs (control) is presented in order to discriminate protein-related aggregates.
Fig. 2. Effect of polymer DA on NPs biodegradation and transfection efficiency. Extent of
MU-[GlcNAc]3 hydrolysis after incubation with lysozyme in the presence of (a) CH16 or TMC16 NPs or (b)
substrate cleavage by lysozyme without the NPs (positive control). A student’s t-test was used to determine the statistical difference between CH16 and TMC16. Two-way ANOVA analysis of variance
with Tukey’s post-test was used for comparisons between all TMC-based NPs. Statistical differences are presented as: no symbol p > 0.05; #p < 0.05 when comparing CH16 to TMC16; *p < 0.05 and **p <
0.01, ***p < 0.001 when comparing TMC16 and TMC4 with TMC21 NPs, respectively. (c) Table with the
degradation rate (k) and degradation span (% of fluorescence) of all NP formulations, obtained through the fitting of the degradation data with the one phase decay equation model (grey line in a and b). (d) The transfection efficiency of TMC-based NPs was evaluated 72 h post-transfection. The percentage of cells expressing eGFP was assessed by flow cytometry. Poly(ethylene imine) (PEI) and Lipofectamine® 2000 (Lipo) were used as positive controls. Each bar represents the mean of four independent experiments ± SD. One-way ANOVA analysis of variance with Tukey’s post-test was used for comparisons between conditions. Statistical differences are presented as: *p < 0.05, **p < 0.01 and ***p < 0.001 for comparisons between TMC-based NPs; ns = p > 0.05 and ##p < 0.01 when comparing TMC16 with PEI or Lipo, respectively.
Fig. 3. Evaluation of nanoparticle internalization kinetics. (a) Examples of images captured by
ImageStreamX in bright-field, YOYO®-1 (green) and their overlays (scale bars: 10 μm). Masks (cyan blue) were created to fit the whole cell (1), cell cytoplasm (2) and membrane (3 = 1–2). YOYO®-1 images are represented with the cell cytoplasm mask, to distinguish internalized versus membrane associated NPs. (b) Percentage of ND7/23 cells positive for YOYO®-1 after incubation with CH or TMC-based NPs from 0.5 to 24 h. The difference between cells with associated NPs (white bars) and cells that had internalized NPs (patterned bars) is shown. (c) The internalization score (IS) – ratio between the fluorescence intensity inside cell to the fluorescence intensity of the entire cell – was also evaluated from 0.5 to 24 h, as a function of NPs internalization kinetics. Representative images of cells with NPs (green) in the extra- or intracellular compartment (scale bar: 10 μm). All data was acquired from at least three independent experiments ± SD. Two-way ANOVA analysis of variance with Bonferroni’s post-test was used for comparisons between polymers. Statistical differences are presented as: no symbol p > 0.05; *p < 0.05, **p < 0.01 and ***p < 0.001. (For interpretation of the references to color in this figure legend, the reader is referred to the web version of this article.)
Fig. 4. Quantification of the number of nanoparticle-loaded vesicles (NLV) per cell as a function of
time of incubation. (a) Example of cells acquired from imaging flow cytometry (bright-field) with increasing number of NLV (YOYO-1® – green; scale bar: 10 μm). (b) Histogram of NLV frequency obtained from IDEAS® software analysis with the gated regions of interest. The percentage of cells that internalized NPs with low (c), medium (d), and high (e) number of NLV were considered. (f) Table summarizing the distribution of the number of NLV per cell depending on the NPs tested along the 24 h. The fold-increase or decrease along the study (value from 24 h/value from 1 h) is shown. Each bar represents the mean of at least three independent experiments ± SD. Two-way ANOVA analysis of variance with Bonferroni’s post-test was used for comparisons between polymers. Statistical differences are present as: no symbol p > 0.05, *p < 0.05, *p < 0.01 and ***p < 0.001, when comparing TMC16 to other TMC polymers; #p < 0.05, ##p < 0.01 and ###p < 0.001 when comparing TMC16 with
CH16. (For interpretation of the references to color in this figure legend, the reader is referred to the
Fig. 5. Determination of the percentage of cells with nanoparticle-loaded vesicles (NLV) present in
the nuclear vicinity. (a) Representative images acquired by imaging flow cytometry. The fluorescence images collected using the 480–560 nm (YOYO®-1 – green) and 660–740 nm (DRAQ5™ – red) spectral detection channels and their composite images are showed (scale bars: 10 μm). (b) Cells positive for both fluorescent dyes were selected; (c) Histogram of frequency of the similarity feature from IDEAS® software. Cells with similar YOYO®-1/DRAQ5™ image pairs were gated; (d) Percentage of cells with NLV localized in the nuclear vicinity 24 h post-incubation with CH or TMC-based NPs. Each bar represents the mean of at least three independent experiments ± SD. Two-way ANOVA analysis of variance with Bonferroni’s post-test was used for comparisons between polymers. Statistical differences are present as: no symbol p > 0.05, *p < 0.05, when comparing TMC16 to other
TMC polymers; #p < 0.05 when comparing TMC16 with CH16. (For interpretation of the references to
color in this figure legend, the reader is referred to the web version of this article.)
Fig. 6. ND7/23 cell apoptosis upon incubation with CH- or TMC-based nanoparticles. (a) Gated
regions of non-apoptotic and apoptotic cells and their representative images: bright-field and nuclear region (DRAQ5™ fluorescent red) (scale bars: 10 μm); (b) Percentage of apoptotic cells relative to negative control (untreated cells) after 24 h incubation with CH- or TMC-based nanoparticles. Each bar represents the mean of three independent experiments ± SD. One-way ANOVA analysis of variance with Bonferronis’s Multiple Comparison post-test. Statistical differences are present as: no symbol p > 0.05; ***p < 0.001 when comparing to other TMC NPs; ##p < 0.01 and ###p < 0.01 when comparing to CH16 NPs. (For interpretation of the references to color in this figure legend, the reader
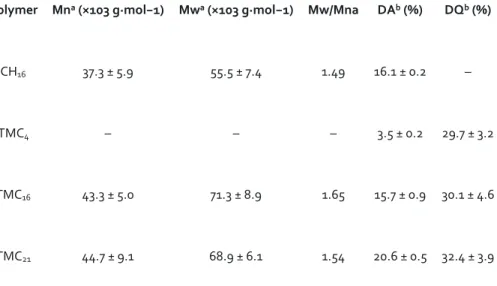
Table 1. Polymer characteristics in terms of molecular weight, degree of acetylation (DA) and degree
of quaternization (DQ).
Polymer Mna (×103 g·mol−1) Mwa (×103 g·mol−1) Mw/Mna DAb (%) DQb (%)
CH16 37.3 ± 5.9 55.5 ± 7.4 1.49 16.1 ± 0.2 –
TMC4 – – – 3.5 ± 0.2 29.7 ± 3.2
TMC16 43.3 ± 5.0 71.3 ± 8.9 1.65 15.7 ± 0.9 30.1 ± 4.6
TMC21 44.7 ± 9.1 68.9 ± 6.1 1.54 20.6 ± 0.5 32.4 ± 3.9
All polymers were purified and characterized.
aAverage number (Mn) and average weight (Mw) molecular weight, as well as the polymer
polydispersity index (Mw/Mn) were determined by gel permeation chromatography (n = 3 ± standard deviation (SD)).
bDegree of N-acetylation (DA) and quaternization (DQ) were assessed by 1H NMR (n = 3 ± SD) (1H
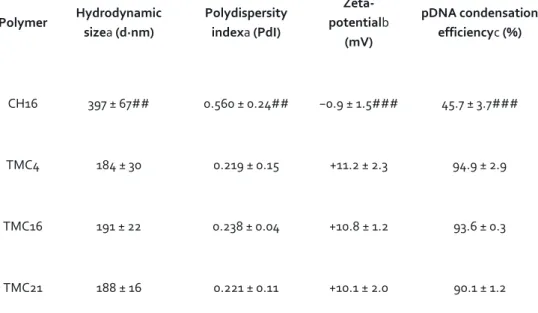
Table 2. Physicochemical characterization of CH- and TMC-based nanoparticles at physiological conditions. Polymer Hydrodynamic sizea (d·nm) Polydispersity indexa (PdI) Zeta-potentialb (mV) pDNA condensation efficiencyc (%) CH16 397 ± 67## 0.560 ± 0.24## −0.9 ± 1.5### 45.7 ± 3.7### TMC4 184 ± 30 0.219 ± 0.15 +11.2 ± 2.3 94.9 ± 2.9 TMC16 191 ± 22 0.238 ± 0.04 +10.8 ± 1.2 93.6 ± 0.3 TMC21 188 ± 16 0.221 ± 0.11 +10.1 ± 2.0 90.1 ± 1.2
All NPs were prepared at N/P ratio of 15. Average size, polydispersity index, zeta-potential and pDNA condensation efficiency of CH- and TMC-based NPs.
aNP average hydrodynamic sizes and PdI were measured by dynamic light scattering (n = 3 ± SD). bMean surface charge of NPs based on zeta-potential measurements.
Both size and surface charge measurements were performed in complete DMEM medium (with 10% (v/v) FBS), pH 7.4 (n = 3 ± SD).
cPercentage of pDNA condensed into NPs after incubation in complete DMEM medium assessed by
SYBR® Gold (n = 3 ± SD). Statistical differences are presented as: ##p < 0.01 and ###p < 0.001 for CH16 vs other TMC NPs.
Supplementary Figures S1–S7 and Table S1–S2.
Figure S1. Transfection efficiency of TMC16 nanoparticles assessed in ND7/23 cells. The
transfection efficiency of TMC16 NPs prepared at N/P ratios ranging from 1 to 18 was evaluated 72 h
post-transfection. The percentage of viable cells expressing eGFP was assessed by flow cytometry. Each bar represents the mean of three independent experiments ± SD.
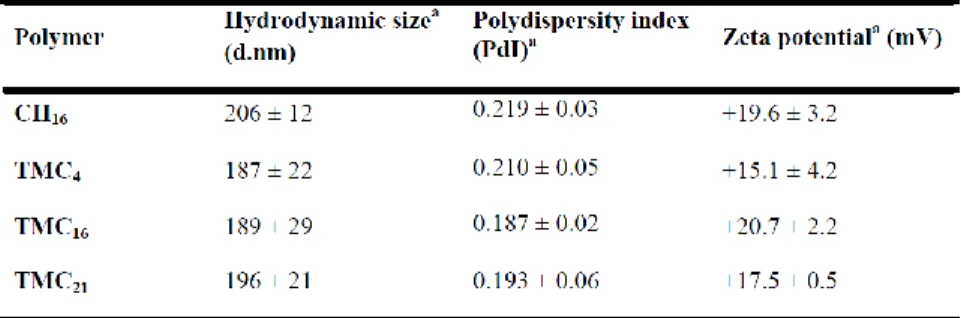
Table S1. CH-and TMC-based nanoparticles average size, polydispersity index and zeta potential
after preparation.
All NPs were prepared at N/P ratio of 15. aNanoparticle average hydrodynamic sizes, PdI and mean
zeta potential based on dynamic light scattering measurements were performed after NPs preparation in 5 mM acetate buffer, pH 5.5 (CH NPs) or 20 mM HEPES buffered solution with 5% (w/v) glucose, pH 7.4 (TMC NPs) (n=3 ± SD). No statistical differences were found between all tested NPs.
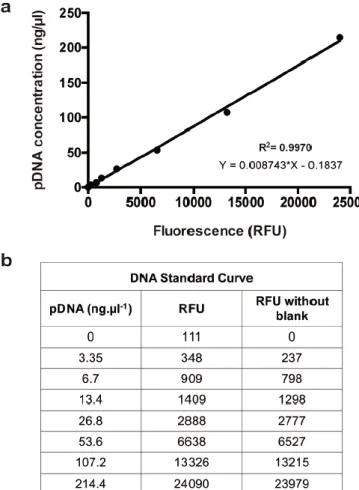
Figure S2. Plasmid DNA quantification by means of a SYBR® Gold based assay. (A) Representative
plasmid DNA (pDNA) standard curve obtained after pDNA consecutive dilutions. The line obtained through linear regression of the data is represented in the graphic in black, as well as the R square and the linear equation. (B) Table with the spectroscopy data obtained after incubating pDNA with SYBR® Gold for 10 min and measuring the emitted fluorescence. RFU = Relative fluorescence units.