ESCOLA DE ECONOMIA DE SÃO PAULO
JULIANA CAMARGO
ENSAIOS EM ECONOMIA DA EDUCAÇÃO
São Paulo 2017
ESCOLA DE ECONOMIA DE SÃO PAULO
JULIANA CAMARGO
ENSAIOS EM ECONOMIA DA EDUCAÇÃO
Tese apresentada ao Programa de Pós-Graduação da Escola de Economia de São Paulo da Fundação Getulio Vargas, como requisito para a obtenção do título de Doutor em Economia. Campo de Conhecimento:
Microeconomia Aplicada - Economia da Educação
Orientador: Prof. Dr. André Portela Fernandes de Souza
São Paulo 2017
ENSAIOS EM ECONOMIA DA EDUCAÇÃO
Tese apresentada ao Programa de Pós-Graduação da Escola de Economia de São Paulo da Fundação Getulio Vargas, como requisito para a obtenção do título de Doutor em Economia. Área de Conhecimento: Micro-economia Aplicada - Economia da Educação
Data de Aprovação: 22/05/2017 Banca examinadora:
Prof. Dr. André Portela Fernandes de Souza (Orientador)
FGV-EESP
Prof. Dr. Bruno Ferman FGV-EESP
Prof. Dr. Daniel Domingues dos Santos USP-FEA/RP
Prof. Dr. Enlinson Henrique Carvalho de Mattos
FGV-EESP
Prof. Dr. Naercio Aquino Menezes Filho Insper e FEA-USP
Em primeiro lugar, agradeço aos meus pais, José e Sílvia Camargo, por todo amor, doação, apoio, confiança e por sempre me incentivarem em minhas decisões. Além disso, agradeço por sempre terem feito o possível (e muitas vezes mais do que o que era possível, mas mesmo assim o fizeram) para me oportunizar o poder transformador da educação, e por desde pe-quena me ensinarem a importância da mesma. Aos meus irmãos, Joseane e Rogner Camargo, por todo amor, apoio e companheirismo.
Agradeço ao meu namorado, Bernardo Dutra, pelo amor, por sempre me transmitir muito apoio, equilíbrio e calma, e por toda amizade e companheirismo desde quando nos conhece-mos.
Aos meus amigos da EESP, que foram fundamentais para eu conseguir superar toda a pressão dos estudos e tornaram o doutorado muito mais alegre e leve. Em especial, agradeço ao Ronan Cunha, pela amizade especial que construímos, por dividir praticamente todos os momentos comigo e sempre estar ao meu lado, me apoiando. Sobretudo por me ensinar a importância da respiração. À Dalila Figueiredo, pela amizade, por sempre estar presente e disposta a me ajudar, e por sua doação e apoio (sinto muitas saudades de você). À Amanda Arabage, Bernardo Modenesi, Eduardo Cenci, Rafael Mouallen, Thiago de Lucena e Lucas Finamor. Como não poderia deixar de ser, agradeço imensamente à irmã que minha alma escolheu, Lycia Lima, por sempre enxergar o melhor em mim, pelas palavras de incentivo, por todas as vezes que você "mudou minha vida" ao longo do doutorado, por toda a preocupação, por sempre me escutar e por todos os momentos incríveis que compartilhamos. Você é uma inspiração para mim.
Agradeço muito ao professor André Portela, pelo exemplo de paixão pela docência e pela pesquisa, pelo aceite de ser meu orientador, por toda a atenção, pelas valiosas discussões ao longo da tese e pelo seu otimismo nos momentos mais difíceis. Suas contribuições para esse trabalho são ímpares.
Aos professores da banca examinadora, Bruno Ferman, Enlinson Mattos, Daniel Santos e Naercio Menezes, pelas valiosas sugestões.
Ao professor e amigo Sabino Porto Júnior, por todo exemplo pessoal e profissional, por sem-pre acreditar em mim e me incentivar, pelo apoio, por todos os conselhos e "Toldos Amarelos" (que agora buscamos pelo Brasil).
Aos professores da EESP, por compartilharem seu conhecimento conosco.
The aim of this study is to provide rigorous evidence of the impact of a brazilian vocational education and training program on its beneficiaries. For this, we took advantage of the selection criteria for the program, in which the beneficiaries were selected through a lottery . Besides, our unique dataset allow us to evaluate the effect of the intervention not only on the economic dimension, but also on human capital, socio-emotional, crime and risky behavior outcomes. This is a valuable contribution since there is a lack of evidence in the literature about the impact of VET programs on these outcomes. Our estimations were based on ITT and LATE strategies. Overall, our results indicated that, at least in the short-run, there was no effect of the program on conventional labor market outcomes, such as employment and formal work probability and wages. Also, we found no effect in socio-emotional, crime and risky behavior dimensions. However, our results pointed towards a possible heterogeneity of the program, since we found positive and significant effects of the intervention on women, specially in labor market (formal work probability and wage) and socio-emotional (extraversion) outcomes.
Keywords: Vocational Education; PRONATEC; Experimental Evidence; Human Capital; Socio-emotional Skills; Crime and Risky Behavior.
O objetivo deste estudo é fornecer evidências rigorosas do impacto de um programa brasileiro de educação técnica de nível médio sobre seus beneficiários. Para tanto, nós aproveitamos o critério de seleção do programa, no qual os beneficiários são selecionados através de um sorteio. Além disso, nosso banco de dados único nos permite avaliar o efeito da intervenção não apenas na dimensão econômica, mas também em dimensões como capital humano, habilidades socioemocionais e crime e comportamento de risco. Essa é uma con-tribuição relevante, uma vez que na literatura há uma lacuna de evidências sobre o impacto de educação técnica nesses resultados. Nossas estimações foram baseadas em estratégias de ITT e LATE. De forma geral, nossos resultados indicam que, ao menos no curto prazo, não há efeito do programa nos resultados de mercado de trabalho, tai como empregabilidade, emprego formal e salários. Ademais, nós também não encontramos efeitos do programa em outras dimensões como socio-emocionais, crime e comportamento de risco. Entretanto, nos-sos resultados sugerem que há uma heterogeneidade nos efeitos do programa, uma vez que encontramos efeitos positivos e significantes do programa sobre as mulheres, especialmente em resultados do mercado de trabalho (emprego formal e salário) e habilidades socioemo-cionais (extroversão).
Palavras-Chave: Educação Técnica; PRONATEC; Evidência Experimental; Capital Humano; Habilidades Socioemocionais; Crime e Comportamento de Risco.
Figure 1 – Levels of Vocational System in Brazil . . . 22
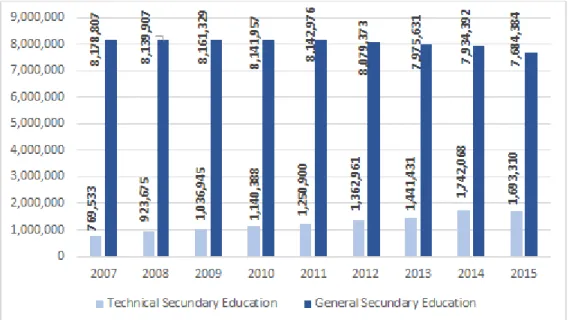
Figure 2 – Technical VS General Secondary Education in Brazil . . . 23
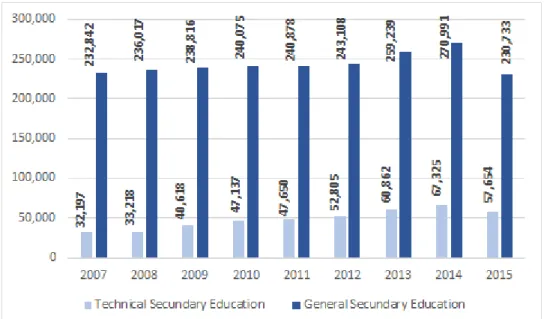
Figure 3 – Technical VS General Secondary Education in Santa Catarina . . . 24
Figure 4 – Technical Education in Brazil, by course modality . . . 25
Figure 5 – Technical Education in Santa Catarina, by course modality . . . 25
Table 1 – Descriptive Statistics of Administrative Data with Individuals’ Information, by course modality . . . 30 Table 2 – Descriptive Statistics of the Sample . . . 32 Table 3 – Distribution of Treatment and Control groups at First and Second Round
of Enrollment . . . 34 Table 4 – Number of successful interviews considering all subscribers from
adminis-trative data, by treatment status . . . 35 Table 5 – Attrition rates considering administrative data with phone information, by
treatment status . . . 36 Table 6 – Number of interviews by municipality and course . . . 36 Table 7 – OLS estimation for correlation between attrition and treatment status
("Ad-ministrative 1" data, using all subscribers) . . . 38 Table 8 – OLS estimation for correlation between attrition and treatment status
("Ad-ministrative 2" data) . . . 39 Table 9 – Linear probability model regressions for conditional mean difference test
("Administrative 2" data), by course modality . . . 40 Table 10 – Linear probability model regressions for conditional mean difference test
(sample data), by course modality . . . 41 Table 11 – ITT estimation on Labor Market Outcomes, by course modality and sex . 52 Table 12 – ITT estimation on Ln(wage), by course modality and sex . . . 54 Table 13 – Bounds on Treatment Effects for ln(wage), by course modality and sex . . 55 Table 14 – Average Labor Market Experience (months) for concomitant modality . . 55 Table 15 – Randomization Test . . . 56 Table 16 – ITT estimation on Human Capital Outcomes, by course modality and sex 60 Table 17 – ITT estimation on Human Capital Outcomes Exclusively for Concomitant
Modality, by sex . . . 61 Table 18 – Randomization Test . . . 61 Table 19 – First Stage of IV estimations, by course modality and sex . . . 63 Table 20 – IV estimation on Labor Market Outcomes, by course modality and sex . . 64 Table 21 – Number of interviews by course and sex . . . 66 Table 22 – IV estimation on Human Capital Outcomes, by course modality and sex . 69 Table 23 – First Stage of IV estimations for Human Capital Outcomes (Exclusively for
Table 25 – Linear probability model regressions for conditional mean difference test (non-cognitive sub-sample), by course modality . . . 76 Table 26 – ITT estimation on Non-cognitive Outcomes, by course modality and sex . 78 Table 27 – Randomization Test . . . 79 Table 28 – First Stage of IV estimations for Non-cognitive Outcomes, by course
modal-ity and sex . . . 81 Table 29 – IV estimation on Non-cognitive Outcomes, by course modality and sex . . 82 Table 30 – OLS estimation for correlation between labor market outcomes and
non-cognitive skills . . . 85 Table 31 – OLS estimation for correlation between human capital outcomes and
non-cognitive skills . . . 89 Table 32 – OLS estimation for correlation between academic achievement and
non-cognitive skills . . . 90 Table 33 – OLS estimation for correlation between crime outcomes and non-cognitive
skills . . . 93 Table 34 – OLS estimation for correlation between risky behavior outcomes and
non-cognitive skills . . . 94 Table 35 – OLS estimation for correlation between risky behavior outcomes and
non-cognitive skills . . . 95 Table 36 – ITT estimation on Crime and Risky Behavior Outcomes, by course modality
and sex . . . 102 Table 37 – ITT estimation on Crime and Risky Behavior Outcomes, by course modality
and sex . . . 103 Table 38 – Randomization Test . . . 104 Table 39 – IV estimation on Crime and Risky Behavior Outcomes, by course modality
and sex . . . 108 Table 40 – IV estimation on Crime and Risky Behavior Outcomes, by course modality
and sex . . . 109 Table 41 – Descriptive Statistics for Women in Subsequent Modality . . . 110 Table 42 – OLS estimation for correlation between alcohol use and academic achievement111 Table 43 – OLS estimation for correlation between the cigarette use and academic
achievement . . . 112 Table 44 – OLS estimation for correlation between the marijuana use and academic
Table 46 – OLS estimation for correlation between the alcohol use and the peers’ use of alcohol . . . 114 Table 47 – OLS estimation for correlation between the cigarette use and the peers’ use
of cigarette . . . 115 Table 48 – OLS estimation for correlation between the marijuana use and the peers’
use of marijuana . . . 115 Table 49 – OLS estimation for correlation between other drugs use and peers’ use of
other drugs . . . 116 Table 51 – Nonparametric Extreme Bounds . . . 130 Table 50 – Descriptive Statistics for Women . . . 131 Table 52 – Linear probability model regressions for conditional mean difference test
("Administrative 2" data) for women, by course modality . . . 132 Table 53 – Linear probability model regressions for conditional mean difference test
(Sample data) for women, by course modality . . . 133 Table 54 – OLS estimation for correlation between attrition and treatment status
1 INTRODUCTION . . . 15
2 PRONATEC PROGRAM . . . 21
3 EXPERIMENTAL DESIGN AND DATA . . . 28
3.1 Administrative Data . . . 28
3.2 Survey Information and Descriptive Statistics of the Sample . . . 30
3.3 Classification of individuals in Treatment and Control Groups . . . . 32
3.4 Attrition . . . 35
4 EMPIRICAL STRATEGY . . . 42
4.1 Intention to Treat Estimate . . . 43
4.2 Instrumental Variable Estimate . . . 43
4.2.1 First Stage . . . 43
4.2.2 Second Stage . . . 44
5 LABOR MARKET AND HUMAN CAPITAL OUTCOMES . . . 46
5.1 Related Literature . . . 46
5.2 Results . . . 49
5.2.1 Intention to Treat - Labor Market Outcomes . . . 49
5.2.2 Intention to Treat - Human Capital Outcomes . . . 57
5.2.3 Instrumental Variable - Labor Market Outcomes . . . 62
5.2.4 Instrumental Variable - Human Capital Outcomes . . . 67
6 NON-COGNITIVE SKILLS . . . 73
6.1 Related Literature . . . 73
6.2 Results . . . 74
6.2.1 Intention to Treat - Non-cognitive Skills . . . 77
6.2.2 Instrumental Variable . . . 80
6.2.3 Evidences of Correlation between Non-cognitive Skills and Labor Market Out-comes . . . 83
6.2.4 Evidences of Correlation between Non-cognitive Skills and Human Capital Out-comes . . . 86
7 CRIME AND RISKY BEHAVIOR . . . 96
7.1 Related Literature . . . 96
7.2 Results . . . 99
7.2.1 Intention to Treat . . . 100
7.2.2 Instrumental Variable . . . 105
7.2.3 The Use of Substances and Academic Achievement . . . 111
7.2.4 The Role of Peers in the Use of Substances . . . 114
8 CONCLUSION . . . 117
Bibliography . . . 119
Education and its transformative potential has been gaining power in the public policy debate in recent years. The benefits of investments, enhancing years of education or improving educational quality, are well established in the human capital literature, which highlights their positive effects in economic growth1. Moreover, private and social benefits of education go beyond economic returns, also affecting other dimensions, such as crime (Machin, 2011, Lochner and Moretti, 2001, Machin et al., 2011) and health (Spear, 2000). Improving access and quality of education is one of the most widely implemented policies, particularly in developing countries. However, it is important to understand the technology by which people acquire skills over the life cycle, especially for policy makers, who usually face an efficiency-equity trade-off when deciding which educational policy they will provide to population (Carneiro et al, 2010).
Vocational Education and Training (VET) plays an important role in the develop-ment of workers’ abilities. These are associated to individuals’ characteristics, but also with their educational decisions - more years of education can develop important skills that will improve individuals’ productivity and ability, and, as a consequence, their lifetime earnings in the labor market. This kind of education can prepare students for a smoother school-to-work transition, conciliating traditional education with work experience and specific vocations and tasks (Quintini and Martin, 2006, Eichhorst et al., 2015). VET is also a way to improve op-portunities to disadvantaged youth who decided not attend higher education. It provides a career during secondary education, bringing them closer to the labor market and enhancing their network even before high school graduation (Harhoff and Kane, 1997, Lerman, 2012, Neuman and Ziderman, 1999). Furthermore, it is a way to increase intergenerational mo-bility, reducing the weight of parents’ background on education choices (Shavit and Muller, 1998).
There are different ways of delivering vocational education, and countries have adopted different structures when providing VET courses. Specially for the vocational sec-ondary courses, targeted to smooth school-to-work transition for young people, there are many different possibilities of course designs. As a consequence, several issues and questions regarding how these courses should be delivered on the ground arise. For example, should they focus on on-the-job training or on academic and more general contents? Are there al-ternative pedagogies that should be implemented, like using real world challenges to promote
1 Hanushek and Kimko (2000), Hanushek (2006), Hanushek and Woessmann (2009), Barro (1991, 1997),
learning? What is the optimal course load? Should they also be concerned on developing non-cognitive skills? Should contracts be more flexible allowing teachers to have a career concurrently with their teaching profession? Should VET be seen as "dead end" courses, or as a way to enable students to access higher levels of education? Examples of two different vocational education designs are the ones adopted by The United States and Germany. The first argues that specific skills become obsolete too quickly and recently have redesigned his vocational courses in secondary school, in order to provide young people more general knowl-edge and prepare them to adapt to new technologies. In an opposite direction, in Germany, vocational education at the secondary level still remains focused on specific skills, and often adopts apprenticeships in its courses (Hanushek et al, 2011).
In developed countries, the returns of VET programs vary across countries, depend-ing on the program design and on the institutional arrangements for VET supply. There is evidence for positive impacts of VET programs on labor market outcomes, such as wages (Dearden et al., 2002, Bishop and Mane, 2004, Neuman and Ziderman, 1999), and employ-ment probability (Bishop and Mane, 2004; Hanushek, 2011); although, there is also evidence of low or nonexistent economic returns for some kind of VET programs (Wößmann, 2008, Machin and Vignoles, 2005, Jenkins, Greenwood and Vignoles, 2007, Dearden et al., 2004, Kane and Rouse, 1995, Card, 1999). The evidence also suggests that VET returns are higher in developing countries when compared to developed countries (Attanasio et al., 2011), spe-cially on earnings (Malamud, 2008, Tansel, 1998). For Brazil in particular, some studies find positive impacts of VET on labor market variables (Almeida et al., 2014, Vasconsellos et al., 2010, Assunção and Gonzaga, 2010, Oliva, 2014, Neri, 2010, Biondi, 2015).
Regarding the technologies of skills formation, VET programs may have more po-tential for enhancing non-cognitive skills, since they are more malleable than cognitive skills over the life-cycle, including in adulthood. Even if it is hard to improve non-cognitive skills through vocational education, this investment may still be interesting since there is also the intergenerational channel: enhancing non-cognitive skills of young people and adults may have effect on early cognitive and non-cognitive skills of their children (Carneiro et al., 2010, Carneiro and Heckman, 2003, Cunha and Heckman, 2009, Carneiro, 2009, Woessmann, 2008). There is also evidence of a positive relationship between non-cognitive skills and academic achievement, good health outcomes, social and economic development (Almlund et al., 2011, Friedman and Kern, 2014, Kautz et al., 2014, OECD, 2015, Poropat, 2009) and labor mar-ket outcomes (Kuhn and Weinberger, 2005, Bowles, Gintis and Osborne, 2001, Nyhus and Pons, 2005, Hogan and Holland, 2003, Salgado, 1997, Barrick and Mount, 1991, Cattan, 2010). Specifically in the concomitant modality2, where students face heavier course load,
it is not clear what is the direction of the impact of VET on general education outcomes -academic achievement, attendance rate and graduation at correct age, for example. On one hand, it could enhance cognitives skills through the knowledge acquired in the course, on the other hand, it could increase the opportunity cost, in terms of time and effort, of attending vocational education, damaging their outcomes on general education. In this study, we use experimental evidence to shed light on the impact of vet on the following outcomes for stu-dents in concomitant modality: probability to graduate at correct age and attendance rate in regular education, academic achievement in Math and Portuguese in regular education.
Moreover, the benefits of Vocational and Technical Education may go further the economic dimension. For example, there is a well established literature on the negative relationship between education, crime and risky behavior (Sabates, 2008; 2009, Sabates and Feinstein, 2008)3. The four main channels through which schooling might mitigate criminal participation according to this literature are: (i) income effects, (ii) time availability, (iii) patience or risk aversion, and (iv) social networks or peers of individuals. Education enhances the opportunity cost of illegal behavior, since it increases wage rates, and, consequently, the opportunity costs of crime (Lochner, 2004, Lochner and Moretti, 2001, Hjalmarsson, 2008). Besides, time spent in education may also reduce time available for participating in criminal activity (Tauchen et. al, 1994, Jacob and Lefgren, 2003, Luallen, 2006, Anderson, 2010), which could be an important channel for youth enrolled in concomitant modality of vocational education. Education may change individuals preferences, modifying their patience or risk aversion. More patient and risk-averse individuals would give more value to the possibility of future punishments (Lochner and Moretti, 2001, Oreopoulus, 2007). Finally, young people are highly influenced by their peers and environment (Chowdry et al, 2009, Center for Mental Health in Schools at UCLA, 2007), and school may provide an environment through which teenagers enhance their networks and increase their relationship with peers, who could influence their probability of not engaging in crime and risky behavior. The main VET program carried out in Brazil was launched in 2011 by the Federal Government, and it has become one of the Brazilian largest VET programs of all time: Pro-grama Nacional de Acesso ao Ensino Técnico e Emprego – PRONATEC (National Program of Access to Professional Education and Employment). The aim of the program is to expand access to VET in Brazil, promoting labor market opportunities to the population (Souza et al., 2015). Despite this recent effort, the number of students who decide to follow a technical track in secondary education is still a small portion of the total high school enrollments in Brazil. In 2015, the number of students enrolled in general education exclusively was around
3 For studies in economic field, see Machin (2011), Lochner and Moretti (2001), Machin et al. (2011),
Grogger (2000), Hjalmarsson (2008), Machin and Meghir (2004), Lochner (2004), Tauchen et. al (1994), Jacob and Lefgren (2003), Luallen (2006), Anderson (2010).
6.4 million, whereas the number of students enrolled in Technical education was 1.7 million -including subsequent4 modality (INEP, 2016). When analyzed over time, however, it is clear that technical courses are attracting more students in recent years, comparing to general secondary education. In 2007, 95.2 % of the Brazilian secondary students were enrolled in general education, and 4.8 % of them were enrolled in vocational education; while in 2015, 8.7 % of the secondary students were enrolled in vocational education (considering only concomi-tant and integrated modalities). However, these numbers are still far from those in similar Latin American countries. The ratio of young students enrolled in vocational education in Colombia and Mexico is 28 % and 38 %, respectively. In comparison to some developed coun-tries, the discrepancy is even higher: the share of students enrolled on vocational education in Italy is 56 %, in Austria is 71%, in Switzerland is 62%, and the OECD average is 40% (OECD, 2007 and 2016).
One of the main challenges when evaluating the impact of VET courses on labor market and other outcomes is to isolate the effects exclusively assigned to the abilities devel-oped by the program from those that are inherent to the individual. There are unobservable characteristics that can influence individuals’ decisions and generate selection bias on im-pact estimation. To deal with endogeneity and estimate the causal effect of PRONATEC5, this paper explores its random assignment 6 identified in some circumstances. Furthermore, we constructed a unique dataset (using primary data collected through a survey and ad-ministrative data) to evaluate the impact of "Bolsa Formação Estudante", a voucher-type scholarship of PRONATEC, targeted to low-income students, on labor market and human capital outcomes; crime and risky behavior; and non-cognitive skills.
In this study, we contribute to the literature by providing rigorous evidence of the impact of VET programs in Brazil. We take advantage of the randomization used to select beneficiaries to the PRONATEC Program to identify its impact. Besides, our unique dataset allows us to investigate the impact of technical education on the development of non-cognitive skills, crime and risky behavior, for which there is a lack of evidence in the literature. The first challenge of the study is that this experimental design is a randomization with waiting list (Abdulkadiroglu et al., 2011, Behaghel et al., 2015, Curto & Fryer, 2014, Chaisemartin
4 Students enrolled in the subsequent modality have already graduated secondary education, thus being
only enrolled in the technical component.
5 We are looking to a particular modality of PRONATEC, named Bolsa Formação Estudante, which is
provided by a private institution, called S-System (a group of nonprofit entities that carry out private activities of public interest). Considering professional and technical education supply, the two most impor-tant entities of the S-System are SENAI (industry’s national learning service) and SENAC (commerce’s national learning service). From now on, we are going to refer to this specific design of the program as PRONATEC.
6 Providers can choose their selection criteria when there is excess of demand for the program. Particularly,
and Behaghel, 2015). To address this problem, we applied the technique proposed by Chaise-martin and Behaghel (2015), which (for each class) classify into treatment group individuals who received a random number strictly lower than the random one received by the last stu-dent who had an offer to enroll in the course. Individuals who were ordered by a random number strictly greater are assigned to control group. The authors show that in expectation both groups contain the same proportion of accepters, making them statistically comparable. Our second challenge is the fact that our randomization is pooling several lotteries, since the randomization level was the class. Chaisemartin and Behaghel (2015) show that their results still hold when several lotteries are conducted. However, to ensure the balance of the proportion of accepters between both groups, we must use inverse probability of being invited to enroll in the course reweighting7. Moreover, we had a high rate of attrition (65%), largely due to missing or outdated telephone numbers. Thus, we split our administrative data in two groups: administrative data from the lottery ("Administrative 1" - which contains only, for each class, individual’s name and order in the lottery - without any additional information) and administrative data with individual’s information ("Administrative 2" - from S-System and Secretariat of Education of the State of Santa Catarina).
Comparing "Administrative 1" data with our sample, we found that attrition is asymmetric across treatment and control groups, while comparing "Administrative 2" data with our sample, attrition is not significantly correlated with treatment. First, as our balance checks show that there are no statistically significant differences between treatment and control groups, we make an assumption that as both groups are likely to be well balanced in observed variables, they are likely to be well balanced also in unobserved variables as well. In order to test the robustness of our estimations, we performed hypothesis tests using randomization inference8. Results from randomization tests for our ITT coefficients corroborated the ones we found using conventional ones. Notwithstanding, attrition can bias our estimations if unobserved characteristics are correlated with sample attrition and the outcomes analyzed in this study. For these reason, in a second exercise, we relax the hypotheses that both groups are likely to be well balanced in unobserved characteristics. We try to deal with attrition applying the nonparametric method from Lee (2009), which construct extreme bounds for the intervention effects when there are significant differences in attrition rates between treatment and control groups. Unfortunately, it leads to wide nonparametric bounds on treatment impacts, which are not very informative.
Finally, our study must consider that the program compliance was not perfect. Only
7 Rosenbaum Rubin (1983), Frölich (2007).
8 Fisher (1935), Young (2016), Hayes (2000). The distribution of randomization tests does not depend of
asymptotic theorems or distributional assumptions. Randomization satisfies the exchangeability assump-tion of the test: that is, the treatment allocaassump-tion can be permuted across observaassump-tions.
a fraction of the individuals took up the treatment. In order to avoid the reintroduction of selection bias, we must compare all individuals initially assigned to the treatment group to all those allocated to the comparison group, regardless of their actual treatment status (Duflo et al., 2007). With imperfect compliance, the randomization generates an instrument Zi for the treatment of interest Ti. Thus, our main estimates are an ITT, and, when using the lottery as an instrument, a LATE.
Our main results, considering our whole sample, indicate that, at least in the short-run, there is no effect of PRONATEC on labor market outcomes, such as employment and formal work probability and wages. Furthermore, we found no effect of the program on socio-emotional, crime and risky behavior outcomes. However, our results point towards a possible heterogeneity on the impact of the program, since we find positive and significant effects of PRONATEC considering only the subsample of women, specially in labor market (formal work probability and wages) and socio-emotional (extraversion) outcomes.
This study is organized as follows: section 2 briefly describes the PRONATEC Pro-gram. Section 3 contains the program experimental design, and presents the data. Section 4 describes our empirical strategy. Sections 5, 6 and 7 contain a briefly review of the related literature and the results for labor market and human capital, non-cognitive skills, crime and risky behavior outcomes, respectively. Section 8 presents the conclusion.
Programa Nacional de Acesso ao Ensino Técnico e Emprego – PRONATEC (National Pro-gram of Access to Professional Education and Employment) began in Brazil in 2011 and became one of the largest VET programs. The main objective of the program is to increase the access to VET and foster labor market opportunities to the population. The Federal Gov-ernment designed several actions to achieve this target, increasing the number of institutions providing VET courses, the number of courses and vacancies available and subsidizing tech-nical education for vulnerable students (Souza et al., 2015). There are three different levels of VET courses offered by PRONATEC: i) initial and Continued (FIC), which can be coursed with any level of education; ii) technical education, which requires primary school level and is equivalent to an high school degree; iii) and technological education, which requires high school education to be coursed and is equivalent to university degree.
Figure 1 shows the different levels of the Vocational System, the educational degrees granted by each one and its different modalities. Technical education can be attended con-currently with high school, in concomitant and integrated modalities, or after graduating secondary education, in subsequent modality. Students enrolled in the integrated modality study both general and vocational education at the same institution. The ones attending the concomitant modality also study both general and vocational education, but each component is studied in different schools. Students enrolled in the subsequent modality have already graduated secondary education, thus being only enrolled in the technical component.
Figure 1 – Levels of Vocational System in Brazil
Source: Souza et al., 2015
In 2014, year in which the program reached its maximum number of enrollments, PRONATEC offered 646 types of initial and continued courses and 227 technical courses across 4,300 municipalities, and SENAI was responsible for providing 360 FIC courses and 63 technical courses across 2,237 municipalities. Moreover, SENAI was responsible for 41 % of the whole enrollments of PRONATEC - considering all kind of courses covered by the program - (SENAI, SESI and IEL- Relatório Anual 2014, MEC, 2014). The extension of FIC courses are at least 160 hours, while technical course loads are at least 600 hours. Despite this recent VET scale-up, technical education still corresponds to a small percentage of total number of enrollments in high school level in Brazil. In 2015, 7.7 million students attended general education exclusively, whereas 1.7 million students were enrolled in technical education (including subsequent modality).
Particularly in the state of Santa Catarina, where we collected information from former students of technical education, there was, in 2015, 230.7 thousand students enrolled exclusively on general education, while there was 57.6 thousand students enrolled on vo-cational education - including subsequent modality (INEP, 2016). However, when analyzed over time, it is clear that the number of enrollments on vocational education is proportionally increasing more than the number of enrollments on general education (Figure 2). And this
path is also verified at Santa Catarina (Figure 3).
Figure 2 – Technical VS General Secondary Education in Brazil
Source: INEP/MEC. Technical Secondary Education covers integrated, concomitant and subsequent modal-ity. General Secondary Education is the sum of enrollments in general secondary education and teaching degree (magistério). It does not include enrollments in integrated modality of technical education, special education (educação especial) and youth and adult education (EJA)
Figure 3 – Technical VS General Secondary Education in Santa Catarina
Source: INEP/MEC. Technical Secondary Education covers integrated, concomitant and subsequent modal-ity. General Secondary Education is the sum of enrollments in general secondary education and teaching degree (magistério). It does not include enrollments in integrated modality of technical education, special education (educação especial) and youth and adult education (EJA)
The composition of enrollments in Brazil, according to course modality, also has changed in recent years. In Figure 4 it is clear that integrated modality have proportionally increased the number of enrollments more than concomitant and subsequent ones, followed by subsequent modality, which is still the greatest modality in absolute number of enrollments. In 2007, integrated was the least demanded course modality, when compared to subsequent and concomitant ones. Meanwhile, this pattern has changed over the years: since 2011 it has more students enrolled than concomitant modality. In Santa Catarina, according to Figure 5, we note the same pattern: subsequent modality is also the most demanded, despite enrollments in integrated modality proportionally increased more than in other ones. Nevertheless, in contrast to Brazil, it still has less students than the other two modalities.
Figure 4 – Technical Education in Brazil, by course modality
Source: INEP/MEC.
Figure 5 – Technical Education in Santa Catarina, by course modality
Source: INEP/MEC.
PRONATEC is composed of six smaller programs: i) Bolsa Formação (Training Scholarship); ii) FIES Técnico (Technical FIES); iii) E-Tec Network; iv) S-System Agree-ment; v) Brasil Profissionalizado (Professionalized Brazil); and vi) Expansion of the Federal Network (Souza et al., 2015). This study focuses on Bolsa Formação program, a
voucher-type scholarship and one of the most important PRONATEC initiatives. Particularly, we investigate the modality of the program named Bolsa Formação Estudante - targeted to low-income students enrolled in secondary school from public schools. Bolsa Formação can be provided by public or private institutions - by federal and state schools, or by National Service for Apprenticeship (S-System)1, and courses are free of charge. These possibility of different providers is aligned with an important question about the most effective ways of delivering the program, whether by expanding the public network or whether by boosting partnerships with private institutions that already have the infrastructure and expertise on providing technical courses.
In addition, their private administration enables a wider flexibility to adjust the quality of technical courses offered in order to meet labor market demand. In this study, we aim to provide evidences of the effects of at least one of this program designs: Bolsa For-mação Estudante provided by S-System institutions (National Service of Industrial Training (SENAI, Serviço Nacional de Aprendizagem Industrial) and National Service for Commercial Training (SENAC, Serviço Nacional de Aprendizagem Comercial) - the two most important providers of technical education among S-System). The main reason for this choice was their selection criteria, through which we can identify rigorously the impact of this specific inter-vention. The majority of the courses in our study was provided by SENAI, only two courses were from SENAC.
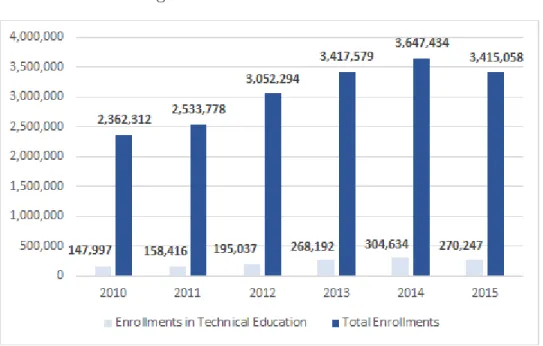
The S-System was created in the 1940s in order to improve the quantity and quality of the workforce, meeting the labor market demand. Today, it is the most important private provider of technical education in Brazil, specially through SENAI (the greatest provider among all S-System institutions), and the quality of its courses is widely recognized by students and by employers. SENAI, in 2014, was responsible for 41 % of the whole enrollments on PRONATEC (taking into account all several different modalities covered by the program), and was considered the most important private provider of technical education in Latin America (SENAI, SESI and IEL- Relatório Anual, 2014). Figure 6 shows the number of enrollments at SENAI over past years. For each year, first column represents the number of enrollments only in technical education, while second column accounted for total number of enrollments at SENAI - regardless the kind of course offered and not only those provided to PRONATEC (for example, short-duration, technological, initial and continuing training courses). It seems that SENAI is an important player on VET provision: in 2015, for example, it was responsible for about 16% of the enrollments on technical education in Brazil.
1 We are following National Institute of Studies and Research (INEP), who classified S-System as a private
Figure 6 – Enrollments at SENAI
Source: SENAI, SESI and IEL- Relatório Anual 2012 - 2015
VET courses are offered by S-System in concomitant and subsequent modalities; and are open to all individuals, since they meet the educational degree requirements: students must have completed at least the first year of secondary school. Moreover, to obtain a tech-nical degree, a student must successfully complete his studies on general secondary education and on technical education. Even though more complete than a general school degree, from the educational system perspective these two are equivalent, as both allow you to access tertiary education. The course costs vary according to their area and state. Students who were awarded with Bolsa Formação can attend classes at no cost, since it is sponsored by the government.
As a consequence, there is a large number of students interested in subscribing to technical education, and this design of the program usually faces excess of demand. In this case, institutions can choose which eligibility and selection criteria to apply. They can, for example, select candidates through an entrance exam; or using age, low-income, or quotas for students from public schools as a priority criteria; they can also use ordering/randomization criteria. S-System institutions from Santa Catarina chose to select their candidates through a randomization criteria. Thus, for each class of technical course offered, when the number of candidates was bigger than the number of vacancies available, the candidates were randomly selected through a lottery. This random assignment of the vacancies allows us to rigorously identify the causal effect of the program on several outcomes, for example: labor market, human capital, risky behavior and non-cognitive skills.
Technical courses offered by Bolsa Formação Estudante have at least 800 classroom hours. The ones from our study have on average 1200 hours of course load and their course duration is 2 years.
The study was conducted in four municipalities in the state of Santa Catarina, Brazil: Chapecó, Itapiranga, São Miguel do Oeste and Xanxerê. Municipalities were selected for two reasons: i) there was excess of demand for the program, ii) we could find the official registers of the lotteries. Consequently, we had access to the documents for the years of 2012, 2013 and 2014, which contained the list with the order and names of individuals who where selected (and of the ones who were not), in each class, for these four specific municipalities in the state. We conducted a survey and collected primary data in order to construct a unique database, interviewing individuals who were and the ones who were not awarded with PRONATEC scholarship for the years of 2012 (Chapecó), 2013 (all the four municipalities) and 2014 (Chapecó) at SENAI and SENAC. The survey was composed by several outcome dimensions, including socioeconomic condition, labor market outcomes, self reported crime and risky behavior participation. We also applied a non-cognitive instrument to take a measure of individuals’ socio-emotional skills.
One important issue about the best way of delivering technical education is finding a balance between academic and vocational contents. It is important to not enhance the cost of vocational education for youth, in terms of time and effort, due to its extensive course load. To investigate this possible channel, in addition to the primary data collected, administrative data were used to identify, for students in concomitant modality, their academic achievement and attendance rate at general education school. We also verified if they graduated in general education at correct age.
3.1
Administrative Data
There are two main sources of data to this study: administrative and primary data. The last one was collected on a survey and is detailed in the next section. Administrative data, which contains individual level baseline information, comes from SENAI and Secretariat of Education of the State of Santa Catarina database. They provide baseline variables like age, sex, education degree and color. Moreover, it is possible, through official documents of the lottery, to identify the random number assigned to each individual, which is his invitation
to enroll in the course ordering. From this random number we constructed the variable, Zi, which identifies students’ treatment status, after the second round of enrollment, at "Administrative 1" data. At the end of these classification, we had 2007 individuals, 1475 assigned to treatment and 532 to control group. Merging individuals’ names with their telephone number, available at "Administrative 2" data (from SENAI and Secretariat of Education of the State of Santa Catarina), allowed us to get in touch with most program subscribers1. Considering only "Administrative 2" data, we had 1419 individuals, 1,186 from treatment group and 233 from control group. However, there were some missing or outdated contacts on "Administrative 2" registries, and this was our second source of attrition in the study. The third source of attrition was individuals who we could contact but were not available, or did not want to participate on the survey.
For all individuals whose administrative information in baseline covariates was found, we carried out balance checks. We also made these tests using time invariant covariate vari-ables from our survey dataset, in order to evaluate the balance of the sample collected. Results of these last tests are presented in the next section. Furthermore, for those indi-viduals who were enrolled on concomitant modality, administrative data form Secretariat of Education system also provided information about their academic achievement at secondary general education, and about their attendance rate and graduation at correct age in general education. These data are used to investigate if there is a channel through which VET can damage students, enhancing their cost of attending vocational education in terms of effort and time. We estimate the impact of PRONATEC on students’ academic achievement, and on their general education graduation at correct age.
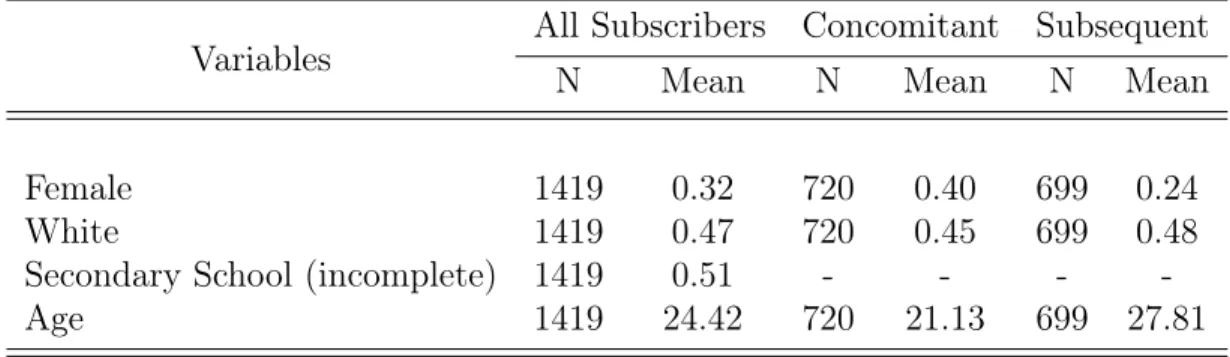
First, we show descriptive statistics from "Administrative 2" data, in order to briefly display information about the profile of students who looked for vocational education supplied by the intervention. Overall, we can note in Table 1 that vocational education courses were more demanded by men (only 32% of all subscribers were women), and white2. Considering course modality, it seems that demand is well balanced between concomitant and subsequent modality (the number of vacancies were according to the class, regardless the modality - both concomitant and subsequent students attended the same class). Moreover, subscribers are currently on average 24 years old. Analyzing separately for each course modality, concomitant has greater proportion of women enrolled than subsequent courses, 40% versus 24%. The percentage of individuals declared as white is quite similar in both modalities. Students enrolled for concomitant courses, as expected, are younger - they are current on average 21
1 Individuals with no information at "Administrative 2" data were our first source of attrition
2 This variable is not very precise on administrative data, because for 37% of the individuals it was
re-ported as "not informed" or "color not declared", it seems that this information was not well filled on administrative data, only 16% of this information was reported as other color than white
years old, while students enrolled on subsequent modality are current 28 years old.
Table 1 – Descriptive Statistics of Administrative Data with Individuals’ Information, by course modality
Variables All Subscribers Concomitant Subsequent
N Mean N Mean N Mean
Female 1419 0.32 720 0.40 699 0.24
White 1419 0.47 720 0.45 699 0.48
Secondary School (incomplete) 1419 0.51 - - -
-Age 1419 24.42 720 21.13 699 27.81
Source: author’s elaboration using administrative data.
3.2
Survey Information and Descriptive Statistics of the Sample
We conducted a survey from June to August of 2016 using a team of undergraduate students surveyors. They were trained and supervised by the authors of this study. The interviews occurred at SENAI’s schools in the municipalities of Chapecó and Xanxerê. For the mu-nicipalities of Itapiranga and São Miguel do Oeste, due to budget constraints, we made the survey through telephone interviews. Answering the survey was not mandatory, but the large number of candidates who we could contact agreed to participate of the study. The main source of attrition was outdated telephone numbers, not participation agreement. All interviews, including the ones made by telephone, were supervised in person by the authors. The survey was an individual level questionnaire. It included questions of demo-graphic and socioeconomic characteristics (age, sex, color, education degree, educational level of the parents and household condition). It also contained a labor market module (wage, labor market status, formal work status, area of work); and a self reported crime and risky behavior participation. Our measure of crime in this study is the self-reported engagement in some illegal activities, such as participation in an argument or fight, sale of pirate goods, sale of drugs, sale of stolen goods (all these questions were considering time period of the last four years) and drink and drive (which could also be classified as a risky behavior). Our self-reported measures of risky behavior are: use of alcohol, cigarette, marijuana, and other drugs; use of alcohol more than twice a week, and binge drinking (5 or more alcoholic drinks for males and 4 or more alcoholic drinks for females on the same occasion)3.
We also applied a non-cognitive instrument to measure individuals non-cognitive skills. It is an instrument for the measurement of social and emotional skills, developed by
Ayrton Senna Institute (a non-profit organization focused on improving the quality of educa-tion), and named SENNA (Social and Emotional or Non-cognitive Nationwide Assessment). SENNA was designed to be a simple instrument, and one robust enough to be applied in large samples. At the same time, it was designed to be precise and interpretable enough, in order to be used scientifically in studies (Santos and Primi, 2014, p.29).
One important issue on evaluating non-cognitive skills is identifying which ones are relevant and the best way to measure them. One of the most applied theoretical model is the Big Five personality traits, also known as the five factor model (FFM), which groups personality traits in five basic dimensions: agreeableness, conscientiousness, extraversion, neuroticism and openness to experience. "The “Big Five” are latent constructs obtained by factor analysis performed on the answers to extensive questionnaires with varied questions about behaviors that are representative of all the personality characteristics that an individ-ual could have" (Santos and Primi, 2014, p. 16). Agreeableness is defined as the tendency to be cooperative and unselfish. A conscientiousness person is organized, hard working and responsible. "The conscientious individual is characterized as being efficient, organized, au-tonomous, disciplined, lacking impulse and guided towards his objectives (a fighter)" (Santos and Primi, 2014, p. 19). Extraversion is the characteristic of being friendly, sociable, self-confident and enthusiastic. Neuroticism is defined as the consistence of emotional reactions. An unstable individual is defined as short-tempered, introspective and impulsive. Finally, an open to experience individual is characterized as someone open to new aesthetic, cultural and intellectual experiences. He is often imaginative, curious and unconventional (Santos and Primi, 2014). SENNA provides us latent measures of agreeableness, conscientiousness, extraversion, neuroticism, openness to experience and locus of control4.
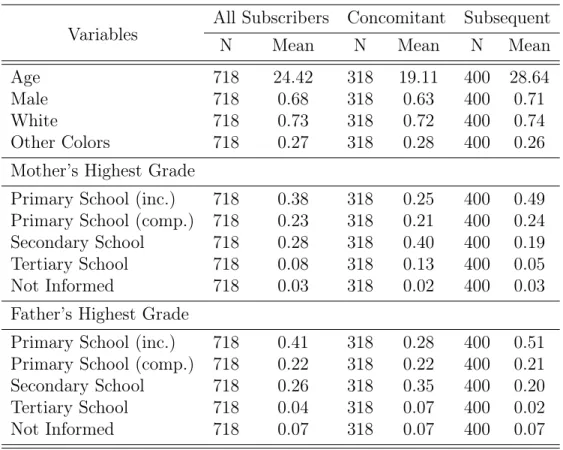
We first present descriptive statistics of the sample, using survey data. Summary statistics are quite similar to the ones from administrative data. Our sample has 718 indi-viduals, 594 assigned to treatment and 124 to control group. It is possible to see in Table 2 that individuals are on average 24 years old, most of them are men and white. Considering family background, it seems that most of them have a disadvantage background, the high-est education from either mother and father is incomplete primary school, 38% and 41%, respectively. Only 8% had mother with tertiary school degree, and considering the father this number is even smaller 4%. Splitting by course modality, students profile have some differences: concomitant students are younger, on average 19 years old, most of them are men, white and with parents who studied until secondary school; subsequent students are older, on average 29 years old, their proportion of male students is even higher, 71%, white
4 Locus of Control is defined as a measure of how much "individuals attribute current experiences either to
and most of their parents have not even completed primary school. Table 2 – Descriptive Statistics of the Sample
Variables
All Subscribers Concomitant Subsequent
N Mean N Mean N Mean
Age 718 24.42 318 19.11 400 28.64
Male 718 0.68 318 0.63 400 0.71
White 718 0.73 318 0.72 400 0.74
Other Colors 718 0.27 318 0.28 400 0.26
Mother’s Highest Grade
Primary School (inc.) 718 0.38 318 0.25 400 0.49 Primary School (comp.) 718 0.23 318 0.21 400 0.24
Secondary School 718 0.28 318 0.40 400 0.19
Tertiary School 718 0.08 318 0.13 400 0.05
Not Informed 718 0.03 318 0.02 400 0.03
Father’s Highest Grade
Primary School (inc.) 718 0.41 318 0.28 400 0.51 Primary School (comp.) 718 0.22 318 0.22 400 0.21
Secondary School 718 0.26 318 0.35 400 0.20
Tertiary School 718 0.04 318 0.07 400 0.02
Not Informed 718 0.07 318 0.07 400 0.07
Source: author’s elaboration using survey data.
3.3
Classification of individuals in Treatment and Control Groups
One specific characteristic of the design of this program is that participating is not manda-tory. It means that individuals awarded in the lottery may not take part of it. In this case, according to the Federal Guideline for "Bolsa Formação" management (Ministry of Educa-tion, 2011, p. 31), providers can call students in the waiting list to fulfill these remaining vacancies, as long as they follow its order of classification. Municipalities chosen for this study decided to randomly select beneficiaries for the program, as well as for the waiting list. Individuals were classified according to the order through which they were awarded in the lottery. The ones classified from 1 to 35 were assigned to the beneficiary group and the ones from 36 and over were assigned to the control group. Individuals from control group still could participate of the program whether the seats were not completely filled. If an individual assigned to beneficiary group decide to not participate of it, or if suppliers could not contact him in able time, they can call the first individual assigned to the control group, that is, the 36th awarded in the lottery, and so on.
Therefore, for each class, until the program fill all vacancies, the control group clas-sification works as a waiting list. This process is called by PRONATEC as first and second round of enrollment. In other words, for each class, n students applied to enter in a specific technical course where v < n vacancies are available. We know that 35 seats are available for each class, thus v = 35. Each student received a random number Ci ∈ [1, n]. Individuals with Ci ≤ v received an offer to attend classes. If all 1 ≤ Ci ≤ 35 individuals accepted the invitation, no other potential student received an offer. If d students denied, students with v < Ci ≤ v + d received an offer, and so on until all v vacancies were filled. Using adminis-trative data from SENAI, we could identify, for each class, the last individual who received an offer, defined as τ . Thus, define Wi = 1 individuals with Ci ≤ τ and Wi = 0 individuals with Ci ≤ τ Moreover, treatment and control groups may not be statistically comparable, because the group of Wi = 1 individuals may have a greater proportion of accepter than the Wi = 0 one (Chaisemartin and Behaghel, 2015). To address this problem, we applied the technique proposed by Chaisemartin and Behaghel (2015) through which the new variable is constructed as follows: Zi = 1{Ci < τ }−1{Ci = τ }. This slight modification implies that in expectation both groups contain the same proportion of accepters, making them statistically comparable.
Table 3 shows the distribution of individuals assigned to Treatment and Control groups at first and second round of enrollment in our sample (due to the adjustment required by the instrument, our final sample size is of 718 individuals). First and second columns present the distribution of individuals assigned to control and treatment groups at second round, respectively. 124 individuals belong to control group in both rounds, that is, they have never been called to participate of the program in any of the rounds. 443 individuals were assigned to treatment group at first round and have been called to participate of the program. This way, they have been assigned to treatment group in both rounds. 151 students were assigned to control group at first round, but have been called to the program in order to fill remaining vacancies, so they were assigned to treatment group at second round. Thus, after second round, total number of individuals in treatment group is 594 and in control group is 124.
Table 3 – Distribution of Treatment and Control groups at First and Second Round of En-rollment
Second Round
Control Treatment Total
First Round
Control 124 151 275
Treatment 0 443 443
Total 124 594 718
3.4
Attrition
There are 3 sources of attrition in our study, as displayed in tables 4 and 5. From the 2007 individuals listed at "Administrative 1" data, we could find baseline information and, the most important, telephone numbers for only 1,419 individuals: 1,186 were assigned to beneficiary group and 233 to control group.
The first one explains the difference of observations between our database "Admin-istrative 1" and our final sample. This is due to the fact that PRONATECs official system only records information for individuals called in the first round, and in the second round up to the number of vacancies existing in the first round. So, for a course with 35 vacancies, the system only recorded information for the 35 students called in the first round, and up to 35 in the second round. The information for all remaining students in the second round (those that randomly received a ranking number above 70) was not recorded in the system. Therefore, the first source of attrition is related to this guidelines form the government and, hence, is not related to unobservable characteristics of the individuals. The second source of attrition is due to outdated phone numbers. The third source of attrition is explained by those students who were successfully contacted but refused to participate in the survey. It is important to notice that sources 2 and 3 of attrition are not correlated with treatment, as displayed in Table 8.
Table 4 – Number of successful interviews considering all subscribers from administrative data, by treatment status
Treatment Control
N % N %
Number of interviews 594 40.27% 124 23.31% Total number of subscribers 1,475 532
Source: author’s elaboration using survey and administrative data.
Table 5 displays attrition rates considering "Administrative 2" data (subscribers we had administrative data with phone information but we could not contact or interview), by treatment status, for all subscribers, separating it according to course modality: concomitant and subsequent and for female and male - for all subscribers, concomitant and subsequent.
Table 5 – Attrition rates considering administrative data with phone information, by treat-ment status Treatment Control N % N % All subscribers 437 58.89 305 41.11 Concomitant 114 59.38 78 40.63 Subsequent 323 58.73 227 41.27
Male (all subscribers) 264 56.05 207 43.95 Female (all subscribers) 173 63.84 98 36.16
Male (concomitant) 58 53.7 50 46.3
Female (concomitant) 56 66.67 28 33.33 Male (subsequent) 206 56.75 157 43.25 Female (subsequent) 117 62.57 70 37.43
Source: author’s elaboration using survey and administrative data.
For each municipality, each class has his own lottery, thus, it is important to show how many individuals were interviewed in each course. Table 6 shows the number of individuals (both, treatment and control group) that were interviewed, according to their municipality and the course they were enrolled in.
Table 6 – Number of interviews by municipality and course
Course Chapecó Itapiranga S. M. Oeste Xanxerê Total
Mechanics 88 0 0 42 130 Administration 12 0 0 0 12 Pharmaceutical 0 0 6 0 6 Computer Network 66 0 0 0 66 Workplace Safety 128 0 7 26 161 Building 19 0 0 0 19 Electrotechnology 52 41 21 0 114 Electronics 15 0 0 0 15 Informatics/Comp. Maintenance 0 28 13 18 59 Electromechanics 0 0 27 43 70 Food Technology 31 0 35 0 66 Total 411 69 109 129 718
Source: author’s elaboration using survey and administrative data.
The numbers presented on Tables 4 and 5 show that we must pay attention to a common challenge existing in almost all empirical evaluations: attrition. According to the literature, "random attrition will only reduce a study’s statistical power; however, attrition
that is correlated with the treatment being evaluated may bias estimates" (Duflo et al., 2007, p. 58). Moreover, the independence of potential outcomes between the treatment and control groups, once ensured by the randomization, does not hold if the attrition is systematically correlated with the treatment.
As we had a large rate of attrition in our study, specially due to the difficulty of following up subscribers years later they have made their inscription in the program, it is important to verify if it was correlated with the treatment or not. There was many outdated registers, and this was the main reason why we were not able to contact all students subscribed to participate of the program. However, almost all candidates we could contact agreed in participating of the study. Therefore, our main source of attrition was outdated telephone numbers, not participation consent. We imagine that the asymmetric distribution of attrition, considering "Administrative 1" data are likely to be associated with the fact that administrative employees did not fill information for individual who received a random number too far from 35 (for example, 95), and were not likely to receive an invitation to enroll at the course.
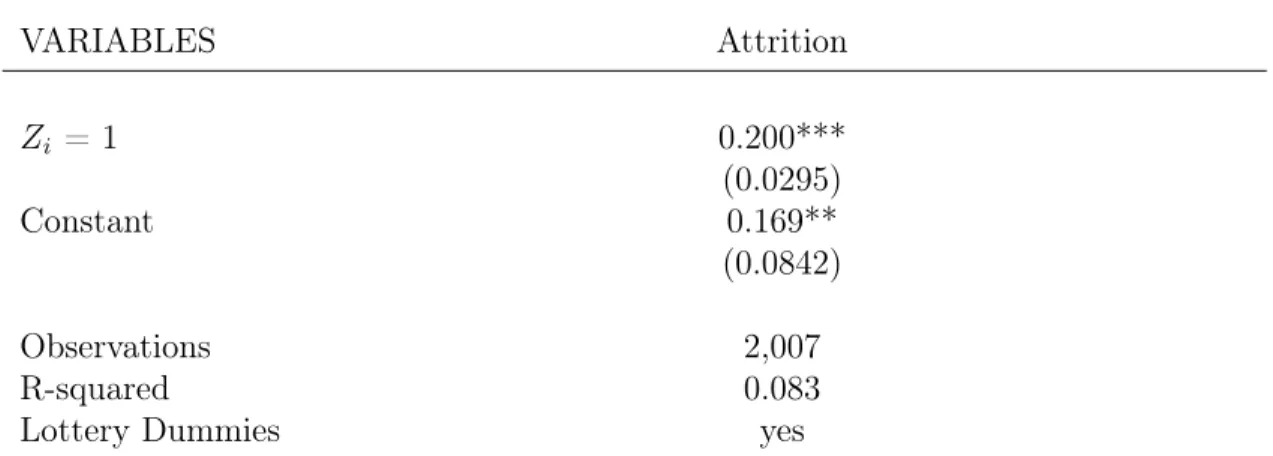
We ran OLS estimations for "Administrative 1" (Table 7), and "Administrative 2" data (Table 8) in order to investigate if the attrition is correlated with the treatment. Dependent variable is an indicator of attrition, a dummy variable that assume value equal to one if we interviewed student i, and equal to zero otherwise. Our treatment is a dummy variable that assume value equal to one if individual i is assigned to treatment group, and equal to zero otherwise.
Finally, our randomization is pooling several lotteries5, since the randomization was made for each class. Chaisemartin and Behaghel (2015) show that their results still hold when several lotteries are conducted. However, to ensure the balance of the proportion of accepters between both groups, we must use inverse probability of been called to enroll in the course reweighting6.
Considering "Administrative 1" data, Table 7 shows that there is a statistically signif-icant correlation between attrition and the treatment. However, considering "Administrative 2" data, Table 8 displays that there is no statistically significant correlation between attrition and the treatment. Besides, as we can see in Tables 9 and 10 it seems that both treatment and control groups (using "Administrative 2" data), are likely to be well balanced in observed characteristics (using inverse probability of being called reweighting in our balance checks).
5 Behaghel et al. (2015).
Table 7 – OLS estimation for correlation between attrition and treatment status ("Adminis-trative 1" data, using all subscribers)
VARIABLES Attrition Zi = 1 0.200*** (0.0295) Constant 0.169** (0.0842) Observations 2,007 R-squared 0.083
Lottery Dummies yes
Robust standard errors in parentheses. *** p<0.01, ** p<0.05, * p<0.1.
Note: To address the imbalance created by pooling lottery strata, all equations contain inverse probability reweighting.
Thus, even if there is a significant correlation between attrition and treatment (con-sidering "Administrative 1" data), treatment and control groups in both data ("Administra-tive 2" and survey data from our sample) are likely to be well balanced in observed variables, than, we make an assumption that, they are likely to be well balanced even in unobserved variables as well. We test the robustness of our estimations using this assumption using hypothesis tests through randomization inference7. Results from randomization tests8 cor-roborated the ones we found using conventional ones. That is, outcomes with treatment coefficients that are significant on conventional tests remained statistically significant using randomization tests.
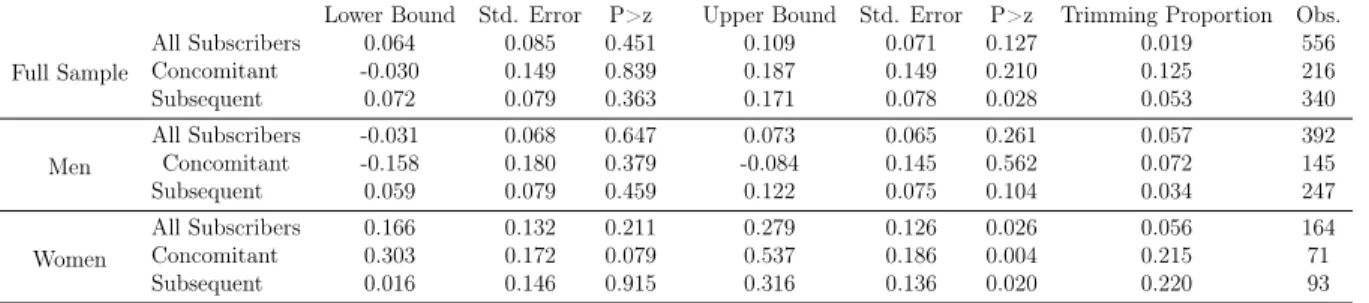
Nonetheless, attrition can bias our estimations if unobserved characteristics are cor-related with sample attrition and the outcomes analyzed in this study. For these reason, we relax the hypotheses that both groups are likely to be well balanced in unobserved charac-teristics. We try to deal with attrition applying the nonparametric method from Lee (2009), which construct extreme bounds for the intervention effects when there are significant dif-ferences in attrition rates between treatment and control groups. Unfortunately, it leads to wide nonparametric bounds on treatment impacts, which are not very informative. Results for this estimation are also reported at the Appendix (Table 51).
7 Fisher (1935), Young (2016), Hayes (2000). An advantage of this test is that his distribution does not
depend of asymptotic theorems or distributional assumptions. Furthermore, randomization satisfies the exchangeability assumption of the test: that is, the treatment allocation can be permuted across obser-vations.
8 We exchange within strata one thousand different placebo groups and estimate by OLS the intention to
Table 8 – OLS estimation for correlation between attrition and treatment status ("Adminis-trative 2" data) VARIABLES Attrition Zi = 1 -0.0122 (0.0525) Age 0.00133 (0.00332) Male 0.0758** (0.0385) White 0.0617 (0.0562)
Color Not Declared -0.0744
(0.0605)
Secondary School (incomplete) -0.00689
(0.0467) Tertiary School -0.0675 (0.178) Constant 0.471** (0.229) Observations 1,408 R-squared 0.094
Lottery Dummies yes
Robust standard errors in parentheses. *** p<0.01, ** p<0.05, * p<0.1.
Note: To address the imbalance created by pooling lottery strata, all equations contain inverse probability reweighting.
Table 9 presents results for our balance check using administrative data from SENAI. Dependent variable is an indicator of the treatment status, a dummy variable that assume value equal to one if the individual was assigned to treatment group and equal to zero oth-erwise, using the variable Zi to identify treatment and control groups, described in the sub-section above. Besides, our estimation included lottery dummies and the inverse probability of Zi=1 reweighting proposed by Chaisemartin and Behaghel (2015) in order to ensure that both groups are statistically comparable, even when polling several lotteries9. Results show that only for one variable there was statistically significant differences between treatment and control groups. It seems that both groups are statistically comparable.
9 For all estimations, unless noted, we used this inverse probability of being called to enroll in the course
Table 9 – Linear probability model regressions for conditional mean difference test ("Admin-istrative 2" data), by course modality
VARIABLES
Z
i=1
Male
-0.0326
(0.0439)
White
-0.0820**
(0.0322)
Secondary School (incomplete)
-0.0250
(0.0386)
Tertiary School
0.148
(0.106)
Age
0.00283
(0.00293)
Constant
1.154***
(0.0868)
Observations
1,413
R-squared
0.147
Lottery Dummies
yes
Robust standard errors in parentheses. *** p<0.01, ** p<0.05, * p<0.1.
Note: To address the imbalance created by pooling lottery strata, all equations contain inverse probability reweighting.
Finally, we ran balance ckecks using observed characteristics from our sample data. Table 10 presents our balance checks through OLS regressions - a linear probability model to estimate a conditional mean difference test: dependent variable is an indicator of the treatment status, a dummy variable that assume value equal to one if the individual was assigned to treatment group and equal to zero otherwise. We use time invariant variables from survey data, and they are less noisy than the "Administrative 2" ones, since we do not have a way to verify how much employees were concerned to precisely fill those information on dataset. There are no significant differences between treatment and control groups, thus, it seems that both groups are likely to be statistically comparable.
Table 10 – Linear probability model regressions for conditional mean difference test (sample data), by course modality
VARIABLES Zi = 1 Male -0.0137 (0.0527) Age -0.00186 (0.00307) White 0.000261 (0.0287) Mother’s Highest Education
Primary School 0.0592 (0.0586) Secondary School 0.0700 (0.0586) Do not Know 0.0343 (0.0986) Father’s Highest Education
Primary School -0.0290 (0.0702) Secondary School -0.0805 (0.0697) Do not Know 0.0349 (0.0721) Constant 1.013*** (0.102) Observations 718 R-squared 0.142
Lottery Dummies yes
Robust standard errors in parentheses. *** p<0.01, ** p<0.05, * p<0.1.
Note: To address the imbalance created by pooling lottery strata, all equations contain inverse probability reweighting.
The main challenge on estimating the impact of Vocational Education and Training is to iden-tify only the effects resulting from the abilities acquired from this specific kind of Secondary Education. This study provides rigorous evaluation of these effects, since the treatment was randomly assigned. However, the evaluation of the voucher-type scholarship of PRONATEC’s Bolsa Formação must consider that the program compliance was not perfect. Only a frac-tion of the individuals that could have enrolled took up the treatment. In addifrac-tion, this intervention was designed as a randomization with waiting list, and as a consequence, some individuals that initially were allocated to the comparison group received the treatment. There are several challenges our study must address to properly identify the causal effect of the intervention.
First, in order to avoid the reintroduction of selection bias, we must compare all individuals initially assigned to the treatment group to all those allocated to the compar-ison group, whatever their actual treatment status (Duflo et al., 2007). In this context of imperfect compliance the randomization generates an instrument Zi for the treatment of in-terest Ti. According to the theoretical framework used by Angrist and Imbens (1994; 1995), under the assumptions of independence, exclusion restriction, existence of a first stage and monotonicity, the Local Average Treatment Effect (LATE) is the effect of treatment on the population of compliers. These are defined as those who, in the absence of the randomly assigned instrument, would not have been treated but are induced to receive treatment by the assigned instrument. Denote Zi the variable that is randomly assigned, while Ti remains the treatment of interest. Define Y0i the potential outcome for an individual if Zi = 0, and Y1i the potential outcome for an individual if Zi = 1.
Random assignment implies that the difference E[Y0i|Z = 1] − E[Y0i|Z = 0] is equal to zero, and that the difference E[Yi|Zi = 1] − E[Yi|Zi = 0] is equal to the causal effect of Zi. However, it is not equal to the effect of the treatment , Ti, since Zi is not equal to Ti. Because Zi has been chosen to at least affect the treatment, this difference is called the Intention to Treat estimate (ITT). On the other hand, if one is interested in the effect of the intervention (Ti) itself it is necessary to recover the LATE from the the ITT estimates (Duflo et al, 2007, Angrist and Imbens, 1994; 1995). In our study, we will estimate both ITT and LATE effects.