www.scielo.br/rbg
THE INITIAL STEPS FOR DEVELOPING THE SOUTH AMERICAN K INDEX
FROM THE EMBRACE MAGNETOMETER NETWORK
Clezio Marcos Denardini
1, Marlos Rockenbach da Silva
2, Mauricio Alfredo Gende
3, Sony Su Chen
1,
Paulo Roberto Fagundes
4, Nelson Jorge Schuch
2, Adriano Petry
2, Laysa Cristina Ara´ujo Resende
1,
Juliano Moro
1, Antonio Lopes Padilha
5, Nilson Sant’Anna
6and Livia Ribeiro Alves
5ABSTRACT.In this paper we present the first steps given towards the development of the South American K index (Ksa) based on the measurements made by the Embrace Magnetometer Network. We present: (a) a description of the magnetometer and of the network; (b) the procedure used to calibrate the network equipments; (c) the procedure to obtain each station K scale and its corresponding upper limits of ranges for the three-hour-range station K index (thereafter referred as K9 thresh-old); and (d) some particularities regarding the Quiet Day Curve (QDC) deviation and its long term variation.
Keywords: space weather, magnetic index, magnetometer network, aeronomy.
RESUMO.No presente artigo, apresentamos os primeiros passos realizados para desenvolvermos o ´ındice K sul-americano (Ksa) baseado nas medidas feitas pela rede Embrace de magnetˆometros. Apresentamos (a) uma descric¸˜ao do equipamento utilizado, bem como da rede de magnetˆometros; (b) o procedimento adotado para calibrar todos os equipamentos individuais da rede; (c) o procedimento para se obter a escala K de cada estac¸˜ao magn´etica e o seu correspondente limite superior para o ´ındice K de trˆes horas (doravante denominado limiar K9); e (d) algumas particularidades com respeito `a obtenc¸˜ao da curva do Dia Quieto (QDC) e suas variac¸˜oes de longos per´ıodos.
Palavras-chave: clima espacial, ´ındice magn´etico, rede de magnetˆometros, aeronomia.
1Instituto Nacional de Pesquisas Espaciais (INPE), Aeronomy Division (DAE), Av. dos Astronautas, 1758, Jardim da Granja, 12227-010 S˜ao Jos´e dos Campos, SP, Brazil. E-mails: clezio.denardin@inpe.br; sony.chen@dae.inpe.br; laysa@dae.inpe.br; juliano@dae.inpe.br
2Instituto Nacional de Pesquisas Espaciais (INPE), Southern Regional Space Research Center, Campus Universit´ario da UFSM, Cidade Universit´aria, Camobi, 97105-900 Santa Maria, RS, Brazil. E-mails: marlos.silva@inpe.br; njschuch@lacesm.ufsm.br; adriano.petry@crs.inpe.br
3Universidad Nacional de La Plata, Facultad de Ciencias Astron´omicas y Geof´ısicas, Paseo del Bosque s/n, B1900FWA La Plata, Buenos Aires, Argentina. E-mail: mgende@fcaglp.unlp.edu.ar
4Universidade do Vale do Para´ıba (UNIVAP), Instituto de Pesquisa e Desenvolvimento, Av. Shishima Hifumi, 2911, Urbanova, 12244-000 S˜ao Jos´e dos Campos, SP, Brazil. E-mail: fagundes@univap.br
5Instituto Nacional de Pesquisas Espaciais (INPE), Geophysics Division (DGE), Av. dos Astronautas, 1758, Jardim da Granja, 12227-010 S˜ao Jos´e dos Campos, SP, Brazil. E-mails: antonio.padilha@inpe.br; livia.alves@inpe.br
6Instituto Nacional de Pesquisas Espaciais (INPE), Computer Laboratory Division (LAC), Av. dos Astronautas, 1758, Jardim da Granja, 12227-010 S˜ao Jos´e dos Campos, SP, Brazil. E-mail: nilson@lac.inpe.br
INTRODUCTION
Several studies based on magnetic data have been carried on since the early researches in the aeronomy field with the postulation of global ionospheric current sheets, nowadays known as the Solar Quiet (Sq) System, to explain the global variation in ground mea-surements of the Earth’s magnetic field that is superimposed to the main field (Chapman & Bartels, 1940; Vestine, 1960; Maeda & Kato, 1966; Lindzen & Chapman, 1969; Matsushita, 1969). Specifically with respect to low latitude aeronomy, Sugiura & Cain (1966) presented a model for the Equatorial Electrojet (EEJ) based on the horizontal magnetic component of the Earth’s magnetic field (H), measured with magnetometers. Most of their work was based in the previous works made by Maynard & Cahill Jr. (1965a,b). Also, comprehensive study on the geomagnetic aspects of the Counter-Electrojet (CEJ) was published by Mayaud (1977). Most of the data used was collected in several sectors, but in the East-ern South American sector. None of these kinds of studies men-tioned above (or similar) was carried out in the Brazilian sec-tor, which has a completely different magnetic configuration at low latitudes, reaching−20 degrees of magnetic declination in some points. Therefore, the National Institute for Space Research (INPE, Portuguese acronym for Instituto Nacional de Pesquisas Espaciais) set up the Embrace Space Weather Program (Embrace, Portuguese acronym for Estudo e Monitoramento Brasileiro do Clima Espacial), which has among its goals stand the goal of sta-blish the Embrace Magnetometer Network, to provide a database to cover most of the South America.
Another scientific goal intended to be covered by the mea-surements made with the Embrace Magnetometer Network is to investigate the long term variation of the South American Mag-netic Anomaly (SAMA) and the implication of its presence in the deviation of the magnetic indices used to monitor the Solar-Earth relationship associated with space weather, in a similar frame-work similar to the paper by Moro et al. (2012). With respect to magnetic data being used for deriving magnetic indices, sev-eral publications have been made (see, for instance, Bartels et al., 1939; Mayaud, 1968; Rostoker, 1972; Seixas et al., 1994; Fontes et al., 1995; Takahashi et al., 2001; Papa et al., 2006; and ref-erences therein). Due to the continental extension of the South American territory, we focus our attention on the Kp index, which indicates geomagnetic disturbances in a simple manner and can be helpful for studying the dynamic relationship between the so-lar wind and the magnetosphere. It is given at 3-hour intervals, is derived from magnetic field data acquired at 11 ground stations distributed worldwide at sub-auroral latitudes (49◦-62◦) and has values ranging from 0◦ to 9◦ in 28 steps. Although the sub-script ‘p’ intended to mean planetary (from the German word
planetarische), the South American sector is poorly represented in Kp deviation. Also, from previous works using magnetic data obtained in South America (Trivedi et al., 2005; Denardini et al., 2009, 2011; Moro et al., 2012), we have verified some peculiari-ties with respect to the magnetic variations due to the electric fields associated with the Sq current system (during quit and disturbed periods) and magnetospheric current system (the ring current during disturbed periods) that we were not able to explain us-ing the classical magnetic indices like AE, Dst and Kp (Rostoker, 1972). Therefore, we decided to create the Embrace Magnetome-ter Network to provide reliable magnetic data from several part of the South American territory and to start developing the South American K index (Ksa), which can be confronted with the tradi-tional Kp to check its validity.
Brief description of the magnetometer and the network
The magnetometer chosen to operate in this network is a the three-axis fluxgate magnetometer built for compact and high per-formance precision measurements of the Earth’s magnetic field vector with measuring total range of±70000 nT and dynamic ranges of±250 nT, ±1000 nT and ±2500 nT covering the di-urnal variations amplitude of the magnetic components from low to high latitude. It can be powered from either any 220/110 VACor
±12 VDCpower supply, and the outputs are in the form of three
analogue voltages from 0 to±2.5 VDC, proportional to the three magnetic vector components it is able to measure: the horizon-tal (H), the declination (D), and the vertical (Z). Compact fluxgate sensors commercially available are assembled in PVC double wall cylindrical enclosures for high mechanical and thermal stability so that the magnetometer sensor is sealed in a 104-cm long weath-erproof cylinder having a diameter of 18 cm. The data acquisition module rate is 20 bits and it is set together with the electronic control unit and the USB or serial data output, depending on the model. Data acquisition and monitoring software includes both local data storage and simultaneous upload to two different data archives servers.
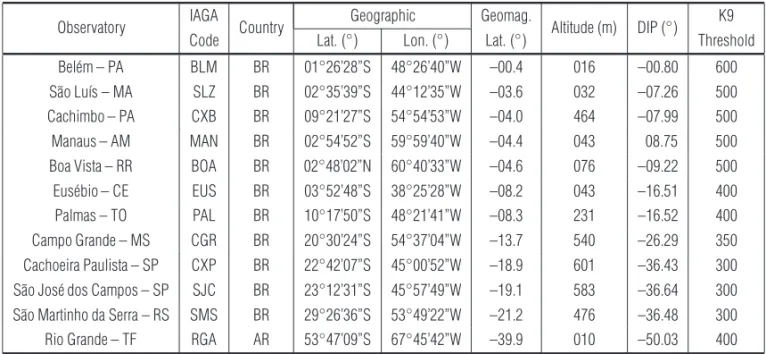
The EMBRACE Magnetometer Network is planned to cover most of the Easter Southern American longitudinal sector in order to fulfill a gap for magnetic measurement available on-line. The availability of fast internet, reliable energy supply and easy access were the key point for deciding the location of the first magne-tometer stations of our network. In Table 1 we present the location of the Embrace magnetometer stations, which started to be set in May 2011 and is originally planned to be concluded in December 2014. There is also additional information joined to this table that will be presented in this manuscript in due time.
Table 1 – Geographical location of the Embrace magnetometer stations with the corresponding magnetic latitude, dip angle, K9 threshold and station code.
Observatory IAGA Country Geographic Geomag. Altitude (m) DIP (◦) K9 Code Lat. (◦) Lon. (◦) Lat. (◦) Threshold Bel´em – PA BLM BR 01◦26’28”S 48◦26’40”W –00.4 016 –00.80 600 S˜ao Lu´ıs – MA SLZ BR 02◦35’39”S 44◦12’35”W –03.6 032 –07.26 500 Cachimbo – PA CXB BR 09◦21’27”S 54◦54’53”W –04.0 464 –07.99 500 Manaus – AM MAN BR 02◦54’52”S 59◦59’40”W –04.4 043 08.75 500 Boa Vista – RR BOA BR 02◦48’02”N 60◦40’33”W –04.6 076 –09.22 500 Eus´ebio – CE EUS BR 03◦52’48”S 38◦25’28”W –08.2 043 –16.51 400 Palmas – TO PAL BR 10◦17’50”S 48◦21’41”W –08.3 231 –16.52 400 Campo Grande – MS CGR BR 20◦30’24”S 54◦37’04”W –13.7 540 –26.29 350 Cachoeira Paulista – SP CXP BR 22◦42’07”S 45◦00’52”W –18.9 601 –36.43 300 S˜ao Jos´e dos Campos – SP SJC BR 23◦12’31”S 45◦57’49”W –19.1 583 –36.64 300 S˜ao Martinho da Serra – RS SMS BR 29◦26’36”S 53◦49’22”W –21.2 476 –36.48 300 Rio Grande – TF RGA AR 53◦47’09”S 67◦45’42”W –39.9 010 –50.03 400
Each magnetic station is composed by the three-axis fluxgate magnetometer just described, a controller system and a personal computer for local data storage and internet FTP server. The sen-sor is buried 1-m deep, under a cover made of metal-free material to provide protection against moderate rain, winds and solar ex-posure. It is installed in a location 50 m apart of the main shelf where the controller system and the personal computer are lo-cated. The cable connecting the magnetic sensor to the controller system is sealed and buried 20-cm deep to avoid solar exposure and to provide at least a minimum of temperature protection. It uses military certified connectors to assure long durability. The room temperature of the main shelf is maintained under control.
Procedure for calibrating the network equipments
In order to assure the precision of the magnetic measurements performed with any network it is usual to calibrate all the indi-vidual equipment to either a reference fluxgate magnetometer or a high performance proton magnetometer, which can provide the absolute magnetic field. Since the goals of the Embrace Magne-tometer Network are associated with measuring the variation of the magnetic field and its relative amplitude all over the South American instead of obtaining the absolute values of the magnetic field, we decided to adopt a reference fluxgate magnetometer for the network, which was set to be the one installed at CXP.
Thereafter, it is mandatory to submit all the magnetic equip-ments acquired to be part of the Embrace Magnetometer Network for a sensibility matching process with the reference magnetome-ter. This procedure consists of:
(1) burying the sensor of the new magnetometer close (2-3 meter apart) to the sensor of the reference magnetometer with no changes to the factory settings;
(2) letting it there to collect data for 3 months;
(3) selecting the data collected during the 5 quietest days of each month from both magnetometers the reference and the new one;
(4) averaging all the data to obtain the mean QDC for each magnetic component, which should be representative for the period of acquisition, avoids aliasing, outliers, and any other possible interference;
(5) performing a correlation analysis based on a least squares linear fit of the QDC of reference versus the QDC under evaluation, for each magnetic component individually; (6) correcting the gain of the measurements of each
individ-ual magnetic component, based on the angular parameter derived from the estimated regression equation;
(7) letting it there to collect data for another month; and (8) repeating steps 3 to 6 of this procedure to ensure an
angu-lar parameter derived from the estimated regression equa-tion between 0.98 and 1.02, i.e., a relative error lower than 2%.
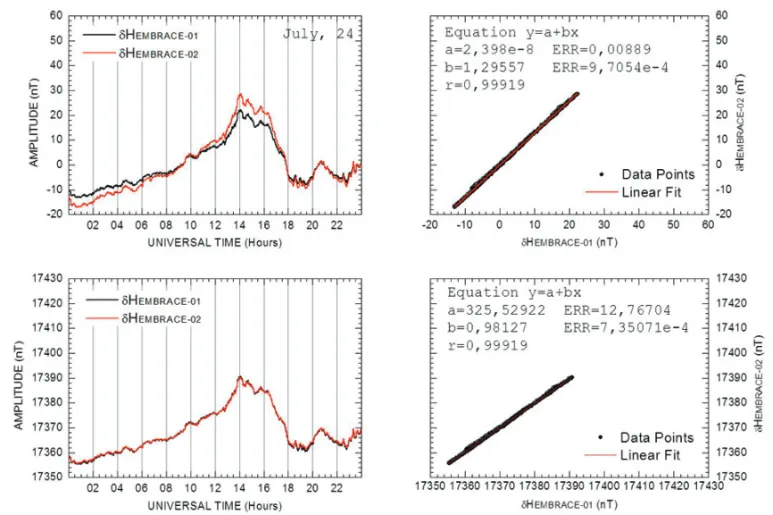
An example of the graphs obtained during the individual magne-tometers component calibration procedure is shown in Figure 1.
Figure 1 – Diurnal variation of the H component measured on July 24, 2011 at CXP (left graphs) by the reference equipment (black line) and by the
magnetometer under evaluation (red line), and scatter plots (black dots) of the reference QDC versus the QDC under evaluation for the same period of the first graph, with the estimated linear fit curve (red line), before (upper) and after (bottom left) the calibration procedures superimposed.
On the left graphs of Figure 1 we present the diurnal varia-tion of the H component of the Earth’s magnetic field measured on July 24, 2011 at CXP by the reference equipment (black line) and by the magnetometer under evaluation (red line), before (up-per) and after (bottom) the calibration procedures. Similarly, we present the scatter plots (black dots) of the reference QDC versus the QDC under evaluation for the same period of the first graph, with the estimated linear fit curve (red line) superimposed on the right graphs. On the upper left corner of these two graphs one can found the estimated regression equation and its parameters.
The curves shown the upper left hand side graph of Figure 1 are the delta H, i.e., the variation of the H component of the Earth’s magnetic field without the baseline (absolute field for the loca-tion). Therefore, the excursions are both negative and positive along the day. From that we would like the reader to notice that the absolute amplitude of the curve in red (magnetometer under eval-uation) is always higher than the absolute amplitude of the curve in red (reference magnetometer), meaning the gain of electronic circuits of the magnetometer under evaluation is always higher than the electronic circuits reference magnetometer. The higher gain in the magnetometer under evaluation circuits is confirmed
by the angular coefficient of the linear fit (the upper right graph of the Fig. 1) higher than the unit (b= 1.29557). The almost perfect alignment of the dots indicates that the response of both magne-tometers (shape of the curves in the left hand side) is very similar, despite the gain discrepancy.
After adjusted the gain of the electronic circuits as mentioned in the item 6 of the sensibility matching process, both curves from the magnetometer under evaluation (red curve of the bottom left hand side graph of Fig. 1) and from the reference magnetometer (black curve of the same graph) almost perfectly matched. This is confirmed with the reduction of the angular coefficient of the lin-ear fit shown in the bottom right graph of the Figure 1 to a value closer to the unit (b= 0.98127) with the response of both mag-netometers being kept very similar.
Procedure for obtaining the K scale and
the corresponding scale for each magnetic station
Currently, the Embrace Magnetometer Network is at its first stage of development. During this phase, we are not in condition to perform the complete magnetic analysis proposed by Bartels et
al. (1939) and Mayaud (1968) since we have no enough data col-lected. Therefore, in order to have a proxy of a K scale for each magnetic station in our network we decided to use a mathemati-cal approach. We looked at the available literature for the K smathemati-cale established by several authors (e.g., Bartels et al., 1939; Jursa, 1985; Takahashi et al., 2001) for different magnetic observato-ries. The compilation of upper limits for three-hour-range indices K for different magnetic observatories is shown in Table 2 together with the observatories geographical location, magnetic latitude, dip angle, and the corresponding IAGA code.
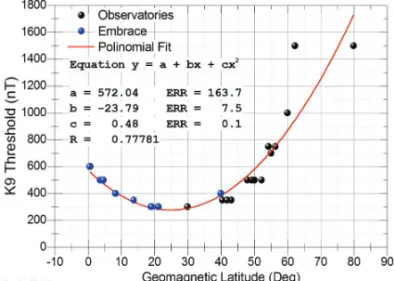
From this information, we built a plot of the module of geo-magnetic latitude of each observatory listed in the Table 2 versus the maximum value of range that classifies the disturbance regis-tered at the particular observatory as K9. Thereafter, we performed a least squares polynomial fit to get a mathematical relationship between these two variables. Figure 2 shows the plot of the maxi-mum range for achieving K9 value, per geomagnetic latitude of the observatories (black dots) from which we were able to find the K range scales. In addition, we plot the polynomial fit superimposed to it and plot the geomagnetic latitude of the magnetic stations of the Embrace Magnetometer Network (blue dots).
Figure 2 – Geomagnetic latitude of the observatories (black dots) and Embrace
stations (blue dots) versus its maximum range corresponding to a classification K9, and the polynomial fitting (red curve).
This simple method resulted in the expression in Eq. (1) and allowed us to obtain the K9 threshold for all the magnetic stations of the Embrace Magnetometer Network entering their geomagnetic latitude, which are shown in the last column of the Table 1.
K9 = 0.48(GeomLat)2
− 23.79(GeomLat) + 572.04 (1) Afterwards, we derive the complete scale of the K index for all the magnetic station by keeping the proportionality with the observa-tories scales. Thereafter, we have started obtaining the mean QDC
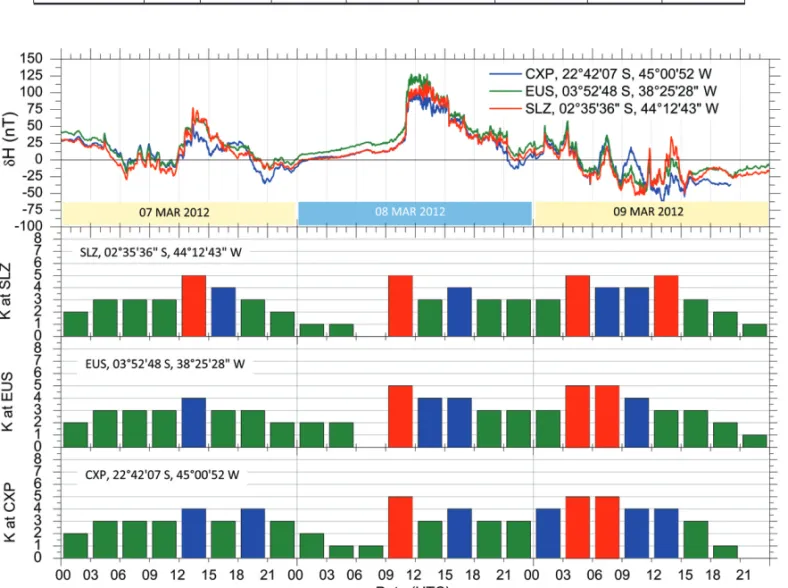
for each magnetic component measure at each Embrace station in order to get the component deviation relative to a quiet behavior. This task is not finished so far and some particularities regarding the QDC deviation are addressed ahead. However, ignoring the difference with respect to the QDC and considering the absolute variation only, we present Figure 3 some samples of the time evo-lution of what we convention to call the pseudo-K index registered at some stations. In Figure 3 we also present the time evolution of the H component of the Earth’s magnetic field in the top graph. Measurements registered at SLZ are presented with the red line, at EUS with the green line, and at CXP with the blue line. The colors of the bars in the graph represent the level of disturbances with respect to the K index at that particular station, being green to K lower than or equal 4, blue for K equal to 5, and red for K equal or higher than 6.
In Figure 3 we called the bars graphs as the pseudo-K in-dex because we only took into consideration the variation of the H component to derive it. As we said, we did not subtract the mean QDC from the diurnal variation of the magnetic components. Since these two steps are mandatory to have a real K index we pre-fer to call it pseudo-K index. Therefore, the purpose of this figure is to show the performance of the network stations that are al-ready operational (continuously sending data every 5 minutes to our data server) and to check the response of the network under magnetic disturbances like that registered in 2012.
From the simple test, we are able to see that the available sta-tions presented a coherent response to the presence of the mag-netic disturbance. All the stations recorded the H component vari-ation in the same way and at the same time. If we take a look at for example, the abrupt variation registered at 11 UT on March 08. The jump in the graph is simultaneously registered with very similar amplitudes at the three available stations. It is confirmed by the pseudo-K index in bars graphs below. Despite good cor-relation among all the H component excursions along the days, some differences in the pseudo-K index can be observed. This may be due to values of the range close to the transition between the indices steps, which reinforcing the need for referring the H variation to the QDC and for using the appropriated K9 values for each station.
Particularities regarding the QDC deviation
We are currently working on the determination of the QDC for all the magnetic stations of the Embrace Magnetometer Network. However, this task – usually thought to be simple – is quite com-plicated in the Brazilian sector. Due to large magnetic declination,
Table 2 – Geographical location of different magnetic observatories with the corresponding magnetic latitude, dip angle, K9 threshold and the IAGA code.
Observatory IAGA Country Geographic Geomag. Altitude (m) DIP (◦) K9 Code Lat. (◦) Lon. (◦) Lat. (◦) Threshold Huancayo HUA PE –12.05 284.66 –0.6 3313.0 –02.10 600 Honolulu HON US 21.32 201.94 21.1 4.0 39.14 300 San Juan SJG RQ 18.38 293.88 29.9 424.0 52.60 300 Tucson TUC US 32.25 249.17 40.4 946.0 59.84 350 Waterloo WAT AS –30.32 115.88 –41.8 200 –64.49 350 Fresno FRN US 37.09 240.28 43.1 331.0 61.73 350 Hartland HAD UK 51.00 355.52 47.9 95.0 66.32 500 Boulder BOU US 40.14 254.76 49.2 1682.0 67.45 500 Fredericksburg FRD US 38.21 282.63 49.6 69.0 68.28 500 Cheltenham CLH US 38.73 283.16 50.1 70.0 71.49 500 Niemegk NGK GE 52.07 12.68 52.2 78.0 67.25 500 Saint Johns STJ CA 47.59 307.32 54.2 100.0 68.60 750 Newport NEW US 48.26 242.88 55.1 770.0 71.49 700 Ottawa OTT CA 45.40 284.45 56.3 75.0 72.19 750 Sitka SIT US 57.05 224.67 60.0 24.0 74.57 1000 Meanook MEA CA 54.62 246.67 62.2 700.0 76.96 1500 Godhavn GDH GL 69.24 306.48 79.9 69.0 81.77 1500
Figure 3 – Time evolution of the H component (top graph) of the Earth’s magnetic field and the pseudo-K index (bars graphs) registered at SLZ (top bars, red line),
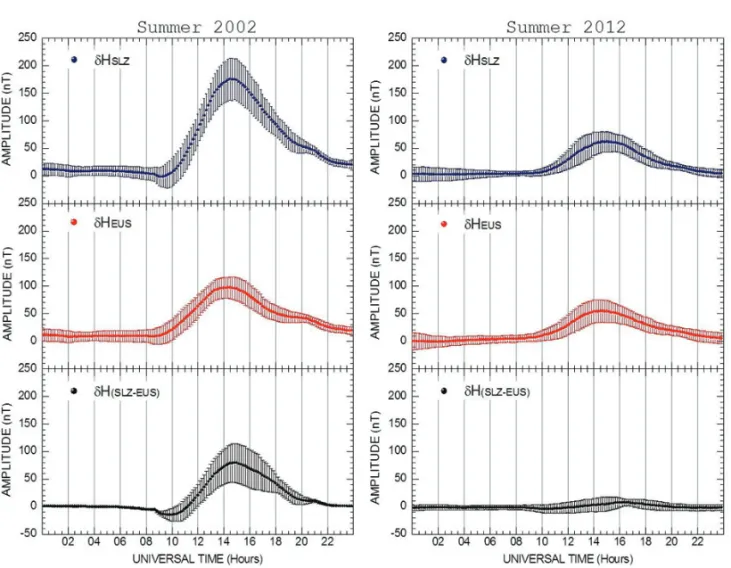
Figure 4 – Time evolution of theδH component of the Earth’s magnetic field registered at the SLZ station (blue line), the EUS station (red line), and
the difference between them from the summer of 2002 (left graphs) and summer of 2012 (right graphs).
reaching−20 degrees at low latitudes, the QDC can drastically change with the year once the main magnetic field, subject to the secular variation, is drifting westward. See, for instance, the ex-ample difference between the QDC obtained at the SLZ in 2002 and 2012 in the Figure 4.
Observing this figure we clearly see that the measurement made at the SLZ station registered the strong influence of the EEJ in 2002, evidenced by the strong variations seen in the lower graph. We also see that such clear influence is shot down in 2012. There is also the problem of the seasonal variation of the Solar Quiet (Sq) current system that certainly influences the magnetic records at the ground level. But this subject is not addressed in the present work.
FINAL REMARKS
We have presented some results obtained from the first steps re-garding the development of the South American K index based on the magnetic measurement made by the Embrace Magnetome-ter Network. AfMagnetome-ter briefly describing the magnetomeMagnetome-ter used to monitor the magnetic field, we described the network and the
pro-cedure used to calibrate all the network equipments, including an example of errors from non calibrated equipments. We also intro-duced the step-by-step of the procedure to obtain the K scale and the corresponding scale for each magnetic station and provided the equation to perform that. Finally, we provided examples of the pseudo-K index variation registered at the SLZ, EUS and CXP stations, and discussed about some particularities regarding the quiet day curve deviation, especially with respect to the long term variation.
ACKNOWLEDGEMENTS
C.M. Denardini thanks to CNPq/MCTI (Grant 305242/2011-3), to FAPESP (Grant 2012/08445-9), and to the Brazilian Govern-ment (Program 2056, Budget Action N387, Budget Plan 08/2013-2017), which supported both the scientific and infra-structure projects that gave birth to the Embrace Magnetometer Network. M. Rockenbach thanks to CNPq/MCTI (Grant 300300/2012-3) and to FAPESP (Grant 2011/11581-9). All the authors thank the Em-brace/INPE for the providing the data.
REFERENCES
BARTELS J, HECK NH & JOHNSTON HF. 1939. The three-hour-range index measuring geomagnetic activity. Terrestrial Magnetism and Atmo-spheric Electricity, 44(4): 411–454.
CHAPMAN S & BARTELS J. 1940. Geomagnetism. London: Oxford University Press. v. 2, 543 pp.
DENARDINI CM, ABDU MA, AVEIRO HC, RESENDE LCA, ALMEIDA PDSC, OLIVIO EPA & WRASSE CM. 2009. Counter electrojet features in the Brazilian sector: simultaneous observation by radar, digital sounder and magnetometers. Annales Geophysicae, 27(4): 1593–1603. DENARDINI CM, AVEIRO HC, ALMEIDA PDSC, RESENDE LCA, GUI-ZELLI LM, MORO J & ABDU MA. 2011. Daytime efficiency and char-acteristic time scale of interplanetary electric fields penetration to equa-torial latitude ionosphere. Journal of Atmospheric and Solar-Terrestrial Physics, 73(11-12): 1555–1559.
FONTES SL, SEIXAS NAB, FIGUEIREDO I & MOTTA CM. 1995. Auto-maticK-Index Determination using a Variable Cut-Off Frequency Filter-ing Procedure. Journal of Geomagnetism and Geoelectricity, 47: 607– 619.
JURSA AS. 1985. Handbook of Geophysics and the Space Environment. US Air Force Geophysics Laboratory, USA, Chapter 4, The Geomagnetic Field, 37 pp.
LINDZEN RS & CHAPMAN S. 1969. Atmospheric tides. Space Science Review, 10: 3–188.
MAEDA K & KATO S. 1966. Electrodynamics of the ionosphere. Space Science Review, 5(57): 57–79.
MATSUSHITA S. 1969. Dynamo currents, winds and electric fields. Ra-dio Science, 4(9): 771–780.
MAYAUD PN. 1968. Indices Kn, Ks, et Km. ´Editions du Centre National de la Recherche Scientifique, Paris, France. 155 pp.
MAYAUD PN. 1977. Equatorial counter-electrojet – a review of its geo-magnetic aspects. Journal of Atmospheric and Terrestrial Physics, 39(9-10): 1055–1070.
MAYNARD NC & CAHILL Jr LJ. 1965a. Measurements of the equatorial electrojet over India. Journal of Geophysical Research, 70(A23): 5923– 5936.
MAYNARD NC & CAHILL Jr LJ. 1965b. Preliminary results of measure-ments of Sqcurrents and the equatorial electrojet near Peru. Journal of Geophysical Research, 70(A23): 5975–5977.
MORO J, DENARDINI CM, CORREIA E, ABDU MA, SCHUCH NJ & MAKITA K. 2012. Correlation between the cosmic noise absorption cal-culated from the SARINET data and the energetic particles measured by MEPED: Simultaneous observations over SAMA region. Advances in Space Research, 51: 1692–1700.
PAPA ARR, BARRETO LM & SEIXAS NAB. 2006. Statistical study of magnetic disturbances at the Earth’s surface. Journal of Atmospheric and Solar-Terrestrial Physics, 68: 930–936.
ROSTOKER G. 1972. Geomagnetic Indices. Reviews of Geophysics and Space Physics, 10(4): 935–950.
SEIXAS NAB, FIGUEIREDO I & FONTES SL. 1994. Determinac¸˜ao do ´ındice K na atividade geomagn´etica atrav´es da aplicac¸˜ao de um filtro de frequˆencia. (in Portuguese). Brazilian Journal of Geophysics, 12(1): 71–88.
SUGIURA M & CAIN JC. 1966. A model equatorial electrojet. Journal of Geophysical Research, 71(A7): 1869–1877.
TAKAHASHI K, TOTH BA & OLSON JV. 2001. An automated procedure for near-real-time Kp estimates. Journal of Geophysical Research, 106(A10): 21017–2032.
TRIVEDI NB, ABDU MA, PATHAN BM, DUTRA SLG, SCHUCH NJ, SANTOS JC & BARRETO LM. 2005. Amplitude enhancement of SC(H) events in the South Atlantic anomaly region. Journal of Atmospheric and Solar-Terrestrial Physics, 67(17-18): 1751–1760.
VESTINE EH. 1960. The upper atmosphere and geomagnetism. In: RAT-CLIFFE JA (Ed.). Physics of the Upper Atmosphere. New York, Chap-ter 10, pp. 471–511.
Recebido em 13 novembro, 2013 / Aceito em 7 janeiro, 2015 Received on November 13, 2013 / Accepted on January 7, 2015
NOTES ABOUT THE AUTHORS
Clezio Marcos De Nardin earned Electrical Engineering degree in 1996 at the UFSM and Space Science Ph.D. in 2003 at the INPE, where works as a researcher.
Major field is Space Geophysics with focus in the Equatorial Aeronomy in which had advised Master and Undergraduate scientific projects. Had published 37 inter-national articles in indexed journals, published 35 articles in proceeding of scientific congresses, presented 175 reports in scientific events and published 1 didactic article and 13 speeches for public outreach. Had earned 7 scientific awards and is referee and editor of international journals. Currently, is the President of SBGEA (Brazilian Society for Space Geophysics and Aeronomy) and is member of the INPE’s Technical-Scientific Council.
Marlos Rockenbach da Silva graduated in Physics at UFSM (2003), master’s (2005) and Ph.D. (2009) in Space Geophysics at INPE. From May to October
2007 worked as a Visiting Researcher at Shinshu University in Matsumoto, Japan. Was Post-Doc at Space Geophysics in INPE in 2010. Between August 2010 and January 2014 was Researcher at the Research and Development Institute – IP&D and professor in the Faculty of Engineering, Architecture and Urbanism – FEAU in UNIVAP. Currently, is a researcher at INPE, working at CRS/INPE – MCTI. Has experience in Geosciences with an emphasis on space weather, working mainly in Sun – Interplanetary Space – Earth Relationship, Solar Structures, Cosmic Rays and Geomagnetic Storms.
Mauricio Alfredo Gende earned degree in Geophysics in 1996 at the Universidad Nacional de La Plata and Ph.D. in Geophysics in 2002 at the same university.
Since 2005 is a researcher at CONICET. Major fields are Aeronomy and Space Geodesy. Has advice Ph.D., master and degree students. Had published 23 international articles in indexed journals, presented 44 talks in scientific congresses. Also published 1 didactic article and gave 9 speeches for public outreach. Since 2005 is a full time professor at the School of Astronomy and Geophysics at the Universidad Nacional de La Plata.
Sony Su Chen is currently attending the fourth year of Electrical Engineering at the Universidade de Taubat´e (UNITAU). Undergraduate research at the Instituto
Nacional de Pesquisas Espaciais (National Institute for Space Research – INPE), the Aeronomy Division (DAE), from September 2011 to July 2013.
Paulo Roberto Fagundes earned Bachelor in Physics degree 1984 at Universidade Federal de S˜ao Carlos, master’s (1988) and Ph.D. (1993) in INPE. From
March, 1991 to February, 1993 carried out research as part of doctorate at UCL/London. Currently, is Professor associate at UNIVAP, founded the research group in Physics and Astronomy and coordinates the UNIVAP network of ionospheric observatories. Has experience in the areas of Space Physics. Head of the FAPESP thematic project (No 2012/08445-9) “Study of the variability day-to-day mesosphere, thermosphere and ionosphere at low latitudes and the equatorial region during solar cycle 24”. One of the organizers of the session C1.1 do COSPAR, was a member of the editorial board of special issue of Advances in Space Research, 2006, 2008 and 2014. Voted as co-chair in Division II-Aeronomic Phenomena and chair of Working group II-E Ionospheric Irregularities, fields, and waves of IAGA, for the 2011-2015 quadrennial. Selected as one of the “Top 10” reviewers of the Journal Advances in Space Research 2012 and received Certificate of Excellence in reviewing in 2013 the Journal of Atmospheric and Solar-Terrestrial Physics. According to Web of Science, has published 86 articles in international journals with 960 citations (H = 18). It is scholarship of CNPq productivity (level 1C).
Nelson Jorge Schuch graduated in Physics, Full Degree – 1st Graduated of the 1st Class from the Physics Course from the Universidade Federal de Santa Maria –
UFSM (1969-1972). First Master of Science in the field of Astrophysics at the Universidade Mackenzie (1973-1975), S˜ao Paulo, SP. Ph.D. (1975-1979) and Post Doctor (1979-1980) in Physics – Astrophysics at the Department of Physics – Cavendish Laboratory in the Prof. Sir. Martin Ryle’s and Prof. Antony Hewish’s (Nobel Prizes in Physics 1974) Radio Group – University of Cambridge, England. Deputy Director of the National Observatory – ON/MCTI (1990-1994), Rio de Janeiro, RJ. Mentor of the actions for the development of technical and scientific activities and for the construction of the Southern Regional Space Research Center – CRS/INPE MCTI, in Santa Maria and S˜ao Martinho da Serra, in Rio Grande do Sul, Brazil. Currently, is a Senior Researcher level III of the National Institute for Space Research, stationed at CRS/INPE-MCTI, Santa Maria. Responsible for the construction of the headquarters building of CRS/INPE-MCTI, in Santa Maria, and the Space Complex of the Southern Space Observatory SSO/CRS/INPE – MCTI, in S˜ao Martinho da Serra, RS, performing managements in Municipal and State governments level, and for Parlia-mentary Amendments to the Brazilian Ministry of Science, Technology and Inovation budget law at the Federal National Congress within the Permanent Committees of the House of Representatives (Federal Deputies) and of the Brazilian Senate (1996-2006). Has experience in Extragalactic Astrophysics, with emphasis on Observational Cosmology. Currently is conducting activities related to the following research themes: the High Energy Astrophysics, Sun – Earth Interactions, Space Weather, Geo-magnetic storms, Geomagnetism, Aeronomy, Space Geophysics – Ionosphere and Exobiology. Biosphere and Atmospheric Sciences with concentration in Ultraviolet Radiation, Atmospheric Ozone and Renewable Energy. Leads development project in Cube Sats at the CRS/INPE – MCTI in a partnership with Santa Maria Space Science Laboratory – LACESM/CT - UFSM. Collaborates in the form of occasional activities as consultant “Ad Hoc” in the National Council for Scientific and Technological Development (CNPq), for the Foundation for Research Support of S˜ao Paulo (FAPESP), the Financier of Studies and Projects (FINEP), the Foundation for Research Support of Rio Grande do Sul (FAPERGS) and to the Editorial Board of the Journal of Geophysical Research – Space Physics.
Adriano Petry holds a B.Sc. in Electrical Engineering (1996) and Ph.D. in Computer Science (2002), both from Universidade Federal do Rio Grande do Sul (UFRGS).
Head of Southern Regional Space Research Center, National Institute for Space Research (CRS/INPE-MCTI). Experienced with High Performance Computing, mathemat-ical modeling and Aeronomy. Main research interests include Space Weather, ionosphere analysis and computational simulation.
Laysa Cristina Ara ´ujo Resende earned Physics degree by ETEP Faculdades, and Ph.D. in Space Geophysics by INPE in 2014, with focus in Aeronomy, emphasizing
the Sporadic E-layersat lowlatitudes and equatorial regions. Had published 5 international articles in indexed journals, and 2 of theseas the first author. In addition, has published abstracts and article in National and International events. Earned 2 scientific awards.
Juliano Moro earned Ph.D. degree in Space Geophysics at the Instituto Nacional de Pesquisas Espaciais (National Institute for Space Research – INPE) in 2015.
M.Sc. at INPE in 2011 and graduated in Physics at UFSM in 2009. Major field is Space Geophysics with focus in the Equatorial Aeronomy, working in the following fields: equatorial electrojet, plasma irregularities, electric fields, conductivity model, South America Magnetic Anomaly (SAMA), energetic particles precipitation at SAMA region, RESCO and Jicamarca radars, SARINET network.
Antonio Lopes Padilha graduated in Physics (1978), MSc (1982) and PhD (1989) in Geophysics from the Universidade de S˜ao Paulo. Currently, is a senior
researcher at the Instituto Nacional de Pesquisas Espaciais. Conducts research in the fields of Geosciences, with emphasis on terrestrial electromagnetic induction, working with GDS and magnetotelluric methods, and geomagnetism, studying geomagnetic variations and their effects at the Brazilian low latitudes.
Nilson Sant’Anna earned a post Doctorate at the Department of Electronics and Information at Politecnico of Milan – Italy (2010), Visiting Researcher (2007) in
CALTECH – California Institute of Technology. PhD in Applied Computing at the Instituto Nacional de Pesquisas Espaciais (2000) and a degree in Electrical Engineering from the Federal University Emphasis Electronics Itajub´a (1987). Senior Researcher working at LAC (Laboratory for Applied Computing at INPE) and Professor in the Graduate Course ETE – Space Systems Engineering and Management. Has experience in Systems Engineering, and Applied Computing, acting on the following topics: software engineering, databases, system architectures, quality, and maturity models (CMMI) and project management.
Livia Ribeiro Alves earned Ph.D. by the Instituto Nacional de Pesquisas Espaciais (National Institute for Space Research – INPE) in 2011, MS in physics from
the Universidade de S˜ao Paulo (2006) and a BA in Physics from the Universidade de S˜ao Paulo (2003). During doctoral scholarship period was FINEP, a student in various disciplines taught by the ITA Physics graduate in and performed part of experimental work in CPqD laboratories. Currently, is a researcher at INPE Space Geophysics Division acting by the Geomagnetism group. It has experience in physics applied to optical and photonics, the study of linear and nonlinear effects in conventional optical fibers for development of sensors to fiber optics, with applications in the energy supply sector. Main areas of interest are: study and monitoring of geomagnetic induced currents (GIC), space weather in middle and low latitudes; development of instrumentation to measure quantities of interest to geophysical space, based on optical techniques.