http://www.uem.br/acta ISSN printed: 1679-9275 ISSN on-line: 1807-8621
Doi: 10.4025/actasciagron.v39i1.30561
Variability in soil physical properties in landslide-prone areas
Letícia d’Agosto Miguel Fonseca1*, João Luiz Lani2, Elpídio Inácio Fernandes Filho2, Gerson
Rodrigues dos Santos3, Williams Pinto Marques Ferreira4 and Adriana Maria Rocha Trancoso
Santos3
1
Instituto Nacional de Pesquisas Espaciais, Av. dos Astronautas, 12227-010, São José dos Campos, São Paulo, Brazil. 2Departamento de Solos, Centro de Ciências Agrárias, Universidade Federal de Viçosa, Viçosa, Minas Gerais, Brazil. 3
Departamento de Estatística, Universidade Federal de Viçosa, Viçosa, Minas Gerais, Brazil. 4
Empresa Brasileira de Pesquisa Agropecuária, Embrapa Café, Viçosa, Minas Gerais, Brazil. *Author for correspondence. E-mail: [email protected]
ABSTRACT. The present study aimed to evaluate the relationship between the physical properties of the soil and relief in areas that are susceptible to landslides in the sub-basin of the Córrego do Yung, a creek in the urban district Três Moinhos of Juiz de Fora, Minas Gerais. Depth measurements of the solum were made at the soil sampling points, and the subsurface material was collected and analyzed for the two factors of particle size and type of horizon. In the laboratory, we determined the hydraulic conductivity, bulk and particle density, and total porosity, macroporosity and microporosity. The values of the physical properties throughout the sub-basin were predicted and mapped. Thematic maps were generated and showed a relation to each other: the clay was related to a higher hydraulic conductivity, higher porosity and lower soil density. In the steeper areas, the greater silt contents were mapped in the deeper layers and indicated the thin thickness of horizon B in these areas. A close relation of the curvature with the soil thickness was detected and was greater in the flat areas with less slope. The geostatistical analysis showed that the range of values for the properties of macroporosity, microporosity and silt was the lowest in the deeper layers, indicating low structural continuity in potentially erodible areas.
Keywords: physical soil, geostatistics, landslide.
Variabilidade dos atributos físicos do solo em áreas suscetíveis ao deslizamento de terra
RESUMO. Objetivou-se avaliar a relação entre os atributos físicos do solo e do relevo com as áreas suscetíveis ao deslizamento de terra na sub-bacia do Córrego do Yung, localizada no bairro Três Moinhos em Juiz de Fora, Minas Gerais. Foram locados os pontos de amostragem e procedeu-se às medições da profundidade do solum e coleta de material subsuperficial, observando-se dois fatores: granulometria e tipo de horizonte. Foram determinadas, em laboratório, a condutividade hidráulica, densidade do solo e de partículas, porosidade total, macroporosidade e microporosidade. Realizaram-se as interpolações para predizer e mapear os valores dos atributos físicos em toda a sub-bacia hidrográfica. De acordo com os mapas temáticos, a textura argilosa relacionou-se à maior condutividade hidráulica, maior porosidade total e menor densidade do solo. Nas áreas mais íngremes, foram mapeados maiores teores de silte em profundidade, representando a pequena espessura do horizonte B. Verificou-se estreita relação da curvatura com a espessura do solo, sendo os mais profundos localizados em áreas planas e de menor declividade. Quanto às análises geoestatísticas, os valores de alcance para os atributos macroporosidade, microporosidade e silte em profundidade revelaram os menores valores encontrados, o que evidencia o conhecimento da baixa continuidade estrutural do solo em áreas potencialmente erodíveis.
Palavras-chave: física do solo, geoestatística, deslizamento de terra.
Introduction
Landslides have always been a cause of great concern, particularly during the rainy season in urban areas. Several landslides occurred in recent years in different regions of Brazil, such as in the great disasters of the landslides in Santa Catarina in 2008 and in the highland region of Rio de Janeiro in 2011.
To define the conditions of susceptibility to landslides, the hydrological processes associated with soil
and relief, which are fundamental in environmental studies and risk management areas, must be understood.
Studies on the issue of landslides classify soil depth and hydraulic conductivity as key information in slope stability analyses, though these factors are the most difficult to measure. However, other essential data can also be obtained through remote sensing, e.g., elevation model, landslide inventory and land use maps (Western, Castellanos, & Kuriakose, 2008).
Experiments relating erosion and soil texture showed that soils with high silt amounts are more susceptible to erosion than are clayey and sandy soils under the same conditions due to greater runoff. Additionally, the slope and the presence of vegetation influence erosion intensity (Sadeghi, Moosavi, Karami, & Behnia, 2012).
In soils classified as Cambisols, the degree of erodibility is higher due to the steepness of the terrain, the silt content and the thickness of the B horizon (Vestena, & Kobiyama, 2014). In the area of "Mares de Morros," the C horizon tends to be very deep, and the sizes of the solum and the soil are disproportionate, indicating rejuvenation of the geomorphic process in this domain (Rezende, & Resende, 1996). According to these authors, in the steeper portions, which usually have an exposed C horizon, the recovery of the vegetation cover on the soils is more difficult due to the lack of nutrients and seasonal drought, thus intensifying the erosive processes.
The relationships between soil properties, such as soil texture, porosity and bulk density with hydraulic conductivity (K0), and soil water retention
curve (SWRC) in areas that are affected by landslide processes indicate that these properties are satisfactory for understanding the interaction between the soil structure and the hydraulic behavior (Bogner et al., 2014). One example is saturated hydraulic conductivity, which depends on water leaching due to the macroporosity, which, in turn, is related to soil texture, particle arrangement (structure) and bulk density. The free passage of water is crucial to reduce runoff (Gomes et al., 2011).
The spatial continuity of the soil physical properties was confirmed (Kamimura, Santos, Oliveira, Dias, & Guimarães, 2013); i.e., spatial models represent ideal tools for data analysis by geostatistical spatial modeling (Silva, Mello, Curi, & Oliveira, 2008). These authors further emphasize rainfall erosion, which is characterized and modeled by properties with continuous spatial behavior, including soil-related data, vegetation cover, rainfall erosivity, and topography. Soil erosion can be mapped by spatial models, provided that the studies on the spatial dependence of data and the modeling of the experimental semivariogram are consistent.
The soil slope, relief, geology, depth and resistance, land use and vegetation cover, rainfall, and mapped points of occurrence of landslides are the main GIS factors used in these studies (Klimes & Escobar, 2010; Costanzo, Rotigliano, Irigaray, Jiménez-Perávlvarez, & Chaón, 2012; Di Martire, Rosa, Pesca, Santangelo, & Calcaterra, 2012; Zizioli, Meisina, Valentino, & Montrasio, 2013).
Thus, soil research focused on these landslide and erosion processes is of fundamental interest to professionals from various fields of knowledge related to this particular field of study. In the city of Juiz de Fora, urban sprawl has increased significantly in recent years. Every year, landslides in various parts of the city are recorded by the civil defense, especially in the rainy season. One of the regions with the highest number of occurrences is the urban district Três Moinhos.
Thus, this study defined indicators in a landslide-prone area in the metropolitan area of Juiz de Fora (district Três Moinhos) to support the authorities in charge of managing this risk area.
Material and methods
Study area
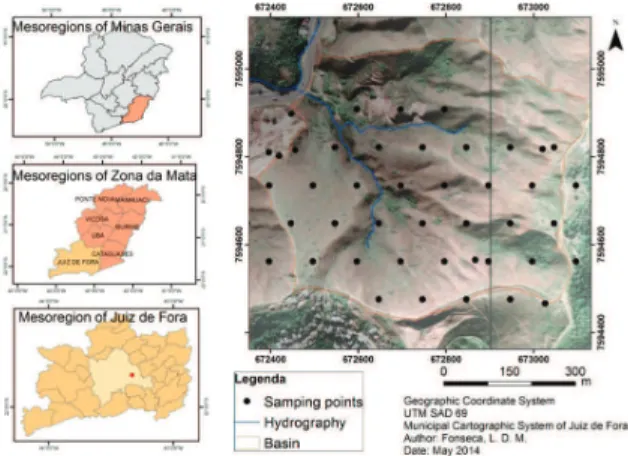
The study was conducted in the sub-basin of the Yung creek, in the urban district Três Moinhos, Juiz de Fora, in the mesoregion of Zona da Mata, Minas Gerais. The total area of the sub-basin is 35 ha, and it is in mountainous terrain with ravine slips and gullies. The altimetry variation of the area is between 0 and 900 m. According to Fonseca, Lani, Fernandes, Marques, and Ferreira (2016), the soil of the sub-basin was classified as dystrophic Tb Haplic Inceptisol.
The district Três Moinhos is located in a development region of Linhares, in the Yung basin, in the eastern region of the city. It is characterized by residences that have no basic infrastructure and are irregularly distributed. The terrain is hilly, and many points are vulnerable to landslides. (Prefeitura de Juiz de Fora [PJF], 2004). This is the planning region with the largest number of points of risk areas mapped by the civil defense and occurrences of landslides, which comprised 256 events that occurred at 27 locations over the past eight years; the landslides were concentrated in the Western neighborhoods of Três Moinhos and Bom Jardim, which are inserted in the Yung basin (PJF, 2004).
intense surface dynamic of the region, with soil erosion and sedimentation, flooding and landslide areas (PJF, 2004).
Through geotechnical characterization tests and erodibility resistance, it can be concluded that in the sub-basin of the Yung creek, the areas with the greatest erosion potential are those that expose the C horizon. However, because of the rugged relief, constant erosion processes on horizon B occur by washouts, though this horizon presents greater resistance (Fonseca et al., 2016).
Sample collection and preparation
The sampling points were first localized in the digital environment in ArcGIS 10.1, hexagonal mesh, split into distant points of 100 m in a horizontal line, resulting in 43 points across the study area (Figure 1). The hexagonal mesh was used as the most representative, according to the study of Yfantis, Flatman, and Behar (1987). The authors proved that by analyzing the same variable, this sampling grid performed better in terms of the maximum mean square error than did the triangular and square mesh.
Figure 1. Distribution map of sampling points in the Yung sub-basin in the urban district Três Moinhos, Juiz de Fora, Minas Gerais State
The points were inserted with their respective coordinates in the GPS navigation model "Garmin map 62 Trilha," using the TrackMaker software. The search function of GPS points (function go to) was essential for the localization of the sampling points in the field. Once a point was found, disturbed samples were collected from the surface (0 - 0.10 m layer) and soil samples with an undisturbed structure using a volumetric ring (height 0.045 m, diameter 0.0405 m).
For measurements of the soil thickness and sampling the subsurface material, an auger with a
length of 3 m was used. In the deeper layers, two factors were investigated: the particle size and type of horizon.
The collected soil material was packed in plastic bags, crumbled, air-dried and sieved (< 2 mm) (ADFS). The soils collected in rings (auger) were wrapped in plastic film to preserve the structure during transport and physical analysis in the laboratory. The hydraulic conductivity, bulk and particle density, total porosity, macroporosity and microporosity were determined in these samples.
Laboratory analyses
The pipette method was used for particle size analysis. A 0.1 mol L-1 NaOH solution was used as
the chemical dispersant under mechanical stirring (Empresa Brasileira de Pesquisa Agropecuária [EMBRAPA], 1997; Ruiz, 2006).
The bulk density (BD) was determined by the relationship between the dry soil mass and the internal ring volume. The particle density (PD) was determined by the volumetric flask method. Total porosity (TP) was defined as the ratio between the bulk density and particle density using the expression TP= [1-(Ds / PD)] (EMBRAPA, 1997). The hydraulic conductivity was performed using the "Mariotte bottle" method. The soil macroporosity (Macro) was computed as the difference between TP and microporosity (Micro), which is the water content retained at a matric potential of 6 kPa (EMBRAPA, 1997).
Terrain analysis
The terrain variables of the digital elevation model (DEM) were used, which is based on a plan-altimetric topographic survey, with contour lines with 1-m intervals, provided by the urban administration of Juiz de Fora and developed from an aero-photogrammetric survey of 2007.
Geostatistical analysis
The adjustment of the semivariogram was the main stage modeled by geostatistics (Yamamoto & Landim, 2013). The distances with better visual setting were tested to further quantify the fitting of the theoretical model. The exponential, Gaussian and spherical models were adjusted using the least squares method for almost all of the physical properties, except the data obtained for coarse sand at the surface, which was fitted by the maximum likelihood method.
of the physical properties across the watershed. Santos, Oliveira, Louzada, and Santos (2011) found that Ks is more accurate than the universal and ordinary kriging when comparing the mean kriging variance between the observations and the predicted values obtained by self-validation.
Kriging was adopted for tending to annihilate the mean residual error and reduce the variance of errors. For this purpose, a self-validation procedure called jack-knifing is used. According to Vieira (2000), this procedure involves the measurement of the points observed in the field, "hiding the variable," so that it is estimated by kriging as if it were a lost point, and assessing the performance to estimate the known values. The observed residual errors are generally marginal, ensuring the reliability of the values estimated by this interpolator.
Pedotransfer function
Because the data of hydraulic conductivity (K0)
were not spatially adjusted, the relationship between the soil physical characteristics and K0 was tested by
multiple linear regressions with program R. When the variables are soil properties, these regressions are called pedotransfer functions.
Pedotransfer functions can be defined as regressions used to obtain estimates of soil properties from other more easily measurable characteristics (Medeiros, Cooper, Rosa, Grimaldi, & Coquet, 2014). The data for the clay, bulk density (BD) and macroporosity (Macro) were significant in the regression results in equation (1):
= −6.74 ∗ + 51.74 ∗ + 0.01 ∗ (1)
The equation showed the best values of the multiple linear regression fitting, with r² = 0.6 and p-value = 2.9 10-8. Therefore, K
0 was mapped in the
area of the sub-basin using the equation established, performing operations between images consisting of a cell matrix (rasters).
Results
Properties of the Yung subwatershed
Where the flat curvature (perpendicular to the slope) directly influences the flow velocity and, consequently, soil erosion and sediment transport, the classes were divided into concave, flat and convex, as defined by an analysis of the relief.
The plan curvature showed that of the 35ha area of the basin, 40% is concave, 22% is flat and 34% is convex slopes. The curvature was also closely related to soil thickness. In the flat areas, the mean soil depth was higher than in the other relief forms.
The data of the solum measured in situ at the sampled points were interpolated to create the thematic map. The legend of the depth map (Figure 2) indicates that in the mapped areas, there was no change of horizon below 3 m; thus, the surface of the C horizon is below a depth of 3 m.
Figure 2. Terrain properties and profile graph of the Yung subwatershed, Juiz de Fora, Minas Gerais State.
Elevation Profile
Distance of the transect (m)
700 600 500 400 300 200 100 0 900
850
800
It was found that soil depth was directly related to slope; the lowest mean slopes were observed in areas with deeper soils (> 2 m), and this class occupies the only 4h of the 35h basin. The majority of the areas (70% of the basin) have a soil thickness of 1.5 m, and these are the areas with the highest mean slope.
Spatial distribution of soil physical properties
According to Vieira (2000), statistics and geostatistics are complementary, and Table 1 shows the results of the studied data.
The data of the soil thickness and hydraulic conductivity were not spatially dependent with a pure nugget effect. According to Yamamoto and Landim (2013), the nugget effect can be a result of the spatial phenomenon variability under study, such as the sampling scale, so the data of spatial distribution and independence have random characteristics. For the other analyzed properties, the models were fitted to the data, thus meeting the assumptions of geostatistical modeling, such as intrinsic stationarity, and second-order stationarity.
The results of the semivariogram parameters (Table 2) show high variance values for some properties, namely, clay, silt and coarse sand. The high values are associated with the sensitivity of the variable to the collected distances, indicating that these properties must require denser sampling for optimal fitting. However, all properties were
adjusted in a variogram with a sill, indicating a correlation between the values.
The ranges of values (i.e., the extent of spatial dependence) for the properties of macroporosity, microporosity and silt in the deeper layers were the lowest, suggesting that these variables are spatially correlated at short distances. This provides evidence of the low structural continuity of the surface and thickness of the C horizon in the potentially erodible areas.
The highest range values were observed for the surface clay and soil thickness. Therefore, a point at the surface influences the clay content to a radius of up to 540 m in the surrounding and soil thickness to a depth of 289 m.
Estimates of the mean and variance of the residues of the self-validation should be close to 0 and 1, respectively (Table 3), because according to Vieira (2000), the mean of the residues is the sum of the residues between of the kriging values and the observed points; i.e., theoretically, these measures would be 0 and 1. The results of the self-validation were satisfactory for all interpolated properties.
The semivariogram shows a model of the spatial correlation structure until the range, from which the semivariance becomes constant, restricts the area of spatial influence. The spherical model was adjusted for soil density, coarse sand at the surface, clay, fine sand and coarse sand in the deeper layers.
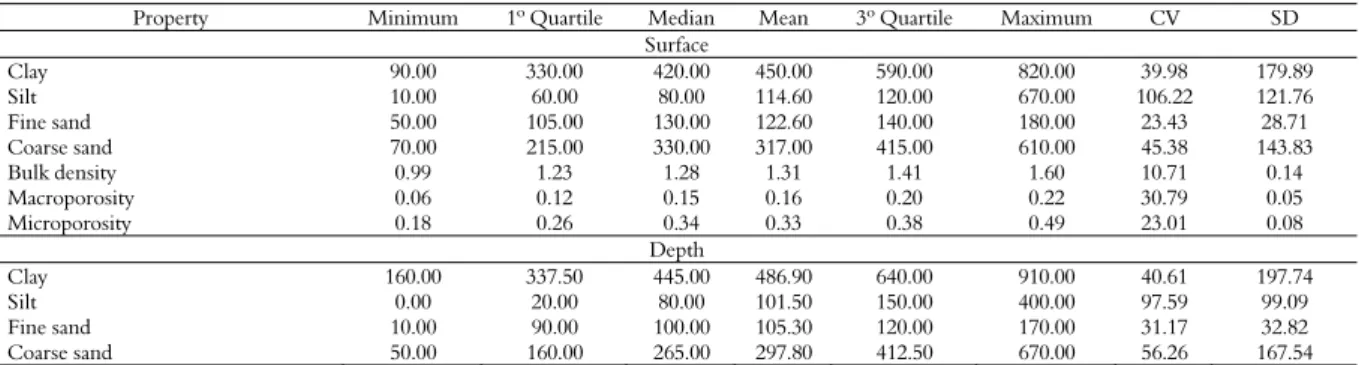
Table 1. Statistical data of the soil properties.
Property Minimum 1º Quartile Median Mean 3º Quartile Maximum CV SD Surface
Clay 90.00 330.00 420.00 450.00 590.00 820.00 39.98 179.89 Silt 10.00 60.00 80.00 114.60 120.00 670.00 106.22 121.76 Fine sand 50.00 105.00 130.00 122.60 140.00 180.00 23.43 28.71
Coarse sand 70.00 215.00 330.00 317.00 415.00 610.00 45.38 143.83 Bulk density 0.99 1.23 1.28 1.31 1.41 1.60 10.71 0.14
Macroporosity 0.06 0.12 0.15 0.16 0.20 0.22 30.79 0.05 Microporosity 0.18 0.26 0.34 0.33 0.38 0.49 23.01 0.08
Depth
Clay 160.00 337.50 445.00 486.90 640.00 910.00 40.61 197.74 Silt 0.00 20.00 80.00 101.50 150.00 400.00 97.59 99.09 Fine sand 10.00 90.00 100.00 105.30 120.00 170.00 31.17 32.82
Coarse sand 50.00 160.00 265.00 297.80 412.50 670.00 56.26 167.54
CV = variance coefficient; SD = standard deviation.
Table 2. Main data from the fitted semivariograms.
Descriptive data Fitted semivariogram
Properties N Mean Var Max. distance Model Contrib. Range Pepita Methods Surface
Clay 43 377.00 32,360.00 487 Exponential 27,540.50 541.70 6,281.00 WLS Fine sand 43 122.60 824.30 367 Exponential 746.20 254.80 90.00 OLS Silt 43 114.60 14,825.50 650 Gaussian 13,218.70 237.60 1,000.00 WLS Coarse sand 43 317.00 20,688.30 612 Spherical 14,129.00 212.40 6,099.00 ML Macroporosity 41 0.20 0.00 755 Exponential 0.00 117.60 0.00 WLS Microporosity 41 0.30 0.00 570 Gaussian 0.00 140.40 0.00 WLS Bulk density 41 1.30 0.00 562 Spherical 0.00 558.20 0.00 OLS
Depth
Clay 36 486.90 39,101.80 632 Spherical 35,211.40 289.60 4,882.00 OLS
Silt 39 101.50 9,818.60 595 Gaussian 8,776.60 155.40 1,373.00 OLS Fine sand 36 105.30 1,077.10 617 Spherical 990.60 247.60 119.00 OLS
Coarse sand 36 297.80 28,069.20 642 Spherical 25,412.40 242.70 3,250.00 OLS
The fittings of the Gaussian and exponential models for the other properties were tested. The surface silt, thickness and microporosity were better fitted to the Gaussian model, and the other properties were better fitted to the exponential model (Figure 3), as shown by Kamimura et al. (2013).
After choosing the semivariograms, the data were interpolated by universal kriging, and the resulting grids divided into 1,000 horizontal and 1,000 vertical lines, corresponding to a pixel of 0.90 m; this operation was carried out for all properties. The images in ASC format were included in ArcGIS for conversion into GRID and layout preparation.
Table 3. Main fitting quality indicators obtained in the validation of the adjustments for each property.
Property Regression data Self-validation
Intercept Predicted Mean error Error standard deviation Surface
Clay 1.oo -0.48 -0.01 1.08
Fine sand 11.18 0.91 0.06 1.06
Silt 70.81 0.40 0.04 2.21
Coarse sand -24.90 1.08 0.00 0.99
Macroporosity 0.25 -0.60 0.00 1.01
Microporosity 0.08 0.77 -0.01 1.07
Bulk density 0.42 0.68 0.01 1.39
Depth
Clay 42.43 0.91 0.00 1.11
Silt 142.43 -0.40 -0.27 1.35
Fine sand 39.00 0.63 0.01 1.20
Coarse sand 94.00 0.67 -0.01 1.20
Variograms of interpolated data
Clay Silt Fine sand
Distancias, m Distancias, m Distancias, m Coarse sand
Distancias, m
Macroporosity
Distancias, m
Microporosity
Distancias, m Bulk density
Distancias, m
Clay depth
Distancias, m
Silt depth
Fine sand depth
Distancias, m
Coarse sand depth
Distancias, m
Figure 3. Semivariogram for the studied physical properties.
Discussion
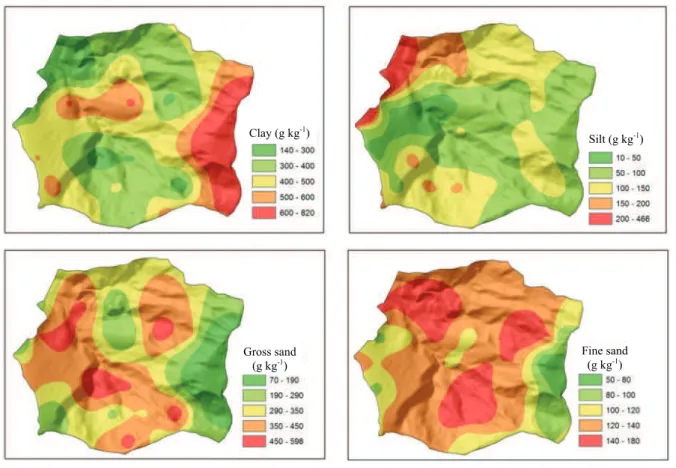
The widest ranges of clay content (500 - 820 g kg-1) were observed in the areas with flatter tops in
the Eastern part of the basin, as highlighted on the map in red and orange, where the silt and sand contents were lowest (Figure 4). The vegetation was less degraded, and the soil structure of horizon A was granular, with a moderate degree of development, which is a structure favored by the presence of organic matter.
The highest silt values were found in the northwest of the basin, corresponding to the areas that were identified in the field as degraded and eroded, exposing C horizon. Fine sand, although the numerical contents
were not high, was the property whose pronounced spatial distribution had the widest range (120 - 180 g kg-1) in most parts of the basin.
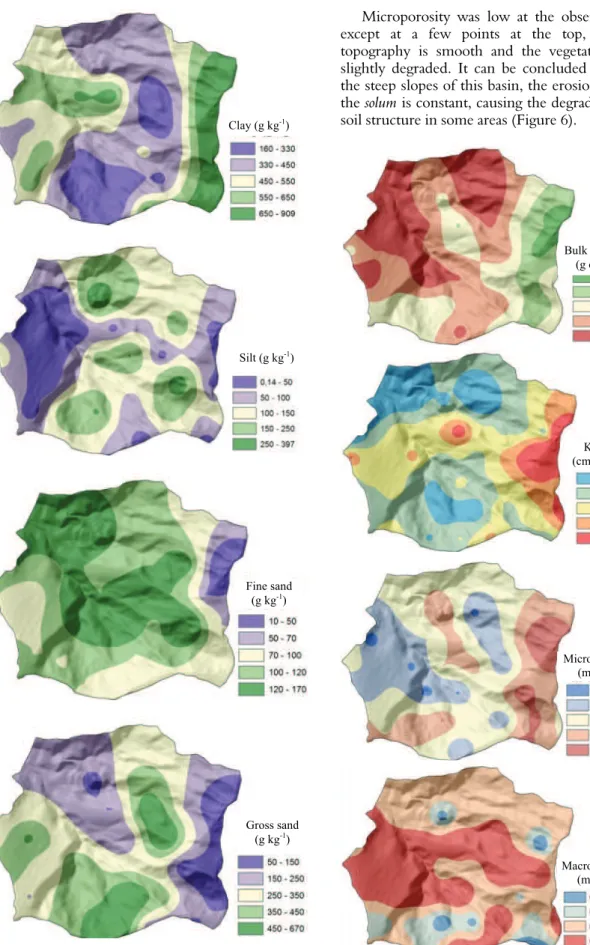
The areas with the highest silt contents in the deeper layers, considering the ranges 100 - 397 g kg-1
with beige, green and dark green soil material (Figure 5), were mapped in the areas with steeper terrain and shallower solum. In the same areas, high values of fine sand (100 - 170 g kg-1) and coarse sand (250 - 670 g
kg-1) were detected.
High clay contents (550 - 900 g kg-1) were observed
in the deepest soil layers, where no C horizon was found by drilling to a depth of 3 m (Figure 6)
Figure 4. Spatialization of soil surface texture in the Yung sub-basin, Juiz de Fora, Minas Gerais State.
Clay (g kg-1)
Gross sand
(g kg-1)
Silt (g kg-1)
Fine sand
Figure 5. Spatialization of the soil texture in deeper layers in the Yung sub-basin, Juiz de Fora, Minas Gerais State.
Microporosity was low at the observed points, except at a few points at the top, where the topography is smooth and the vegetation is only slightly degraded. It can be concluded that due to the steep slopes of this basin, the erosion process of the solum is constant, causing the degradation of the soil structure in some areas (Figure 6).
Figure 6. Spatial-physical properties in the sub-basin of the Yung creek, Juiz de Fora, Minas Gerais State.
Clay (g kg-1)
Silt (g kg-1)
Fine sand
(g kg-1)
Gross sand
(g kg-1)
Ko
(cm h-1)
Microporosity (m3 m-3)
Macroporosity (m3 m-3)
Bulk density
The map that indicated higher hydraulic conductivity represented the less-degraded vegetation-covered areas in the basin. These areas are characterized by higher infiltration and lower runoff rates.
The correlations between the hydraulic conductivity and the soil properties were also investigated. Despite the low values of the correlations in Table 4, the best-fitted physical properties were the bulk density and fine sand, which had negative correlations, and clay, total porosity and macroporosity, which had positive correlations, as reported by Sampaio, Menezes, Furtini, and Ribeiro (2006).
Table 4. Analysis of the correlation between hydraulic conductivity and soil properties in the solum.
Properties K0 x K0 x Sand K0 x
Silt Clay Coarse Fine BD Pt Micro Macro PD Correlation -0.28 0.40 -0.18 -0.37 -0.41 0.50 0.12 0.37 0.24
BD = soil density; Pt = total porosity; Micro = microporosity; Macro = macroporosity; PD = particle density.
The correlation analysis between the soil depth and texture (Table 5) showed that the best-correlated textures were clay, silt and coarse sand. The shallower the depth of the soil is, the higher the silt is and the smaller the clay proportion is because C horizon will be closer to the surface. This finding reinforces the character of spatial dependency between these properties.
Table 5. Analysis of correlation between soil thickness and texture of soil from the surface of C horizon.
Property
Depth x Sand Sand
Silt Clay Coarse Fine
Correlation 0.45 0.29 0.44 -0.64
Conclusion
Thematic maps were related to each other: clay texture was related to higher hydraulic conductivity, higher porosity and lower soil density. The areas mapped with higher silt content were located in degraded areas of the sub-basin.
In the steepest areas, higher silt contents were mapped, corresponding to the surface of C horizon and indicating the thin thickness of B horizon.
The range of the values of macroporosity, microporosity and silt in the deeper layers were the lowest, thus confirming previous information about the low structural continuity of the soil surface and the depth of horizon B in potentially erodible areas.
Acknowledgements
The authors acknowledge FAPEMIG (Research Support Foundation of Minas Gerais) and CAPES (the Foundation for the Coordination and Improvement of Higher Level or Education Personnel) for providing financial support for this study and the Federal University of Viçosa (UFV).
References
Ab’saber, A. (1986). Domínios morfoclimáticos e solos do Brasil. In V. V. H. Alvarez, L. E. F. Fontes, & M. P. F. Fontes (Eds.), Os solos nos grandes domínios morfoclimáticos do Brasil e o desenvolvimento sustentável (p. 1-18). Viçosa, MG: Sociedade Brasileira de Ciência do Solo.
Aquino, R. F., Silva, L. M. N., Freitas, D. A. F., Curi, N., & Avanzi, J. C. (2012). Soil losses from typic Cambisols and Red Latosol as related to three erosive rainfall patterns. Revista Brasileira de Ciência do Solo,
37(1), 213-220.
Bogner, C., Bauer, F., Trancon Y Widemann, B., Viñan, P., Balcazar, L., & Huwe, B. (2014) Quantifying the morphology of flow patterns in landslide-affected and unaffected soils. Journal of Hydrology, 511(1), 460-473.
Costanzo, D., Rotigliano, E., Irigaray, C., Jiménez-Perávlvarez, J. D., & Chaón, J. (2012). Factors selection in landslide susceptibility modelling on large scale following the GIS matrix method: application to the river Beiro basin (Spain). Natural Hazards Earth System Science, 12(1), 327-340.
Di Martire, D., Rosa, M., Pesca, V., Santangelo, M. A., & Calcaterra, D. (2012). Landslide hazard and land management in high-density urban areas of Campania region, Italy. Natural Hazards Earth System Science, 12(1), 905-926.
Empresa Brasileira de Pesquisa Agropecuária [EMBRAPA]. (1997). Centro Nacional de Pesquisa de Solos (Manual de métodos de análise de solo, 212). Rio de Janeiro, RJ: Embrapa.
Fonseca, L. D. M., Lani, J. J., Fernandes Filho, E. I., Marques, E. A. G. M., & Ferreira, W. P. F. (2016). Avaliação da erodibilidade de um Cambissolo em Juiz de Fora, Minas Gerais. Geotecnia, 136(1), 143-156. Gomes, M. A., Lani, J. J., Costa, L. M., Pontes, L. M.,
Figueiredo, N. A., & Bardales, N. G. (2012). Solos, manejo e aspectos hidrológicos na bacia hidrográfica do Araújos, Viçosa – MG. Revista Árvore, 36(1), 93-102. Kamimura, K. M., Santos, G. R., Oliveira, M. S., Dias, M.
Klimes, J., & Escobar, V. R. (2010). A landslide susceptibility assessment in urban areas based on existing data: an example from the Iguaná Valley, Medellín City, Colombia. Natural Hazards Earth System Science, 10(1), 2067-2079.
Medeiros, J. C., Cooper, M., Rosa, J. D., Grimaldi, M., & Coquet, Y. (2014). Assessment of pedotransfer functions for estimating soil water retention curves for the Amazon region. Revista Brasileira de Ciência do Solo,
38(3), 730-743.
Petschko, H., Brening, A., Bell, R., Goetz, J., & Glade, T. (2014). Assessing the quality of landslide susceptibility maps – case study Lower Austria. Natural Hazards Earth System Science, 14(1), 95-118.
Prefeitura de Juiz de Fora [PJF]. (2004). Plano Diretor de Desenvolvimento Urbano de Juiz de Fora (394p). Juiz de Fora, MG: FUNALFA Edições.
Rezende, S. B., & Resende, M. Solos dos Mares de Morros: Ocupação e uso. (1986). In V. V. H. Alvarez, L. E. F. Fontes, & M. P. F. Fontes (Eds.), Os solos nos grandes domínios morfoclimáticos do Brasil e o desenvolvimento sustentável (261-289). Viçosa, MG: Sociedade Brasileira de Ciência do Solo.
Ruiz, H. A. (2006). Métodos de análises físicas do solo. Viçosa, MG: Universidade Federal de Viçosa. Dep artamento de Solos.
Sadeghi, S. H., Moosavi, V., Karami, A., & Behnia, N. (2012). Soil erosion assessment and prioritization of affecting factors at plot scale using the Taguchi method. Journal of Hydrology, 448(1), 174-180.
Sampaio, F. M. T., Menezes, S. M., Furtini, M. B., & Ribeiro, K. D. (2006). Correlação entre a permeabilidade e os atributos físicos do solo na sub-bacia do córrego Centenário da cidade de Lavras – MG. Ciência e Agrotecnologia, 30(4), 798-803.
Santos, G. R., Oliveira, M. S., Louzada, J. M., & Santos, A. M. R. T. (2011). Krigagem Simples versus Krigagem
Universal: qual o preditor maisxzsssssa preciso?.
Revista Energia na Agricultura,26(2), 49-55.
Silva, A. M. D., Mello, C. R., Curi, N., & Oliveira, P. M. (2008). Simulação da variabilidade espacial da erosão hídrica em uma sub-bacia hidrográfica de Latossolos no sul de Minas Gerais. Revista Brasileira de Ciência do Solo, 32(5), 2125-2132.
Vestena, L. R., & Kobiyama, M. (2014). Identificação e mapeamento dos processos erosivos na bacia hidrográfica do rio Caeté, no município de Alfredo Wagner/SC.
Revista Brasileira de Geomorfologia, 15(1), 23-33.
Vieira, S. R. (2000). Geoestatística em estudo de variabilidade espacial do solo. In R. F. Novais, V. V. H. Alvarez, & C. E. G. R. Schaefer (Eds.), Tópicos em ciência do solo (1, 1-55). Viçosa, MG: Sociedade Brasileira de Ciência do Solo.
Western, C. J. V., Castellanos, E., & Kuriakose, S. L. (2008). Spatial data for landslide susceptibility, hazard, and vulnerability assessment: An overview. Engineering Geology, 102(4), 112-131.
Yfantis, E. A., Flatman, G. T., & Behar, J. V. (1987). Efficiency of Kriging estimation for Square, Triangular and Hexagonal Grids. Matematical Geology, 19(3), 183-205. Yamamoto, J. K. & Landim, P. M. B. (2013). Geoestatística:
conceitos e aplicações. São Paulo, SP: Oficina de Textos. Zizioli, D., Meisina, C., Valentino, R., & Montrasio, L.
(2013). Comparison between different approaches to modeling shallow landslide susceptibility: a case
history in Oltrepo Pavese, Northern Italy. Natural Hazards Earth System Science, 13(1), 559-573.
Received on January 13, 2016. Accepted on June 17, 2016