SPATIAL VARIABILITY OF THE CHEMICAL, PHYSICAL AND
BIOLOGICAL PROPERTIES IN LOWLAND CULTIVATED
WITH IRRIGATED RICE
(1)José Maria Barbat Parfitt(2), Luís Carlos Timm(3)(7), Eloy Antonio Pauletto(4)(7), Rogério Oliveira de Sousa(4), Danilo Dufech Castilhos(4),
Conceição Lagos de Ávila(5) & Nestor Luis Reckziegel(6)
SUMMARY
In the areas where irrigated rice is grown in the south of Brazil, few studies have been carried out to investigate the spatial variability structure of soil properties and to establish new forms of soil management as well as determine soil corrective and fertilizer applications. In this sense, this study had the objective of evaluating the spatial variability of chemical, physical and biological soil properties in a lowland area under irrigated rice cultivation in the conventional till system. For this purpose, a 10 x 10 m grid of 100 points was established, in an experimental field of the Embrapa Clima Temperado, in the County of Capão do Leão, State of Rio Grande do Sul. The spatial variability structure was evaluated by geostatistical tools and the number of subsamples required to represent each soil property in future studies was calculated using classical statistics. Results showed that the spatial variability structure of sand, silt, SMP index, cation exchange capacity (pH 7.0), Al3+ and total N properties could be detected by geostatistical analysis. A
pure nugget effect was observed for the nutrients K, S and B, as well as macroporosity, mean weighted diameter of aggregates, and soil water storage. The cross validation procedure, based on linear regression and the determination
(1) Recebido para publicação em agosto de 2008 e aprovado em abril de 2009.
(2) Pesquisador da Embrapa - Clima Temperado. BR 392, km 78. Caixa Postal 403. CEP 96001-970 Pelotas (RS). E-mail [email protected]. Doutorando do PPGA-Solos, Faculdade de Agronomia Eliseu Maciel, Universidade Federal de Pelotas – UFPel. Caixa Postal 354, CEP 96010-900 Capão do Leão (RS). E-mail: [email protected]
(3) Professor Adjunto do Departamento de Engenharia Rural, Faculdade de Agronomia Eliseu Maciel. E-mail: [email protected] (4) Professor Associado do Departamento de Solos, Faculdade de Agronomia Eliseu Maciel, UFPel. E-mails:
[email protected]; [email protected]; [email protected]
(5) Graduanda do Curso de Saneamento Ambiental do Centro Federal de Educação Tecnológica de Pelotas – CEFET. Bolsista de IC/CNPq. E-mail: [email protected]
(6) Graduando da Faculdade de Agronomia Eliseu Maciel, Universidade Federal de Pelotas – UFPel e Graduando do Curso de Gestão Ambiental do Centro Federal de Educação Tecnológica de Pelotas – CEFET. Bolsista PIBIC/CNPq. E-mail: [email protected]
coefficient, was more efficient to evaluate the quality of the adjusted mathematical model than the degree of spatial dependence. It was also concluded that the combination of classical with geostatistics can in many cases simplify the soil sampling process without losing information quality.
Index terms: geostatistics, soil sampling, spatial dependence.
RESUMO: VARIABILIDADE ESPACIAL DOS ATRIBUTOS QUÍMICOS, FÍSICOS E BIOLÓGICOS DE UM SOLO DE VÁRZEA CULTIVADO COM ARROZ IRRIGADO
Nas áreas cultivadas com arroz irrigado no sul do País, poucos estudos têm sido realizados no intuito de estudar a estrutura de variabilidade espacial dos atributos do solo e, assim, estabelecer novas formas de manejo do solo e uso de corretivos e fertilizantes. Nesse sentido, este trabalho teve como objetivo estudar a variabilidade espacial de atributos químicos, físicos e biológicos num solo de várzea com histórico de arroz irrigado no sistema convencional de cultivo. Para isso, foi estabelecida uma malha de 100 pontos, em arranjo equidistante de 10 x 10 m, em área pertencente à Embrapa Clima Temperado, situada no município do Capão do Leão, RS. A estrutura de variabilidade espacial de cada atributo foi estudada por meio da geoestatística, e a determinação do número de subamostras necessárias para representar cada atributo em estudos futuros foi calculada utilizando-se a estatística clássica. Os resultados mostraram que a geoestatística permitiu detectar a estrutura de variabilidade espacial dos atributos silte, areia, índice SMP, CTC (pH 7,0), Al3+ e N total. Os nutrientes K, S e B e os
atributos físicos macroporosidade, diâmetro médio ponderado dos agregados e armazenamento de água disponível apresentaram efeito pepita puro. A validação cruzada, por meio dos coeficientes de determinação e de regressão, foi uma ferramenta mais eficiente na avaliação da qualidade do modelo matemático ajustado do que o grau de dependência espacial. Concluiu-se também que a combinação da estatística clássica com a geoestatística pode, em muitos casos, simplificar o processo de amostragem do solo, mantendo-se a qualidade da informação.
Termos de indexação: geoestatística, várzea, amostragem do solo, dependência espacial.
INTRODUCTION
Most of the rice consumed by the Brazilian population is grown on lowland soils in the South of Brazil, mainly on Planosols (Albaqualfs) and Gleysol (Epiaqualfs) (IRGA, 2008). Modern techniques are used in the cultivation of irrigated rice resulting in high productivity levels, which are comparable to those of the major rice-producing countries. However, much has yet to be done. The soil management is mostly homogeneous, because corrections and fertilizations are based on the mean contents of soil properties, which leads to the occurrence of over and under-corrected and/or fertilized zones, according to the criterion of maximum benefit. The first step towards a change in this scenario is to know the degree of spatial variability of soil properties. This is an important step in the decision making process for a more rational management of corrective and fertilizer applications. According to McGraw (1994), soil spatial variability occurs at different degrees and is related
to variations in the parent material, climate, relief, organisms and time, i.e., the processes of soil formation and/or the effects of management practices in the area.
In the cultivated areas with irrigated rice in the south of Brazil, few studies have been carried out with the aim of studying the spatial variability structure of soil properties in the different soil managements. In this sense, this study had the following objectives: (a) to identify the spatial variability structure of chemical, physical and biological soil properties, (b) to map the spatial distribution based on the determination of the spatial structure of soil properties, (c) to determine the number of subsamples required to understand the mean pattern of a soil property and (d) determine strategies for new samples in lowland areas with a history of irrigated rice cultivation.
MATERIAL AND METHODS
A 10 x 10 m grid of 100 points was established, in a 0.81 ha area of the lowland experimental station of Embrapa Clima Temperado, in the county of Capão do Leão, state of Rio Grande do Sul (31 ° 49 ’ 12,75 ’’ S; 52 ° 27 ’ 59 ’’ W). The regional climate is Cfa, according to Köppen’s classification, characterized as a typical subtropical climate, maritime, with a subhumid summer and humid or superhumid during the rest of the year.
The soil in the area was classified, according to Embrapa (2006), in two taxonomic classes: the relatively high areas as Planossolo Háplico eutrófico gleissólico - Typic Albaqualf (NRCS, 2003) and the relatively low areas as Gleissolo Háplico Ta eutrófoco solódico - Umbric Epiaqualf (NRCS, 2003). Both soils, although of different classes, have no field discontinuities, which are very common in rice-growing areas in Rio Grande do Sul. In the three last growing seasons the experimental area had been growing irrigated rice (for two years) and grain sorghum (for one year). Both crops were cultivated in conventional tillage, and soil sampling was performed after sorghum harvest.
Disturbed soil samples from every point were collected with a cutting spade from the 0–0.20 m soil layer to determine the soil physical properties: particle density (Pd) according to a methodology described by Embrapa (1997), particle-size distribution (soil texture) and water dispersed clay (Dc), according to methods described by Gee & Bauder (1986) and soil electrical conductivity (EC) in 5:1 extract (Tedesco et al., 1995). The soil chemical properties pH (H2O),
SMP index, H + Al, organic matter (OM), total N (TN), available P, K and exchangeable Na, Ca, Mg and Al, CEC (pH 7.0), total S and B and available Fe, Mn, Cu and Zn were also determined in the same soil samples. The soil organic matter content was determined according to a method proposed by Embrapa (1997) and the other soil chemical properties according to Tedesco et al. (1995).
For the determination of the soil microbial biomass carbon (MBC), samples were collected with a screw
auger in the 0–0.20 m layer; the soil extract was stored in a freezer until required for analysis. The MBC was determined according to the methodology described by Vance et al. (1987), in which chloroform is replaced by a microwave oven (for 4 min) to eliminate microorganisms and release cell components, as suggested by Ferreira et al. (1999). For the determination of size distribution of water aggregate stability (mean weighted diameter MWD) a 5 x 5 x 20 cm soil cube was collected (care should be taken to avoid segmentation of the sample in the field) and the sample was identified in the laboratory according to a methodology described by Kemper & Rosenau (1986), calculated as described by Palmeira et al. (1999). Undisturbed soil samples were collected for the determination of soil bulk density (Bd), soil total porosity (Tp), soil macro (Macro) and microporosity (Micro) and soil water retention curve (tensions at 0; 1; 6; 10; 33; 100 and 1,500 kPa) using a steel ring (diameter 5 cm, height 3 cm), for a total of 100 observations of each soil property. The soil available water storage (Aws) was also calculated for each point according to Reichardt & Timm (2008).
All soil chemical and physical analyses were performed at the Laboratories of the Soil Department/ FAEM/UFPel, except for soil aggregate stability analyses, which were carried out at the Laboratory of Soil Physics/Embrapa Clima Temperado.
The data sets were initially analyzed by descriptive statistics, where the mean, standard deviation, coefficient of variation, skewness and kurtosis coefficients were calculated. Based on the values of these coefficients, the data sets that tended to normal distribution were identified and, then, the necessary number of subsamples (N) to represent each soil property in future studies was calculated. For this, Warrick & Nielsen (1980) equation was used, which presupposes that the number of subsamples N is sufficiently large for the application of the central limit theorem, assuming that the distribution of the soil property has normal distribution:
N = (tα
2
S2
) d –2
(1)
where t is the t-Student distribution value considering the level of significance (α) and the number of freedom
degrees of the estimate of the sampling variance S2
and d the acceptable variance from the mean (corresponds to the product between the arithmetic mean and the variation percent around it). Two levels of significance (α = 0.05 and 0.01) and two levels of variation around the mean (10 and 20 %) were evaluated.
semivariograms (mathematical model) and their respective adjustment parameters (nugget effect, C0;
sill, C0+C; range, A), r² coefficient of determination
and the sum of squares of residuals (SSR). In the present study, the cross validation (Vieira, 2000) technique was used to analyze the quality of the adjusted mathematical model of spatial variability (theoretical semivariogram) for each one of the studied soil properties. Thematic maps were constructed based on the kriging technique (Webster & Oliver, 2001), to highlight the soil properties with the following characteristics in the semivariograms: result of cross validation technique r² > 0.5; coefficient of regression (CR) between 0.85 and 1.15; and the proper definition of the adjusted mathematical model of semivariogram in the zone of spatial dependence.
The ratio C0/(C0+C) and the range are the
parameters that characterize the spatial structure of a property. The C0/(C0+C) relation is the proportion,
in the dependence zone, that cannot be properly
described by geostatistics in the domain, and the range defines the distance over which the soil property values are correlated with each other. A low value for the C0/(C0+C) ratio and a high range generally indicate
that high precision of the property can be obtained by kriging (Isaaks & Srivastava, 1989). The classification proposed by Cambardella et al. (1994), which considers the degree of spatial dependence (DSD = C0/(C0+C) x 100) as strong when DSD ≤ 25 %;
moderate when 25 < DSD ≤75 %; and weak when
DSD > 75 % was used to classify the degree of spatial dependence of each one of the soil properties.
RESULTS AND DISCUSSION
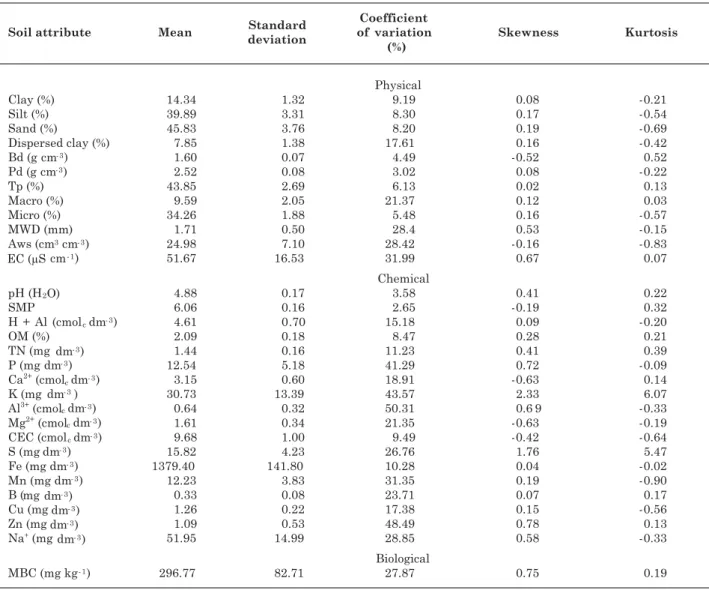
The descriptive statistics (mean, standard deviation, coefficient of variation, skewness and kurtosis) of all 31 studied soil properties are shown in table 1.
The data of table 1 show that the mean values of soil physical properties in the experimental field are consistent with the values determined by Palmeira et al. (1999) in this environment when cultivated with irrigated rice in conventional tillage. The soil texture can be classified as loamy, in the 0–0.20 m layer (Embrapa, 2006) according to the particle size distribution. The mean value of the soil total porosity of 43.85 % is within the normal range of values for this soil type. However, microporosity is predominant (ratio Micro/Macro:3.6/1), which confers to the soil, in horizon A, a restricted water movement and a reduced water storage capacity (Table 1). The MWD value of 1.71 mm shows the structural degradation of this soil type when flood irrigation is used in rice cultivation.
The mean values of the soil chemical properties (Table 1) were classified according to the CQFS-RS/ SC (2004), as follows: very low water pH; the SMP index indicates an amount of lime of 1.3 and 2.7 t ha-1
(100 % PRNT) for irrigated rice and soybean crops, respectively; the mean content of organic matter (2.09 g dm-3
) was considered to be low, which is important because indicates the nitrogen availability in the soil; the cation exchange capacity (CEC) value of 9.68 cmolc dm-3 is within the mean range of
interpretation, which establishes that a 30.73 mg dm-3
content of K is very low; the Al3+ content is classified
as very low; concerning the mean content of P (12.54 mg dm-3), it is considered very high for irrigated
rice cultivation, and low for other crops; the mean Ca content of 3.15 cmolc dm-3 is classified as medium,
while the Mg (1.61 cmolc dm -3
) and S mean contents (15.82 mg dm-3) are considered high; all mean values
determined for the micronutrients are high, except for the mean value of Fe with low crystallinity (1379 mg dm-3
) which is considered appropriate; the mean MBC value was 296.77 mg kg-1 (Table 1) and
is similar to the MBC value determined by Miorelli et al. (2005) in an experiment with crop rotation system on the same soil type and higher than the values determined by Mattos et al. (2005), also under similar conditions.
The coefficient of variation (CV) ranged from 3.02 % (Pd) to 50.31 % (Al). According to the classification proposed by Wilding & Drees (1983), the clay, silt, sand, dispersed clay, Bd, Pd, Tp, Microporosity, pH (H2O), SMP index, OM, TN, CEC and Fe data sets
showed low variability compared to their mean (CV ≤ 15 %), whereas the MWD, Macroporosity, EC,
Aws, H + Al, Ca2+
, Mg2+
, S, Mn, B, Cu, Na and MBC data sets showed moderate variability compared to their mean (15 < CV ≤ 35 %). The P, K, Al3+
and Zn data sets, in turn, showed high variability compared to their mean (CV > 35 %). The variation of soil physical, in general, was lower than of the soil chemical properties, as already observed in other soil types by Carvalho et al. (1998) and Cavalcante et al. (2007). The range of the values of the coefficients of skewness varied from -0.63 to +0.78, except for the
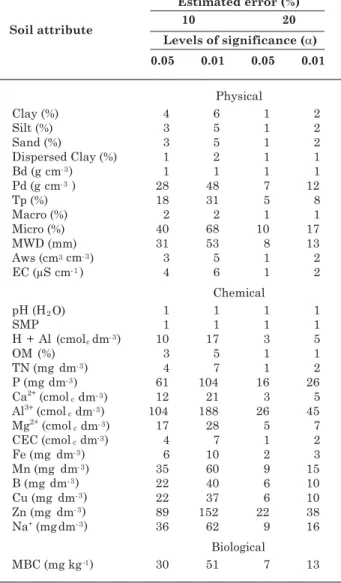
data distribution of S (+1.76) and K (+2.33), which indicates that these elements have a local distribution, that is, high values were found for these elements at some points, but most values were low (Grego et al., 2006). The same tendency was observed for the coefficients of kurtosis (Table 1). It can be concluded that most data distributions tend to be normal (except S and K distributions that tend to be lognormal), so the mean value of each data set can be considered the center of distribution (Nielsen & Wendroth, 2003). Based on these results, the number of subsamples N was calculated (Equation 1) for all properties (except for S and K), at two levels of significance (α = 0.05 and 0.01) and two levels of variation around the mean (10 and 20 %) (Table 2).
Table 2 shows that the number of necessary subsamples varied from only one sample for the
properties Pd, pH and SMP index (variance around the mean of 10 % and significance level of 0.01) to a large number of subsamples, e.g., 26 for Al soil content for the least demanding level (acceptable error of 20 % around the mean and level of significance of 0.05) up to 188 subsamples for the most demanding level (acceptable error of 10 % and level of significance of 0.01), which was a larger number than the number of data used in this study. Compared to the results of Amaro Filho et al. (2007), who studied the horizontal variability of the soil physical properties of a red Oxisol in Mossoró, RN, these results were similar for the data sets of Sand, Bd, Pd and Tp, and higher for those of Silt and Clay. Schlindwein & Anghinoni (2002) however, in their study of a Red Oxisol in Passo Fundo (RS) and Coronel Bicaco (RS), considering only the fertilization system and a soil sampling of 0–0.10 m layer, noted a similar pattern in the number of calculated subsamples for the properties pH and SMP index, a smaller number for OM and a larger for P. It is important to mention that the position of the sampling points in space is not considered in the calculation of descriptive measures of the data by classical statistics (Table 1) and in the estimate of the number of necessary subsamples (Table 2). Consequently, it is possible that variables with equal descriptive measures have totally different variability structures and spatial distributions. Knowledge on spatial dependence and distribution of the properties in the experimental field in the study, among other things, makes it possible to identify homogeneous zones of every property. Then, based on classical statistic, appropriate strategies of soil sampling can be elaborated with the purpose of monitoring the dynamic performance, based on the physical, chemical and biological properties.
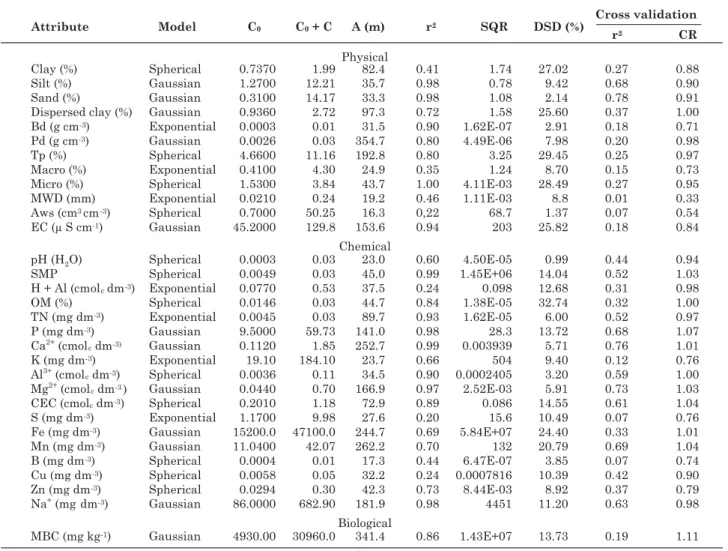
The mathematical models (theoretical semivariograms) adjusted to the experimental semivariograms, as well as the C0 parameters (nugget
effect), C0+C (sill), A (range), r2 (coefficient of
determination) and SSR (sum of squares of residuals) related to the adjustment process are shown in table 3. The calculated values for the DSD (degree of spatial dependence, Cambardella et al., 1994) and the cross validation results: coefficient of determination (r2
) between the estimated values by the adjusted theoretical semivariogram and the observed values and the respective coefficient of regression adjustment line (CR) are also shown.
Table 3 shows that experimental semivariograms, which describe the structure of spatial variability of the studied soil property, were adjusted to the spherical model for 12 properties (Clay, Tp, Micro, Aws, pH, SMP index, OM, Al3+
, CEC, B, Cu and Zn), to the exponential model for seven properties (Bd, Macro, MWD, H + Al, TN, K, and S) and to the Gaussian model for 12 properties (Silt, Sand, Dispersed Clay, Pd, EC, P, Ca2+
, Mg2+
, Fe, Mn, Na and MBC). The coefficients of determination of adjustments (r2
) varied from 0.20 (S) to 1.00 (Micro), and only for Clay (r2
= 0.41), Macro
(r2 = 0.35), MWD (r2 = 0.46),Aws (r2 = 0.22), H + Al
(r2
= 0.24), S (r2
= 0.20), B (r2
= 0.44) and Cu (r2
= 0.24) they were lower than 0.5. The degree of spatial dependence (DSD), that establishes the classification of the degree of spatial dependence between adjacent observations of the property is classified as strong (DSD ≤ 25 %) for 25 soil properties (Silt, Sand, Bd, Pd, Macro, MWD, Aws, pH, SMP index, H + Al, TN, P, Ca2+, K, Al3+, Mg2+, CEC, S, Fe, Mn, B, Cu, Zn, Na
and MBC) and moderate for the 6 remaining properties (25 < DSD ≤ 75 %) (Table 3). According to
Cambardella et al. (1994), variables with strong spatial dependence (DSD ≤ 25 %) are the most influenced by soil composition characteristics, such as original material, climate, organisms and time.
The range of spatial dependence (A) of all studied soil properties varied from 16.2 m (for the property Aws) to 354.7 m (for Pd), and this estimate indicates a higher range than the maximum separation distance between the property observations in the experimental grid (maximum diagonal of 127.3 m). Higher range values at the cited distance would therefore be inconsistent; this result would therefore have to be validated in a larger grid although it is known that changes in the dimension of the area may affect the semivariogram. The same behavior was found for the soil properties Tp, EC, P, Ca2+
, Mg2+
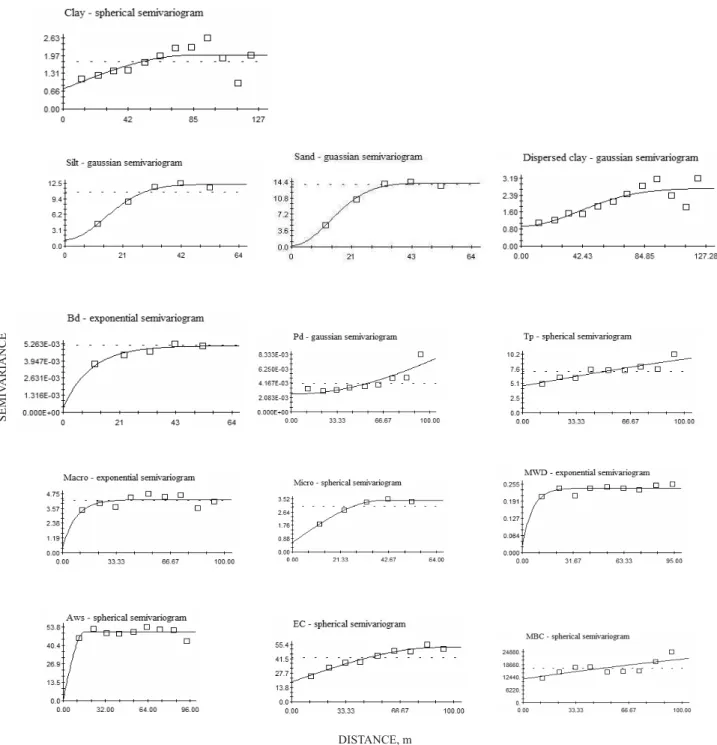
, Fe, Mn, Na, and MBC. However, under these circumstances, it may be affirmed, based on the determined dependence structures that the observations of each one of these properties depend on each other within the studied domain (Brye et al., 2004). Nielsen & Wendroth (2003) emphasize that the nugget effect may occur in the following situations: error in the laboratory process of soil sampling and laboratory analysis or due to the fact that the magnitude of spatial dependence is lower than the shortest distance between the sampled grid points (here 10 m), or possibly due to a combination of both situations. This can explain the pattern of the semivariograms of B, K, S, MWD, Macro, and Aws, although their range is more than 10 m in the adjustment process (as shown in the combined analysis of Table 3 and Figures 1 and 2), which contain the experimental and theoretical semivariograms of all studied soil properties. The analysis of these figures allows us to conclude that the spatial pattern of these properties can be classified as nugget effect, because the first point of the experimental semivariogram practically reaches the sill. Therefore, for future studies aimed at characterizing the spatial dependence structure of the cited properties in this experimental field and/or a similar area, it is recommended that the properties are sampled at distances shorter than 10 m.
a continuous set. The results of cross validation (Table 3) showed values of over 0.5 for the r2 coefficient
for silt (0.68), sand (0.78), SMP index (0.52), TN (0.52), P (0.68), Ca2+ (0.76), Al3+ (0.59), Mg2+ (0.73), CEC
(0.61), Mn (0.69) and Na (0.63) soil properties and lower than 0.5 for the other studied properties. For the coefficient of regression (CR), which indicates whether or not the kriging technique over or underestimates extreme values, the values ranging from 0.85 to 1.15 were considered adequate, and it was possible to verify that most properties met this requirement, except for the Bd (0.71), Macro (0.73), MWD (0.33), Aws (0.54), EC (0.84), K (0.76), S (0.76), B (0.74) and Zn (0.79) soil properties.
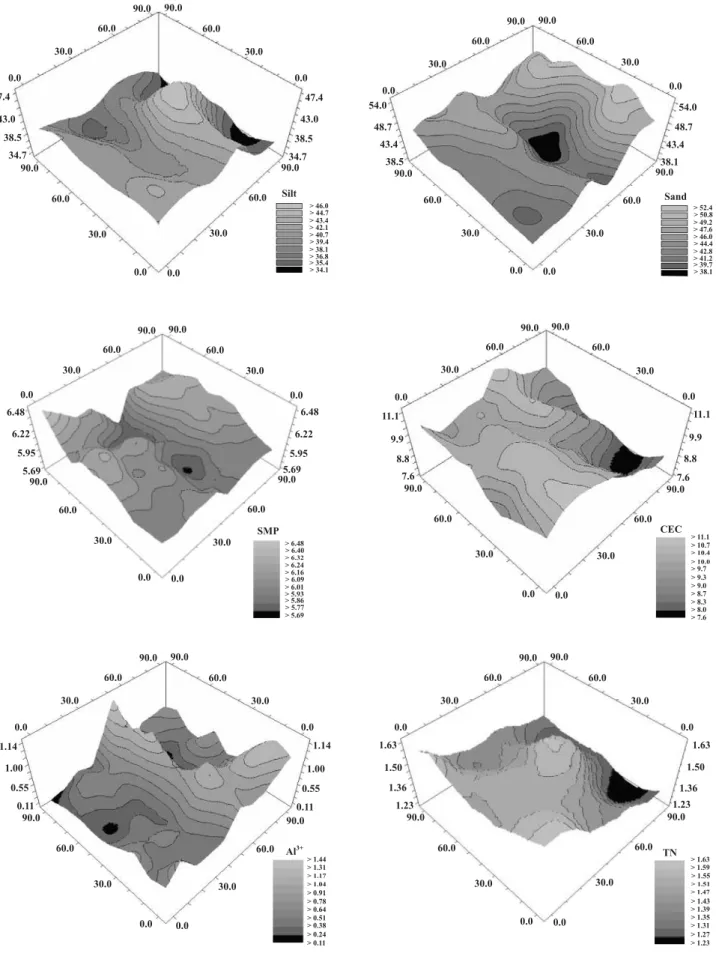
The cross validation criterion was found to be a more efficient tool in the determination of the quality of the semivariogram, and thematic maps (Figure 3) of silt, sand, SMP index, TN, Al3+
and CEC soil
properties were constructed using the kriging technique, which is based on the defined spatial dependence structure by the theoretical semivariogram. Despite their proper performance during the cross validation process, that is, their efficiency for use in the kriging technique, the maps of P, Ca2+, Mg2+, Mn
and Na+
properties were not constructed because their semivariograms were not conclusive. This occurred because the spatial dependence values (A) found were higher than the maximum distance between the observations of the property in the experimental grid (maximum diagonal of 127.3 m) (Table 3).
Table 3 also shows that although the degree of spatial dependence of the property was classified as strong (DSD ≤ 25 %) the performance of the adjusted semivariogram through the use of the cross validation technique was not necessarily good. For example, the adjusted semivariogram for the pH property, with
Table 3. Adjusted mathematical models to the experimental semivariograms and their respective parameters (nugget effect, sill and range), coefficient of determination and sum of squares of residuals, degree of spatial dependence and the results of cross validation (coefficient of determination and the coefficient of regression) of all studied soil properties
a DSD of 1 % (strong DSD), did not show a good performance during the cross validation process because the determination and regression coefficients were 0.44 and 0.94, respectively. Similar results were found by Gomes et al. (2007), i.e, adjusted semivariograms for soil properties with strong spatial dependence they did not show a good performance during the cross validation process. A more accurate visual analysis of the experimental and theoretical semivariograms for the pH property (Figure 1) demonstrates that, in the spatial dependence zone
limited by range A, which is the most important in the kriging process, there is only one point of the experimental semivariogram located next to the sill. The theoretical semivariogram is therefore not conclusive.
From the joint analysis of tables and figures it is possible to observe that when the coefficient of variation of the property is high, the semivariogram and the spatial distribution are valuable tools in the simplification of resampling, or, on the contrary, when the coefficient of variation is low, classical statistics
may be more practical than geostatistics in the determination of the mean performance of the property in future studies, in many cases. This can be exemplified in the present study by the performance of the Al3+
and SMP properties. Despite the fact that Al is a soil property with a high coefficient of variation, which means that a large number of subsamples is required to obtain an accurate estimate of the mean, its spatial performance (Figure 3) made it possible to divide the area into three homogenous subareas: one
L-shaped subarea located in the center, which had a relatively high value of Al3+, and the two other
subareas on the remaining part had a lower value of Al3+. Therefore, a good estimate of the mean can be
inferred from a small number of subsamples. On the other hand, the SMP index performance is very different, because only one random sample is required to accurately represent the mean, using classical statistics. However, a large number of samples would be necessary if geostatistics was applied (Figure 3).
Figure 3. Maps of the spatial distribution of silt, sand, SMP index, CEC, Al3+
CONCLUSIONS
1. The spatial variability structure of the silt, sand, SMP index, cation exchange capacity, Al3+
and total N soil properties were adequately determined by geostatistics, and although the parameters of the Mg2+
, Ca2+
, Na+
, P and Mn soil properties showed a good performance in the cross validation process, their spatial range was out of the domain area.
2. The range of variability of the spatial dependence structure of the contents of B, K, S and the values of macroporosity, mean weighted diameter of aggregates and available water storage was less than 10 m, which deserves further investigation.
3. Cross validation technique, through the coefficients of determination and regression, was found to be more efficient to evaluated the quality of the adjusted mathematical model than the spatial dependence degree.
4. The number of necessary subsamples to determine the mean performance of the soil properties accurately by classical statistics, for properties such as soil texture fractions, bulk density, macroporosity, available water storage, electrical conductivity, pH, SMP index, organic matter, total N, CEC, and Fe was 10 at the maximum. However, the number of necessary subsamples to determine the contents of P, Al3+
, and Zn was higher than 100 at an estimated error of 10 % of the mean and a level of significance of 0.01.
5. The combination of both classical statistics and geostatistics can in many cases simplify the soil sampling process at no detriment to the quality of soil information.
ACKNOWLEDGEMENTS
The authors are indebted to the National Council of Scientific and Technological Development (CNPq) for financial support and scholarships.
LITERATURE CITED
AMARO FILHO, J.; NEGREIROS, R.F.D.; ASSIS JUNIOR, R.N. & MOTA, J.C.A. Amostragem e variabilidade de atributos físicos de um Latossolo Vermelho em Mossoró, RN. R. Bras. Ci. Solo, 31:415-422, 2007.
ANDRADE, A.R.S.; GUERRINI, I.A.; GARCIA, C.J.B.; KATEZ, I. & GUERRA, H.O.C. Variabilidade espacial da densidade do solo sob manejo da irrigação. Ci. Agrotec., 29:322-329, 2005.
BRYE, K.R.; SLATON, N.A.; MOZAFFARI, M.; SAVIN, M.C.; NORMAN, R.J. & MILLER, D.M. Short-term effects of land leveling on soil chemical properties and their relationships with microbial biomass. Soil Sci. Soc. Am. J., 68:924-934, 2004.
CAMBARDELLA, C.A.; MOORMAN, T.B.; NOVAK, J.M.; PARKIN, T.B.; KARLEN, D.L.; TURCO, R.F. & KONOPKA, A.E. Field-scale variability of soil properties in Central Iowa soils. Soil Sci. Soc. Am. J., 58:1501-1511, 1994.
CARVALHO, J.R.P. & ASSAD, E.D. Otimização de interpoladores espaciais para estimar chuva no Sistema Agritempo. Campinas, Embrapa Informática Agropecuária, 2003. 17p. (Boletim de Pesquisa e Desenvolvimento, 9)
CARVALHO, O.S.; GASCÓ, J.M.; LOPÉZ, F.G. & REQUEJO, A.S. Variabilidade espacial de algumas propriedades químicas e físicas de um solo submetido a diferentes sucessões de cultivo. R. Bras. Ci. Solo, 22:497-503, 1998. CAVALCANTE, E.G.S.; ALVES, M.C.; SOUZA, Z.M. & PEREIRA, G.T. Variabilidade espacial de atributos químicos do solo sob diferentes usos e manejos. R. Bras. Ci. Solo, 31:1329-1339, 2007.
COMISSÃO DE QUÍMICA E FERTILIDADE DO SOLO – SBCS/CQFS. Manual de adubação e calagem para os Estados do Rio Grande do Sul e de Santa Catarina. 10.ed. Porto Alegre, 2004. 394p.
EMPRESA BRASILEIRA DE PESQUISA AGROPECUÁRIA -EMBRAPA. Centro Nacional de Pesquisa de Solos. Sistema brasileiro de classificação de solos. 2.ed. Rio de Janeiro, 2006. 306p.
EMPRESA BRASILEIRA DE PESQUISA AGROPECUÁRIA -EMBRAPA. Centro Nacional de Pesquisa de Solos. Manual de métodos de análise do solo. 2.ed. Rio de Janeiro, 1997. 212p.
FARACO, M.A.; URIBE-OPAZO, M.A.; SILVA, E.A.; JOHANN, J.A. & BORSSOI, J.A. Seleção de modelos de variabilidade espacial para elaboração de mapas temáticos de atributos físicos do solo e produtividade da soja. R. Bras. Ci. Solo, 32:463-476, 2008.
FERREIRA, A.S.; CAMARGO, F.A.O. & VIDOR, C. Utilização de microrganismos na avaliação da biomassa microbiana do solo. R. Bras. Ci. Solo, 23:991-996, 1999.
GEE, G.W. & BAUDER, J.W. Particles size analysis In: KLUTE, A., ed. Methods of soil analysis. 2.ed. Madison, American Society of Agronomy, 1986. p.383.
GOMES, N.M.; SILVA, A.M.; MELLO, C.R.; FARIA, M.A. & OLIVEIRA, P.M. Métodos de ajuste e modelos de semivariograma aplicados ao estudo da variabilidade espacial de atributos físico-hídricos do solo. R. Bras. Ci. Solo, 31:435-443, 2007.
IRGA. Mercado do arroz. Palestra Feliciano de Oliveira. Disponível em: < http;//www.irga.rs.gov.br/arquivos/ 2008307103431.02> Acesso em: 10 jun. 2008.
ISAAKS, E.H. & SRIVASTAVA, R.M. An introduction to applied geostatistics. New York, Oxford University Press, 1989. 561p.
JOURNEL, A.G. & HUIJBREGTS, C.J. Mining geostatistics. London, Academic Press, 1978.
KEMPER, W.D. & ROSENAU, R.C. Aggregate stability and size distribution. In: KLUTE, A., ed. Methods of soil analysis. 2.ed. Madison, American Society of Agronomy, 1986. p.425-441.
MATTOS, M.L.T.; SCIVITTARO, W.B.; MARTINS, J.F.S. & SANTOS, M.B. Carbono e nitrogênio da biomassa e atividade Microbiana em um solo cultivado com Arroz irrigado orgânico e manejado com diferentes adubos verdes. In: CONGRESSO BRASILEIRO DE ARROZ IRRIGADO, 3., Santa Maria, 2005. Anais. Santa Maria, Universidade Federal de Santa Maria, 2005. p.490-492. MIORELLI, D.; CASTILHOS, D.D.; GOMES, A.S. & PAULETO,
E.A. Biomassa e atividade de um Planossolo sob diferentes sistemas de manejo. In: CONGRESSO DE INICIAÇÃO CIENTÍFICA, 14., Pelotas, 2005. Anais. Pelotas, Universidade Federal de Pelotas, 2005. CD ROM. McGRAW, T. Soil test level variability in Southern Minnesota.
Better Crops Plant Foods, 78:24-25, 1994.
NATURAL RESOURCES CONSERVATION SERVICE – NRCS. United States Department of Agriculture (USDA). 2003. Available online at http://soils.usda.gov/technical/ classification/tax_keys
NIELSEN, D.R. & WENDROTH, O. Spatial and temporal statistics: Sampling field soils and their vegetation. Reiskirchen, Catena Verlag, 2003. 398p.
PALMEIRA, P.R.T.; PAULETTO, E.A.; TEIXEIRA, C.F.A.; GOMES, A.S. & SILVA, J.B. Agregação de um Planossolo submetido a diferentes sistemas de cultivo. R. Bras. Ci. Solo, 23:189-195, 1999.
REICHARDT, K. & TIMM, L.C. Solo, planta e atmosfera: Conceitos, processos e aplicações. São Paulo, Manole, 2008. 478p.
ROBERTSON, G.P. GS+: Geostatistics for the environmental sciences. Plainwell, Gamma Design Software, 2004. 161p. SCHLINDWEIN, J.A. & ANGHINONI, I. Tamanho da subamostra e representação da fertilidade do solo no sistema plantio direto. Ci. Rural, 32:963-968, 2002. SOUSA, J.R.; QUEIROZ, J.E. & GHEYI, H.R. Variabilidade
espacial de características físico-hídricas e da água disponível em um solo aluvial no semi-árido paraibano. R. Bras. Eng. Agríc. Amb., 3:140-144, 1999.
SOUZA, Z.M.; MARQUES JUNIOR, J. & PEREIRA, G.T. Variabilidade espacial de atributos físicos do solo em diferentes formas do relevo sob cultivo de cana-de-açúcar. R. Bras. Ci. Solo, 28:937-944, 2004.
TEDESCO, M.J.; GIANELLO, C.; BISSANI, C.A.; BOHNEN, H. & VOLKWEISS, S.J. Análise de solo, plantas e outros materiais. 2.ed. Porto Alegre, Universidade Federal do Rio Grande do Sul, 1995. 174p. (Boletim Técnico, 5) VANCE, E.D.; BROOKES, P.C. & JENKINSON, D.S. An
extraction method for measuring soil microbial biomass C. Soil Biol. Biochem., 19:703-707, 1987.
VERONESE JUNIOR, V.; CARVALHO, M.P.; DAFONTE, J.; FREDDI, O.S.; VÁSQUEZ, E.V. & INGARAMO, O.E. Spatial variability of soil water content and mechanical resistance of Brazilian ferralsol. Soil Till. Res., 85:166-177, 2006.
VIEIRA, S.R. Geoestatística em estudos de variabilidade espacial do solo. In: NOVAIS, R.F.; ALVAREZ V., V.H. & SCHAEFER, C.E.G.R., eds. Tópicos em ciência do solo. Viçosa, MG, Sociedade Brasileira de Ciência de Solo, 2000. p.1-54.
WARRICK, A.W. & NIELSEN, D.R. Spatial variability of soil physical properties in the field. In: HILLEL, D., ed. Applications of physics. New York, Academic Press, 1980. p.319-344.
WEBSTER, R. & OLIVER, M.A. Geostatistics for environmental scientists. West Sussex, John Wiley & Sons, 2001.271p.