Altered renal response to acute volume expansion in transgenic rats
harboring the human tissue kallikrein gene
Ka´tia T. Passaglio
a, Ovidiu Baltatu
b, Raquel P. Machado
c, Adelina M. dos Reis
a,
Joa˜o B. Pesquero
d, Michael Bader
b, Robson A.S. Santos
a,*
a
Laborato´rio de Hipertensa˜o, Instituto de Cieˆncias Biolo´gicas and Laborato´rio de Endocrinologia, Universidade Federal de Minas Gerais, Av Antonio Carlos, 6627, 31270-901, Belo Horizonte, Brazil
b
Max-Delbru¨ck-Center for Molecular Medicine, Berlin-Buch, Germany c
Departamento de Fisiologia, Instituto de Cieˆncias Biolo´gicas, Universidade Federal de Ouro Preto, Ouro Preto, Brazil d
Departamento de Biofı´sica, Universidade Federal de Sa˜o Paulo, 04023-062, Sa˜o Paulo, Brazil
Received 28 February 2004; accepted 2 July 2004 Available online 13 August 2004
Abstract
The renal response to acute volume expansion was investigated in transgenic (TGR) rats harboring the human tissue kallikrein gene. After a primer injection of 0.9% NaCl (3 ml/100 g, i.v), Sprague–Dawley (SD) or TGR rats received a continuous infusion of 0.9% NaCl (15Al/
100 g/min, i.a.) through a catheter placed into the carotid artery. Acute volume expansion was produced by a second injection of 0.9% NaCl (2 ml/100 g, i.v.) 65 min after the first injection. Plasma vasopressin (AVP) and atrial natriuretic peptide (ANP) concentration was measured before and within 10 min of volume expansion. TGR animals presented a blunted response to acute volume expansion evidenced by an attenuated increase in total and fractional water and sodium excretion. Before or after volume expansion, plasma AVP and ANP did not differ between SD and TGR. Pre-treatment with the BK-B2antagonist HOE-140 (7.5Ag/100 g. i.a) partially improved the renal response of TGRs
and severely blunted the response in SD rats. These data show that TGR (hKLK1) rats have an impaired renal response to acute volume expansion that can not be accounted for by changes in the release of AVP or ANP.
D2004 Elsevier B.V. All rights reserved.
Keywords:Kinins; Transgenic rats; Human genes
1. Introduction
The kallikrein–kinin system (KKS) plays an important role in the regulation of renal and cardiovascular functions. Kinins are liberated from kininogen through the action of kallikreins and interact with receptors, B1 and B2. In
addition to eliciting vasodilatation and natriuresis, kinins also elicit smooth muscle contraction, nociception, and other inflammatory responses[1].
All the components of the KKS are expressed within the kidney [2,3], establishing a paracrine system capable of
controlling local nephron functions. This peptide system is also involved in the regulation of hydroelectrolyte balance through the interactions with others peptides such as, vasopressin (AVP) [4] and atrial natriuretic peptide (ANP) [5].
To analyze the functions of this system, transgenic techniques have been employed either to overexpress or ablate pertinent genes. This approach has led to numerous new hyper- and hypotensive animal models and has substantially increased the understanding of the physiolog-ical role of the KKS[6]. For instance, both kinin receptors, B1and B2, have been inactivated in mice by gene-targeting
technologies[7,8]. Mice lacking B2, which mediates most of
the effects of the KKS, develop increased blood pressure [9,10]. In contrast, mice and rats that overexpress either this
0167-0115/$ - see front matterD2004 Elsevier B.V. All rights reserved. doi:10.1016/j.regpep.2004.07.008
* Corresponding author. Fax: +55-031- 499-2924.
receptor subtype or the human tissue kallikrein gene (hKLK1) manifest hypotension [11–13]. In addition, tran-sient expression of hKLK1 in hypertensive rats by somatic gene transfer elicited similar responses [14–17], which supports the fact that kinins are important physiological regulators of mammalian blood pressure.
However, the role of the KKS in renal function and its interaction with other peptides was only poorly investigated in transgenic animal models yet. So, in this study, we used a novel transgenic animal model expressing human tissue kallikrein [TGR (hKLK1)] [13] to further understand the role of the KKS in renal function regulation and the mechanisms involved in its effects.
2. Methods
2.1. Experimental protocols
TGR rats were produced using a 5.6-kb DNA fragment containing the entire hKLK1 gene under the control of the mouse metallothionein (mMT1) promoter (see Ref.[13], for details).
Male TGR (hKLK1) and Hannover Sprague–Dawley (SD) rats, 350–450 g, were used. The animals were kept in a temperature-controlled room on a 14/10-h light/dark cycle with free access to standard chow and tap water.
Forty-eight hours before arterial and venous catheter implantation, the rats were housed in metabolic cages (Rochester, New York) with free access to chow and water. TGR (hKLK1) and age-matched SD rats were anaesthetized with ether and their femoral and carotid artery and jugular vein were cannulated.
Acute volume expansion was performed as previously described[18]. Twenty-four hours after cannulation, the rats received an intravenous (IV) injection of 0.9% NaCl (3 ml/ 100 g) followed by a continuous infusion of 0.9% NaCl (15
Al100 g 1min 1) into the descending aorta through the
carotid catheter. After a control period of 30 min, a volume expansion (expansion or experimental period) was per-formed by intravenous injection of 0.9% NaCl (2 ml/100 g over 1 min). After 30 min (recovery period), an additional urine sample was collected (recovery). Pulsatile and mean arterial pressures were continuously recorded by a pressure transducer connected to data-acquisition systems (BIOPAC, Santa Barbara, Ca, USA).
2.1.1. Protocol 1. Effect of acute volume expansion on the renal function variables in TGR and SD rats
Renal function variables were determined in TGR rats (hKLK1) (n=9) and in age-matched SD (n=6) rats.
2.1.2. Protocol 2. Effect of blockade of BK B2receptors on renal function variables
In order to evaluate the involvement of BK B2receptors
on the renal response to acute volume expansion, an in bolus
i.v. injection of HOE-140 (7.5 Ag/100 g b.w.) was
performed 10 min before the beginning of the expansion period (TGR, n=5 and SD,n=5).
2.1.3. Protocol 3. Effect of acute volume expansion on plasma ANP and AVP concentration
To investigate the role of AVP and ANP in the renal response to volume expansion in TGR rats, additional groups of TGR (n=5) and SD (n=5) rats were used. The plasma levels of AVP and ANP were determined in blood samples collected 10 min after acute volume expansion.
2.2. General procedures
2.2.1. Blood sampling
Blood samples (1 ml) for the measurements of serum osmolality, sodium, potassium and creatinine concentration were collected into heparinized tubes and were centrifuged at 2000g for 10 min. Plasma samples were used. Blood sample for ANP and AVP measurements (1 ml) were collected in tubes containing a mixture of peptidase inhibitors (1 mM p-OH Hg-benzoate, 10 Al; 30 mM O
-phenantroline, 50Al; 1 mM PMSF, 10Al; 0.2 M EDTA, 50 Al; 1 mM Pepstain, 20 Al).
Plasma samples for AVP were extracted using acti-vated (99% MeOH/0.1% TFA) C18 Bond-Elut Columns (Varian, Harbor City, CA, USA). After sample applica-tion, the columns were washed with 20 ml of 0.1% TFA. The peptides were eluted with 3 ml of 99% MeOH/0.1% TFA.
Plasma samples for ANP were extracted using activated (acetonitrile and 0.2% ammonium acetate) Sep-Pak Car-tridges (Waters, Milford, Massachusetts, USA). After sample application, the columns were washed with 5 ml of 0.2% ammonium acetate and the peptides were eluted with 3 ml of 60% acetonitrile.
After evaporation, the samples were stored at 20 8C until analysis.
2.2.2. Urine samples
After collection, urine samples were centrifuged at 3000g for 5 min (room temperature) for measurement of urine osmolality, sodium, potassium and creatinine concentration.
2.3. Analytical procedures
Sodium and potassium concentrations were measured by flame photometry (Celm FC-180, USA). Serum and urine osmolality were measured by a freezing-point osmometer (AOsmette, Natick, MA, USA). Creatinine clearance
2.4. Binding of bradykinin and ANP to kidney slices
2.4.1. Bradykinin
Kidneys of SD and TGR (hKLK1) rats were snap-frozen in liquid nitrogen. Sections (14 Am) were serially
cut starting from the central area of the kidney, mounted on 1% gelatinized slides and dried at 4 8C before the binding assay. Experiments were performed in duplicate or quadruplicate. All slices were pre-incubated in a 10 mM Na-phosphate buffer, pH 7.4, containing 120 mM NaCl, 5 mM MgCl2, 0.2% BSA and 0.005% bacitracin for 10 min.
The sections were then incubated in the same buffer containing 100 AM PMSF, 100 AM indometacin and 500 AM o-phenanthroline, and for slices used to determine
nonspecific binding (NSB), with 10 6M cold bradykinin. Total binding was determined by incubation of the sections with 10 mM Na-phosphate buffer, pH 7.4 complemented with the same enzyme inhibitors as above and 0.5 nM 125I-[Tyr0-bradykinin] for 60 min at room temperature. Tyr0-Bradykinin was labelled with 125I by the chloramine T method and purified by HPLC, as described [21]. The binding reaction was stopped by washing the slices four times (1 min each) in 250 ml of ice-cold Tris– HCl 50 mM, pH 7.4. After drying at room temperature, the slices were exposed to autoradiographic film (Kodak Biomax MS) for 2 to 3 days at 80 8C.
2.4.2. Atrial natriuretic peptide
Autoradiography methods were performed as previously described [22]. The frozen kidneys were mounted on cryostat chucks, and 10-Am-thick sections were prepared.
The sections were thaw-mounted on pre-cleaned, gelatin-coated slides and stored at 808C until used. ANP receptor autoradiography was performed as described previously [23,24]. Briefly, the kidney sections were pre-incubated for 15 min at room temperature in 50 mM Tris–HCl buffer (pH 7.4) containing 0.1% polyethyleneimine to reduce non-specific binding. The sections were then incubated at room temperature for 60 min with either [125I] ANP alone or with 10 6M of unlabeled ANP, in 50 mM Tris–HCl buffer (pH 7.4) containing 150 mM NaCl, 5 mM MgCl2, 40 Ag/ml
Bacitracin (Sigma, St. Louis, MO), and 0.5% BSA. At the end of the incubation period, the slides were rinsed four times (2 min each) with Tris–HCl buffer, pH 7.4, at 48C. This was followed by a wash in distilled water, after which the slides were dried under a stream of cold air. The dried tissue sections were placed in a phosphor-sensitive cassette for 48 h, after which the images were scanned, visualized and quantified using a PhosphorImager (Fuji, Japan). Binding in the presence of 10 6 M ANP was considered nonspecific.
2.5. Statistical analysis
Results are expressed as meanFS.E.M. Data were
analyzed (GraphPad Prism 3.0 Software) using ANOVA
followed by Dunnet test to compare the three consecutive experimental periods within the same group. When appropriate, the data obtained in two consecutive periods (control and expansion) were compared using paired Student’s t-test. For the comparison between the results obtained in TGR rats and SD rats, the non-paired Student’s t-test was used. The level of significance was set at pb0.05.
3. Results
3.1. Renal response to acute volume expansion in TGR (hKLK1) rats
The urine flow of TGR rats was significantly lower in the control period (0.048F0.010 ml/min) in comparison
with SD rats (0.100F0.015 ml/min) (Fig. 1A). Acute
volume expansion increased this parameter in TGR and SD rats (0.093F0.017 and 0.289F0.015 ml/min, respec-tively); however, the increase in urine flow was signifi-cantly smaller in the TGR group. The lower urine flow of TGR rats was associated with a larger water reabsorption (TcH2O) in comparison with SD rats (Table 1). Accordingly, the fractional excretion of water (FEH2O) in the TGR group was significantly smaller than in the SD group in all periods. More importantly, the fractional water excretion did not change significantly in TGR rats following acute volume expansion (control=0.040F0.012, expansion=
0.055F0.010, recovery=0.056F0.011), in contrast with
the increase observed in SD rats (Fig. 1B). Creatinine clearance (Ccr) did not change in the experimental period
in both groups but showed statistical difference between the groups in the recovery period (1.52F0.37 ml/min in TGR vs. 0.67F0.10 ml/min in SD rats, pb0.05, Table 1).
As observed for urine flow, sodium excretion in TGR was lower than in SD rats in the control period (Fig. 1C). Acute volume expansion significantly increased the sodium excretion in TGR (control=3.66F1.05 AEq/min to
expansion=7.21F1.22 AEq/min) and in SD rats
(con-trol=8.68F1.44 to expansion=23.48F1.53AEq/min).
How-ever, the increase in sodium excretion was significantly smaller in the TGR group (Fig. 1C). Fractional excretion of sodium (FENa) of the TGR group showed a progressive
increase reaching statistical significance in the recovery period (control=0.017F0.005, expansion=0.029F0.005,
recovery=0.058F0.011). However, this increase was
smaller than that observed in SD rats (control=0.054F
0.008, expansion=0.123F0.021, recovery=0.106F0.016) (Fig. 1D).
Urine osmolality of the TGR rats was significantly higher than that of SD rats in all periods. A very high value of urine osmolality (N1500 mosM/kg H2O) was observed
significant differences in potassium excretion, osmolar clearance, plasma osmolality and sodium urinary concen-tration were observed between TGR and SD rats (Table 1). On the other hand, urinary potassium concentration was significantly higher in TGR while plasma ion concentration (sodium and potassium) was significantly lower in the transgenic animals (Table 1). No significant changes in MAP were observed after acute volume expansion in TGR
or SD rats (control values 118F6.3 in TGR and 118F4.2
in SD, respectively).
In order to verify if the differences found for water and sodium excretion were due to changes in plasma AVP and/or ANP concentration, these hormones were measured in plasma samples taken 10 min after acute volume expansion. As shown inFig. 2, plasma AVP levels after acute volume expansion did not differ between SD (1.16F0.47 pg/ml) and
Table 1
Effects of the acute volume expansion on the renal function on TGR (hKLK1) and Sprague–Dawley rats
Sprague–Dawley TGR (hKLK1)
Control Expansion Recovery Control Expansion Recovery
THc2O(ml/min) 0.015F0.005 +0.049F0.019* 0.027F0.004 0.070F0.019** 0.084F0.033** 0.080F0.028
Creatinine clearance (ml/min) 1.03F0.12 1.43F025 0.67F0.10* 2.17F0.70 1.77F0.22 1.52F0.37 Osmolar clearance (ml/min) 0.115F0.018 0.240F0.022* 0.102F0.008 0.118F0.024 0.177F0.040 0.148F0.036 Urine osmolality
(mosM/kg H2O)
305.92F12.81 222.25F25.35* 348.50F9.52* 925.40F220.68** 624.7F130.57*,** 588.89F78.48**
Plasma osmolality (mosM/kg H2O)
269.92F10.12 264.08F8.53 258.25F7.78 294.63F9.56 289.11F8.44 283.56F8.39
Potassium excretion (AEq/min) 3.31F0.33 4.01F0.48 1.46F0.14* 3.37F0.99 3.38F0.84 3.15F0.84 Sodium urine
concentration (mEq/l)
86.50F3.69 82.50F7.48 128.50F5.00* 75.06F16.06 84.89F12.38 106.72F12.62*
Potassium urine concentration (mEq/l)
34.63F2.43 13.88F1.59* 19.35F0.89* 90.89F26.80 52.72F18.52* 45.30F9.64*,**
Sodium plasma concentration (mEq/l)
159.10F2.83 154.56F2.66* 150.02F2.88* 143.36F2.36** 145.42F2.46** 147.47F3.32
Potassium plasma concentration (mEq/l)
3.52F0.23 3.31F0.13 3.10F0.11* 2.28F0.25 2.28F0.24** 2.28F0.24**
Data are meanFS.E. Sprague–Dawley,n=6; TGR (hKLK1),n=9. * pb0.05, compared to the control period.
** pb0.05, SD vs. TGR.
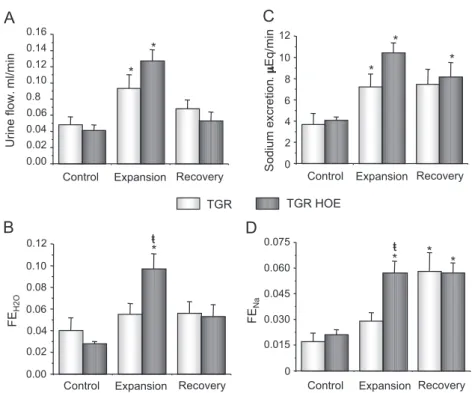
Fig. 1. Effect of acute volume expansion in TGR (hKLK1) and Sprague–Dawley rats. Urine flow, sodium excretion, fractional H2O excretion (FEH2O) and
fractional sodium excretion were determined in TGR (n=5) and SD (n=6) using samples collected at the end of three consecutive periods of 30 min: control, acute volume expansion (0.9% NaCl, 2 ml/100 g i.v.) and recovery period. *pb0.05, compared to the control period;tp
TGR (0.27F0.27 pg/ml) rats. A similar finding was obtained
for plasma ANP. Although a smaller concentration of ANP was observed in TGR (TGR=470.09F129.09 pg/ml vs.
SD=769.61F173.63 pg/ml), the difference did not reach
statistical significance. Basal values of AVP and ANP measured in additional groups of animals were not statisti-cally different, either (Fig. 2).
3.2. Effect of HOE-140 administration in TGR (hKLK1) rats submitted to acute volume expansion
Treatment with HOE-140 partially reversed the blunted response of TGR rats to acute volume expansion. A significant increase of fractional excretion of water after volume expansion was observed in HOE-140-treated TGR rats (control=0.028F0.002, expansion=0.097F0.014) (Fig. 3B). This increase, absent in non-treated TGR rats, did not result in significant differences in urine flow between treated and non-treated groups due to the lower values of GFR in the treated group (Table 2). Similar data were obtained for sodium excretion (Fig. 3D).
No significant differences in osmolar clearance, urine and plasma osmolality, potassium excretion, potassium urine concentration and sodium plasma concentration were observed between treated or non-treated TGR animals (Table 2). HOE treatment normalized the lower plasma potassium concentration observed in TGR (Tables 1 and 2).
Fig. 3. Effect of HOE-140 administration in TGR (hKLK1) rats submitted to acute volume expansion. Urine flow, sodium excretion, fractional H2O excretion
(FEH2O) and fractional sodium excretion were determined in control TGR (n=9) and HOE-treated TGR (n=5) using samples collected at the end of three
consecutive periods of 30 min: control, acute volume expansion (0.9% NaCl, 2 ml/100 g i.v.) and recovery period. TGR rats received HOE intra-arterial injection (7.5Ag/100 g) 10 min before the volume expansion. *pb0.05, compared to the control period;tpb0.05, control vs. HOE-treated rats.
3.3. Effect of HOE-140 administration in Sprague–Dawley rats submitted to an acute volume expansion
In sharp contrast with the finding in TGR, HOE-140 treatment produced marked changes in the renal response to acute volume expansion in SD rats. There was a significant attenuation of the increase in urine flow, FEH2O,
sodium excretion and FENa observed after volume
expan-sion (Fig. 4).
Water reabsorption (TcH2O), creatinine clearance, urine osmolality, potasssium excretion and sodium and potas-sium urine concentration were significantly higher in SD rats treated with HOE-140 than in control SD rats (Table 3).
Fig. 4. Effect of HOE-140 administration in Sprague–Dawley rats submitted to acute volume expansion. Urine flow, sodium excretion, fractional H2O
excretion (FEH2O) and fractional sodium excretion were determined in control SD (n=6) and HOE-treated SD (n=5) using samples collected at the end of three
consecutive periods of 30 min: control, acute volume expansion (0.9% NaCl, 2 ml/100 g i.v.) and recovery period. SD rats received HOE intra-arterial injection (7.5Ag/100 g) 10 min before the volume expansion. *pb0.05, compared to the control period;tpb0.05, control vs. HOE-treated rats.
Table 2
Effects HOE-140 administration on the renal function of TGR [h(KLK1)] rats submitted to acute volume expansion
TGR (hKLK1) HOE-140 7.5Ag/100 g
Control Expansion Recovery Control Expansion Recovery
TcH2O(ml/min) 0.070F0.019 0.084F0.033 0.080F0.028 0.045F0.012 0.023F0.026 0.068F0.018*
Creatinine clearance (ml/min) 2.17F0.70 1.77F0.22 1.52F0.37 1.53F0.26 1.36F0.10 1.02F0.13 Osmolar clearance (ml/min) 0.118F0.024 0.177F0.040 0.148F0.036 0.087F0.015 0.150F0.023* 0.122F0.022* Urine osmolality (mosM/kg H2O) 925.40F220.68 624.7F130.57* 588.89F78.48 563.20F73.16 325.50F55.36* 659.24F110.40
Plasma osmolality (mosM/kg H2O) 294.63F9.56 289.11F8.44 283.56F8.39 263.33F5.66 262.00F6.52 260.67F7.49
Potassium excretion (AEq/min) 3.37F0.99 3.38F0.84 3.15F0.84 2.42F0.41 3.13F0.54 2.41F0.30
Sodium urine
concentration (mEq/l)
75.06F16.06 84.89F12.38 106.72F12.62* 106.00F16.51 87.27F12.51 168.50F26.36*,**
Potassium urine concentration (mEq/l)
90.89F26.80 52.72F18.52* 45.30F9.64* 59.00F8.32 26.20F5.44* 53.80F11.38
Sodium plasma concentration (mEq/l)
143.36F2.36 145.42F2.46 147.47F3.32 138.17F3.37 138.83F3.02 139.50F2.69
Potassium plasma concentration (mEq/l)
2.28F0.252 .28F0.24 2.28F0.24 3.42F0.42 3.25F0.37** 3.08F0.33
Data are meanFS.E. TGR (hKLK1) control,n=9; HOE-treated,n=5. * pb0.05, compared to the control period.
3.4. Binding of bradykinin and ANP
Binding of [125I] ANP and [125I]-Tyr0-Bradykinin to kidney sections of SD and TGR was determined by radioautography. As shown in Fig. 5A, the binding of labeled ANP in kidney slices of TGR (hKLK1) was preserved and even increased. As observed for ANP, 125 I-Tyr0-Bradykinin binding was not altered in kidney slices of TGR as compared to SD rats (Fig. 5B).
4. Discussion
The kallikrein–kinin system is believed to play an important role in regulating renal function [1,25,26]. Con-trary to what would be expected considering previous observations [25,26], transgenic rats harboring the tissue human kallikrein gene presented a blunted renal response to acute volume expansion. Equally important, TGR (hKLK1) presented a significant decrease in sodium and water
Fig. 5. Autoradiography of [125I]-ANP and [125I]-Tyr-Bradykinin to Sprague–Dawley and TGR (hKLK1) rat kidneys. Total binding and displacement with
10 6M ANP (A) or with Bradykinin (B) are shown. NSB=nonspecific binding.
Table 3
Effects HOE-140 administration over renal function of Sprague–Dawley rats submitted to acute volume expansion
Sprague–Dawley HOE-140 7.5Ag/100 g
Control Expansion Recovery Control Expansion Recovery
TcH2O(ml/min) 0.015F0.005 +0.049F0.019* 0.027F0.004 0.120F0.043** 0.047F0.032 0.079F0.008**
Creatinine clearance (ml/min) 1.03F0.12 1.43F025 0.67F0.10* 1.93F0.28** 1.68F0.13 1.54F0.27** Osmolar clearance (ml/min) 0.115F0.018 0.240F0.022* 0.102F0.008 0.225F0.050 0.197F0.034 0.184F0.022 Urine osmolality (mosM/kg H2O) 305.92F12.81 222.25F25.35* 348.50F9.52* 669.25F129.13 397.00F69.83*,** 499.50F36.54**
Plasma osmolality (mosM/kg H2O)
269.92F10.12 264.08F8.53 258.25F7.78 272.43F4.18 272.10F3.13 271.77F2.09
Potassium excretion (AEq/min) 3.31F0.33 4.01F0.48 1.46F0.14* 5.19F1.27 3.75F0.80 3.24F0.45** Sodium urine concentration (mEq/l) 86.50F3.69 82.50F7.48 128.50F5.00* 118.50F22.45 125.50F21.84** 149.25F24.11 Potassium urine
concentration (mEq/l)
34.63F2.43 13.88F1.59* 19.35F0.89* 55.25F10.85 25.75F3.15*,** 32.00F2.41*,**
Sodium plasma Concentration (mEq/l)
159.10F2.83 154.56F2.66* 150.02F2.88* 150.88F0.40** 148.13F0.77* 145.38F0.76*
Potassium plasma concentration (mEq/l)
3.52F0.23 3.31F0.13 3.10F0.11* 3.42F0.16 3.45F0.17 3.48F0.20
Data are meanFS.E. Sprague–Dawley Control,n=6; HOE-treated,n=5. * pb0.05, compared to the control period.
excretion in basal conditions. These changes were accom-panied by decreased potassium excretion and increased urinary osmolality. However, TGR (hKLK1) presented an increased creatinine clearance indicating an increased GFR. These data suggest that the decreased urine volume in TGR is due to an increased water reabsorption (reducedTcH2O) and decreased sodium excretion. These changes could not be attributed to an increase in plasma AVP or decreased plasma ANP suggesting that alterations in the responsiveness to these hormones may be present in these animals.
There are few reports in the literature dealing with possible interactions of kinins with ANP and AVP. Boric et al.[27] have reported that kinins can counteract the renal effects of ANP through an intra-renal B2 receptor dependent
mecha-nism. In disagreement with our data, Alfie et al. [28] described an enhanced AVP effect in bradykinin B2receptor
null mutant mice. However, conflicting results have been reported in bradykinin B2 receptor knockout mice [29] raising concerns about conclusions on the role of kinins in kidney function based on observation derived from these animals. Our binding data for ANP in kidney slices do not support a decreased density of ANP binding in TGR (hKLK1), suggesting that other factors such as imbalances in ANP signaling are responsible for the changes observed. In this regard, it has been described that human kallikrein can hydrolyze ANP, generating inactive fragments [30–32]. Accordingly, a likely explanation for our findings could be the ANP degradation by tissue kallikrein in the heart, kidney or possibly other tissues expressing the transgene. The smaller ANP plasma levels after acute volume expansion in TGRs are in keeping with this interpretation. Concerning AVP, the apparently decreased responsiveness could be due to changes in signal transduction pathways, decreased receptor density or both. These possibilities deserve future studies to be confirmed.
The fact that no macroscopic changes in kidney structure could be detected in TGR (hKLK1) (data not shown) and the partial reversal of the functional changes by HOE-140 treatment makes it different from the fact that morphological alterations are contributing to the decreased renal function in TG rats. It has been recently reported that bradykinin B2
receptor transgenic mice presented an enhanced renal function suggesting that our results could be due to downregulation of bradykinin B2 receptors induced by
elevated local kinin concentration [33]. However, our autoradiographic data do not support this possibility.
Marked differences in the response to HOE-140 were observed between SD and TG rats. Indeed, the effect of HOE-140 in the TGR was essentially opposite to that observed in SD rats. As expected, HOE-140 severely blunted the renal response to acute volume expansion in SD rats essentially suppressing the rise in water excretion and significantly decreasing the sodium excretion after volume overload. Conversely in TGR (hKLK1), pretreat-ment with HOE-140 partially reversed the impaired response to acute volume expansion especially if one
considers the fractional sodium and water excretion. Interestingly, a similar finding was obtained for Angioten-sin-(1–7) which decreased the renal response to volume expansion in SD and increased it in TGR (hKLK1) [18]. Although future studies are obviously needed to clarify these observations, the results obtained with HOE-140 clearly suggest an involvement of B2 receptor-related mechanism in the attenuated response of TGR (hKLK1) to acute volume expansion.
In summary, we showed that transgenic rats harboring the human tissue kallikrein gene have an impaired renal response to acute volume expansion, which cannot be ascribed to differences in blood pressure or GFR (higher in TGR) or expressive changes in plasma levels of hormones known to participate in this response, ANP and AVP.
Acknowledgments
We thank Jose´ Roberto Silva for his technical support and would like to acknowledge the Brazilian agencies, FINEP (PRONEX), CNPq, and CAPES for the financial support.
References
[1] Bhoola KD, Figueroa CD, Worthy K. Biorregulation of kinins, kallikreins, kininogens, and kininases. Pharmacol Rev 1992;44:1 – 80. [2] Figueroa CD, Gonzalez CB, Grigoriev S, AbbAlla SA, Haasemann M, Jarnagin K, et al. Probing for the bradykinin B2 receptor in rat kidney by antipeptide and anti-ligand antibodies. J Histochem Cytochem 1995;43:137 – 48.
[3] Dean R, Murone C, Lew RA, Zhuo J, Casley D, Muller-Esterl W, et al. Localization of bradykinin B2 binding sites in rat kidney following chronic ACE inhibitor treatment. Kidney Int 1997;52:1261 – 70. [4] Smith WL, Sonnenburg WK, Allen ML, Watanabe T, Zhu J, El-Harith
EA. The biosynthesis and actions of prostaglandins in the renal collecting tubule and thick ascending limb. Adv Exp Med Biol 1989;259:131 – 47.
[5] Boric MP, Croxatto HR. Inhibition of atrial natriuretic peptide excretory action by bradykinin. Hypertension 1995;26(part 2): 1167 – 72.
[6] Bader M, Ganten D. Transgenic rats: tools to study the function of the renin–angiotensin system. Clin Exp Pharmacol Physiol 1996; (Suppl. 3):S81.
[7] Borkowski JA, Ransom RW, Seabrook GR, Trumbauer M, Chen H, Hill RG, et al. Targeted disruption of a B2 bradykinin receptor gene in mice eliminates bradykinin action in smooth muscle and neurons. J Biol Chem 1995;270(23):13706 – 10.
[8] Pesquero JB, Arau´jo RC, Heppenstall PA, Stucky CL, Silva Jr JA, Walther T, et al. Hypoalgesia and altered inflammatory responses in mice lacking kinin B1 receptors. Proc Natl Acad Sci U S A 2000;97(14):8140 – 5.
[9] Madeddu P, Varoni MV, Palomba D, Emanueli C, Demontis MP, Glorioso N, et al. Cardiovascular phenotype of a mouse strain with disruption of bradykinin B2-receptor gene. Circulation 1997;96(10): 3570 – 8.
[11] Wang DZ, Chao L, Chao J. Hypotension in transgenic mice overexpressing human bradykinin B2 receptor. Hypertension 1997; 29(1 Pt. 2):488 – 93.
[12] Song Q, Chao J, Chao L. High level expression of human tissue kallikrein in the circulation induces hypotension in transgenic mice. Immunopharmacology 1996;32(1–3):105 – 7.
[13] Silva Jr JA, Araujo RC, Baltatu O, Oliveira SM, Tschope C, Fink E, et al. Reduced cardiac hypertrophy and altered blood pressure control in transgenic rats with the human tissue kallikrein gene. FASEB J 2000;14(13):1858 – 60.
[14] Chao J, Wang C, Chao L. Adenovirus-mediated gene transfer for cardiovascular and renal diseases. Methods Enzymol 2002;346: 247 – 63.
[15] Chao J, Jin L, Chen LM, Chen VC, Chao L. Systemic and portal vein delivery of human kallikrein gene reduces blood pressure in hyper-tensive rats. Hum Gene Ther 1996;20, 7(8):901 – 11.
[16] Yayama K, Wang C, Chao L, Chao J. Kallikrein gene delivery attenuates hypertension and cardiac hypertrophy and enhances renal function in Goldblatt hypertensive rats. Hypertension 1998;31(5): 1104 – 10.
[17] Chao J, Zhang JJ, Lin KF, Chao L. Human kallikrein gene delivery attenuates hypertension, cardiac hypertrophy, and renal injury in Dahl salt-sensitive rats. Hum Gene Ther 1998;9(1):21 – 31.
[18] Santos RAS, Passaglio KT, Pesquero JB, Bader M, Simo˜es e Silva AC. Interactions between angiotensin-(1–7), kinins, and angiotensin II in kidney and blood vessels. Hypertension 2001;38(Part 2):660 – 4. [19] Botelho LM, Block CH, Khosla MC, Santos RAS. Plasma
angio-tensin-(1–7) levels is increased by water deprivation, salt load and hemorrhage. Peptides 1994;15(4):723 – 9.
[20] Gutkowska J, Genest J, Thibault G, Garcia R, Larochelle P, Cusson JR, et al. Circulating forms and radioimmunoassay of atrial natriuretic factor. Endocrinol Metab Clin N Am 1987;16(1):183 – 98.
[21] Neves LAA, Almeida AP, Khosla MC, Santos RAS. Metabolism of angiotensin I in isolated rat hearts: effect of angiotensin converting inhibitors. Biochem Pharmacol 1995;50(9):1451 – 9.
[22] Jankowski M, Reis AM, Mukaddam-Daher S, Dam TV, Farookhi R, Gutkowska J. C-type natriuretic peptide and the guanylyl cyclase receptors in the rat ovary are modulated by the estrous cycle. Biol Reprod 1997;56:59 – 66.
[23] Dos Reis AM, Fujio N, Dam TV, Mukaddam-Daher S, Jankowski M, Tremblay J, et al. Characterization and distribution of natriuretic peptide receptors in the rat uterus. Endocrinology 1995;136:4247 – 53. [24] Quirion R, Dalpe M, Dam TV. Characterization and distribution of receptors for the atrial natriuretic peptides in mammalian brain. Proc Natl Acad Sci U S A 1986;83:174 – 8.
[25] Hall JM. Bradykinin receptors: pharmacological properties and biological roles. Pharmacol Ther 1992;56(2):131 – 90.
[26] Katori M, Majima M. The renal kallikrein–kinin system: its role as a safety valve for excess sodium intake, and its attenuation as a possible etiologic factor in salt-sensitive hypertension. Crit Rev Clin Lab Sci 2003;40(1):43 – 115.
[27] Boric MP, Bravo JA, Corbalan M, Vergara C, Roblero JS. Interactions between bradykinin and ANP in rat kidney in vitro: inhibition of natriuresis and modulation of medullary cyclic GMP. Biol Res 1998;31(3):281 – 9.
[28] Alfie ME, Alim S, Mehta D, Shesely EG, Carretero OA. An enhanced effect of arginine vasopressin in bradykinin B2 receptor null mutant mice. Hypertension 1999;33(6):1436 – 40.
[29] Milia AF, Gross V, Plehm R, De Silva JA, Bader M, Luft FC. Normal blood pressure and renal function in mice lacking the bradykinin B2 receptor. Hypertension 2001;37:1473 – 9.
[30] Shimizu H, Aono K, Masuta K, Asada H, Misaki A, Teraoka H. Degradation of human brain natriuretic peptide (BNP) by contact ac-tivation of blood coagulation system. Clin Chim Acta 2001;305(1–2): 181 – 6.
[31] Vanneste Y, Michel A, Deschodt-Lanckman M. Hydrolysis of intact and Cys-Phe-cleaved human atrial natriuretic peptide in vitro by human tissue kallikrein. Eur J Biochem 1991;196(2):281 – 6. [32] Vanneste Y, Pauwels S, Lambotte L, Michel A, Dimaline R,
Deschodt-Lanckman M. Respective roles of kallikrein and endopep-tidase 24.11 in the metabolic pathway of atrial natriuretic peptide in the rat. Biochem J 1990;269(3):801 – 6.


![Fig. 5. Autoradiography of [ 125 I]-ANP and [ 125 I]-Tyr-Bradykinin to Sprague–Dawley and TGR (hKLK1) rat kidneys](https://thumb-eu.123doks.com/thumbv2/123dok_br/15940981.678920/7.892.78.817.141.400/fig-autoradiography-anp-tyr-bradykinin-sprague-dawley-kidneys.webp)
