(Annals of the Brazilian Academy of Sciences) ISSN 0001-3765
www.scielo.br/aabc
Natural occurrence of hexavalent chromium in a sedimentary aquifer
in Urânia, State of São Paulo, Brazil
CHRISTINE BOUROTTE1, REGINALDO BERTOLO2, MARTA ALMODOVAR3 and RICARDO HIRATA4 1Instituto de Geociências, Universidade de São Paulo
Rua do Lago, 562, Cidade Universitária, 05508-080 São Paulo, SP, Brasil
2Instituto de Geociências, Universidade de São Paulo
Rua do Lago, 562, Cidade Universitária, 05508-080 São Paulo, SP, Brasil
3CETESB, Companhia de Tecnologia de Saneamento Ambiental do Estado de São Paulo
Av. Professor Frederico Hermann Jr., 345, Alto de Pinheiro, 05459-900 São Paulo, SP, Brasil
4Instituto de Geociências, Universidade de São Paulo
Rua do Lago, 562, Cidade Universitária, 05508-080 São Paulo, SP, Brasil
Manuscript received on August 6, 2008; accepted for publication on December 19, 2008; presented byALCIDESN. SIAL
ABSTRACT
Anomalous concentrations of hexavalent chromium have been detected in groundwater of the Adamantina Aquifer in at least 54 municipalities located in the northwestern region of the State of São Paulo, southeast Brazil, occasionally exceeding the permitted limit for human consumption (0.05 mg.L–1). An investigation was conducted in the munici-pality of Urânia, where the highest concentrations of chromium were detected regionally. It was defined that the origin of this contamination is natural, since high concentrations of chromium were detected in aquifer sandstones (average of 221 ppm) and also in pyroxenes (6000 ppm), one of the main heavy minerals found in the sediments. Besides, no other possible diffuse or point sources of contamination were observed in the study area. Stratification of groundwater quality was observed and the highest concentrations of Cr6+were detected at the base of the aquifer (0.12 mg.L–1), where groundwater shows elevated values for redox potential (472.5 mV) and pH (8.61). The origin of Cr6+in water may be associated with the weathering of pyroxene (augite), followed by the oxidation of Cr3+by manganese oxides. The highest concentrations of Cr6+ are probably related to desorption reactions, due to the anomalous alkaline pH found in groundwater at the base of the aquifer.
Key words:chromium, groundwater, aquifer, natural contamination.
INTRODUCTION
Chromium has been identified as a public health prob-lem due to its toxic effects even at low exposure lev-els (ATSDR 2000). In the environment, chromium ex-ists in two main oxidation states, Cr3+and Cr6+, which develop different geochemical and biological activities, since Cr3+is an essential metal nutrient and Cr6+is car-cinogenic. Cr6+ is more mobile, labile and toxic than Cr3+ and their distribution is regulated by redox
reac-Correspondence to: Reginaldo Bertolo E-mail: bertolo@igc.usp.br
tions in natural waters. Under acidic and reducing con-ditions, Cr3+ species will predominate in water, while Cr6+species will prevail under alkaline and mildly oxi-dizing conditions.
Con-centrations of naturally occurring hexavalent chromium have been reported in groundwater in the Aroma Red Sands Aquifer, California (Gonzalez et al. 2005), at Léon Valley, Mexico (Robles-Camacho and Armienta 2000), in the western Mojave Desert, California (Ball and Izbicki 2004) and Arizona (Robertson 1995).
Although the natural presence of chromium in aquifers is scarce and little studied, concentrations of chromium higher than the recommended value for drinking water (0.05 mg.L–1) have been known since 1977 in the Adamantina Aquifer (Almodovar and Pacheco 1995), located in the northwestern portion of the State of São Paulo. Water supplies in this region are primarily obtained via deep groundwater wells, most of which are managed by public water supply companies.
The main objective of this paper is that of charac-terizing the distribution of chromium species in ground-water of the Adamantina Aquifer and present the re-sults of an investigation performed in the municipality of Urânia (Fig. 1), where the highest concentrations were detected. The concentration of major ions and water quality parameters were also measured and their rela-tionship with chromium occurrence was considered, as well as the relationship between chemical species and well depth. The results shown in this paper are part of a wider study and some interpretations of the occurrence and distribution of chromium are also discussed.
STUDY AREA
GEOLOGICALSETTING
The study area is located in the Paraná Basin, which is a volcanic-sedimentary basin that covers virtually 1 million km2 in Brazil. More specifically, the study site is located in the western part of the Paulista Plateau, which covers 50% of the State of São Paulo. The parent rock consists of sedimentary rocks of the Bauru Basin (Upper Cretaceous age) and overlays basalts of the Serra Geral Formation (Jurassic-Cretaceous age).
The Bauru Basin covers an area of 104,000 km2 and 42% of the area of the State of São Paulo. Based on the conception of Fernandes and Coimbra (2000), the Bauru Basin has two chronocorrelated geological units, namely: the Caiuá and Bauru Groups. These two de-positional systems have been formed under semi-arid to desertic climate conditions, from the border to interior
portions of the basin. The Caiuá Group is subdivided into the Rio Paraná, Goio-Erê and Santo Anastácio For-mations, which are present in the western portion of the State of São Paulo. The Bauru Group, which is pre-dominant in the State of São Paulo, outcrops in oriental domains of the Basin and is subdivided into the Vale do Rio do Peixe, Araçatuba, São José do Rio Preto, Presi-dente PruPresi-dente and Marília Formations (Fig. 1).
In this context, sedimentary rocks of the Vale do Rio do Peixe Formation or, in other words, the Ada-mantina Formation conceived by Soares et al. (1980), outcrop in the municipality of Urânia. This stratigraphic unit is constituted of well-sorted fine to very fine sand-stones, interbedded with siltstones. Carbonate cemen-tation is found locally. The sandstones are disposed in submetric tabular layers of massive aspect, presenting zones of coarse tabular bedding and zones with tabu-lar and through cross-bedding.
Fernandes and Coimbra (2000) suggest that depo-sition of the Vale do Rio do Peixe Formation occurred primarily by eolic action in extensive plain-like areas and, secondarily, by occasional torrents, formingwadis
deposits. Finally, the authors suggest that the lower con-tact of the Vale do Rio do Peixe Formation is gradual with the Santo Anastácio Formation or, as occurs in the study area, discordant and directly on the basalts of the Serra Geral Formation.
Brandt Neto et al. (1985) indicate that the miner-alogy of the sediments is mainly composed of quartz and, secondarily, feldspars, kaolinite, montmorillonite, opaque minerals and carbonates as cement. The ori-gin of the sedimentary rocks is related to the deposi-tion of sediments caused by the erosion and transport of other phanerozoic sediments, metamorphic rocks of the Araxá and Canastra Groups, basalts of the under-lying Serra Geral Formation and alkaline rocks of the Triângulo Mineiro (A.M. Coimbra, unpublished data).
The average thickness of the Bauru Group is around 100 m. Greater thickness generally occurs on the crests of hills between the main rivers of the western portion of the State of São Paulo. In the Urânia region, the sed-imentary rocks were found to have a thickness of up to 160 m (Almodovar 2000).
re-Fig. 1 – Location of the study area and stratigraphy of Bauru Basin (modified from Fernandes and Coimbra 2000).
gion, the Serra Geral Formation has a thickness of be-tween 500 and 1500 m. In the Urânia region, deep sup-ply wells exploiting groundwater from the underlying Guarani Aquifer show basaltic rocks with a thickness of around 900 m.
HYDROGEOLOGICALSETTING
There are two main hydro-stratigraphic units in this re-gion, namely: the Bauru Aquifer System, which con-stitutes the main source of water supply, and the Serra Geral Aquifer, represented by basalts of the underly-ing Serra Geral Formation. The municipality of Urâ-nia is located in the context of the traditionally named Adamantina Aquifer, in concordance with designation of the Adamantina Formation by Soares et al. (1980).
The Adamantina Aquifer can be characterized as a granular and continuous unit, and shows an unconfined to semi-confined behavior. Its potentiometric surfaces are strongly influenced by the geomorphology of the
area, where groundwater divides coincide with the drain-age basins and the local effluent rivers correspond to the discharge areas of the aquifer (Hirata et al. 1997). This aquifer is a moderately permeable formation, with av-erage values of hydraulic conductivity and transmissiv-ity close to 1.0E-5 m/sec and 40 m2/day, respectively (DAEE 1976).
The Serra Geral Aquifer system is constituted by flood basalts and associated intrusive rocks. It is char-acterized as a fractured, unconfined to semi-confined, discontinued, anisotropic and heterogeneous aquifer.
The northwestern region of the State of São Paulo shows an average temperature of 20◦C and average
SAMPLING ANDANALYTICALMETHODS
Table I presents a summary of the groundwater sam-pling events from 1977 to 1999. Data from 144 deep supply wells located in 54 cities of the study area were initially obtained at a public water supply company. These data include in-situ and laboratory parameters ob-tained between 1977 and 1993. Fieldwork activities were then conducted in 12 localities in the region during December 1994, in order to complement the geograph-ical investigation of chromium distribution (Almodovar and Pacheco 1995).
From June 1998 to June 1999, groundwater sam-ples from 31 wells located in the municipality of Urânia were analyzed in order to assess variation of chromium concentrations with depth and pumping time. During sampling activities, water from public and private sup-ply wells was collected, together with water from hand-dug shallow supply wells. In order to evaluate varia-tion of chromium concentravaria-tions over a pumping period of 24 hours, a sampling program was performed dur-ing several pumpdur-ing intervals at two deep supply wells (PP02 and PP04).
Samples collected between 1977 and 1993 were obtained and analyzed by a public water supply com-pany. Little information is available regarding sampling techniques, sample preservation and analytical methods. Samples collected between 1994 and 1999 were obtained at the nearest tap, located prior to the water tank. All wells were equipped with electric pumps. These samples were split and an aliquot for determina-tion of cadetermina-tions and metals was filtered through a 0.45µm-pore filter and acidified with ultrapure HNO3to pH<2.0. The aliquot for anion determination was just
stored at a temperature of 4◦C until analysis.
Measurements of pH, Eh, EC, Cr6+ and alkalinity of water samples were performed in the field. Alka-linity analysis was performed by titration with H2SO4 using an end-point based on the Gran plot (Appelo and Postma 1993). Analytical methods for chemical species quantified in the sampled groundwater are summarized in Table II.
In performing chemical analyses, QA/QC proce-dures included the analysis of blanks, spikes and du-plicate samples, which indicated favorable results, and by checking ion balances, which showed errors for the
analyses generally within ±10%. Saturation indexes of calcite and dolomite were calculated using PhreeqC (Parkhurst and Appelo 1999).
RESULTS AND DISCUSSION
REGIONALDISTRIBUTION OFTOTALCHROMIUM ANDCR6+
A general assessment of total and hexavalent chromium concentrations in groundwater was conducted in the Northwestern region of the State of São Paulo based on existing data gathered between 1977 and 1993 (Almo-dovar and Pacheco 1995). Total chromium is distributed in various municipalities and districts of the region. In some localities, concentrations are lower than or equal to the potability limit (0.05 mg.L–1), whereas in many others concentrations vary from this limit up to 0.155 mg.L–1.
Table III shows a summary of basic statistics re-garding chromium concentrations detected in ground-water at various localities during this period. Figure 2 shows a regional map with indication of the concen-trations of total and hexavalent chromium obtained in groundwater in the study region.
Around 39% of all available analyses showed con-centrations of chromium higher than (or equal to) the potability limit. The values showed a great degree of variation between different localities in the region and a clear distribution pattern could not be obtained. How-ever, comparing the concentrations found in wells in-stalled in the Adamantina and Serra Geral aquifers, it was observed that the highest concentrations of total chromium occurred in groundwater from the Adaman-tina Aquifer. Concentrations varied between 0.005 and 0.155 mg.L–1, with the highest concentrations in the municipality of Urânia, whereas concentrations varied from 0.006 to 0.018 mg.L–1in basalts of the Serra Geral Aquifer.
NATURAL VERSUSANTHROPICSOURCES
Anthropic processes and natural sources can be consid-ered as possibilities for assessing the origin of chromium concentrations in groundwater. The Urânia region, a small town of approximately 10,000 inhabitants, was chosen for a detailed assessment of these possibilities.
resid-TABLE I
Characteristics of groundwater sampling events from 1977 to 1999.
Sampling date/
Source Locality Type/Number Parameters forin situanalysis Parameters for laboratory analysis
1977-1993
(public water supply company)
Data from 144 wells in 54 cities
2 shallow wells 121 deep wells
Electrical Conductivity (EC) Crtot, Cr6+, NO−3
December 1994
(Almodovar and Pacheco 1995)
12 localities 1 shallow well 24 deep wells
Air and watPb2+, er temperatures, pH, EC, total dissolved solids
Cr6+
March 1995
(Almodovar and Pacheco 1995)
Urânia Santa Salete
P2, P4 and P5 wells P1 well
Air and water temperatures, pH, EC, Eh, total dissolved solids
Na+, K+, SiO
2, Crtot, Cr6+,
SO2−4 , F−, Fetot, Mn2+, Al3+,
NO− 3, HCO−3
January 1995
(Almodovar and Pacheco 1995)
Urânia P9 well Air and water temperatures, pH, EC, Eh, total dissolved solids
Cl−, SO2−
4 , Ca2+, Mg2+, Fetot,
Al3+, Crtot
Four rounds of sampling (one in each season) from June 1998 to June 1999
Urânia 14 shallow hand-dug wells and 17 deep supply wells PP02 and PP04 for study of chromium concentrations with pumping time
Air and water temperatures, pH, EC, Eh, O2, Cr6+, Alkalinity
Ag+, Al3+, Ba2+, Br−, Ca2+,
Cd2+, Cl−, Crtot, Cu2+, Fetot,
F−, K+, Mg2+, Mn2+, Na+,
Ni2+, NO−
2, NO−3, Pb2+, PO3−4 ,
SO2−4 , Sr2+, Zn2+
TABLE II
Analytical methods used during sampling events from 1994 to 1999.
Chemical species Analytical method
Cr6+ Colorimetry – Aquaquant
1.14402 MERCK Al3+, Ag+, Ba2+, Ca2+,
Cd2+, Cr
tot, Cu2+, Fetot,
Mg2+, Mn2+, Ni2+,
Pb2+, Sr2+, Zn2+
Atomic Absorption Spectrophotometry
K+, Na+ Flame photometry
Cl−, Br−,F−, SO2−
4 ,
NO−
3, NO−2, PO34−
Ion Chromatography (DIONEX 2010i)
TABLE III
Concentrations of chromium detected in 144 wells from 1977 to 1993 (Almodovar and Pacheco 1995).
N Samples Mean Standard Error Minimum Maximum
mg.L−1
Cr total 266 0.048 0.07 0.005 0.9
Fig. 2 – Distribution of chromium concentrations in space (modified from Almodovar and Pacheco 1995).
ential or agricultural areas. Agriculture is the main eco-nomic activity in the area, primarily fruit cultivation (grape and pineapple) and small-scale cattle farming. Thus, the application of fertilizers and pesticides could possibly be a significant diffuse source of the chromium found in the aquifer. The chemical composition of fer-tilizers and pesticides commonly used in the Urânia area was then checked and no significant concentration of chromium was present.
Point sources of contamination, like steelworks, electroplating, leather tanning and chemical manufactur-ing, were not found to be present in the study area. Only small industries are present, such as rice processing and furniture manufacturing, which do not show an associ-ated contaminant load of chromium. Besides this, these types of point sources of contamination would gener-ate contamination plumes with limited and defined geo-metry, which is not the widespread pattern of chromium contamination that has been observed.
Thus, there was no evidence of an anthropic source
of chromium contamination in the study area, which reinforced the hypothesis of natural origin in the case of this contamination. This hypothesis was confirmed by Marcolan and Bertolo (2007), through chemical and mineralogical analysis using X-ray fluorescence, X-ray diffraction and scanning electron microscopy (SEM-EDS) on borehole samples collected from the top to the base of the aquifer in Urânia. The results of this investigation indicated that:
(i) the concentration of chromium in sandstones is anomalous, with average and maximum values of 221 and 336 ppm, respectively, which are signifi-cantly higher than the reported average concentra-tion in a generic sandstone (35 mg/kg) and soils from another regions in the State of São Paulo (26.3 mg/kg);
(iii) chromium concentrations in clay minerals and iron hydroxides are also relatively high (up to 650 ppm).
HYDROGEOCHEMICALSTUDY INTOWN OFURÂNIA
Conceptual model
The geological and hydrogeological features of the Adamantina Aquifer in Urânia are quite similar to those described for the aquifer regionally. The aquifer is un-confined to semi-un-confined, constituted of well-sorted fine to very fine sandstones with carbonate cementation, relatively homogeneous and isotropic in the scale of study, and with a thickness varying from 66 to 165 m. The urban area of Urânia is located on the crest of a smooth hill, which corresponds to the local aquifer groundwater divide.
Groundwater flow lines that originate in this area converge to the Comprido Creek, which is considered as the main discharge area of the aquifer locally (Fig-ure 3). The hydraulic gradient varies from 0.011 to 0.025 and the advective flow velocity of groundwater ranges from 20 to 400 m/year. Pumping tests showed a hydraulic conductivity value of 8.54E-6 m/sec (F.A. Cagnon, unpublished data).
Three classes of supply wells were registered in Urânia, each representing conditions at a specific depth in the aquifer: private hand-dug wells (14), private 4" wells (10) and public 6" wells (7). In general, the pri-vate hand-dug wells (shallow wells) have a diameter of 1.2 m and reach an average depth of 11 m, being characteristic of the shallow part of the aquifer, where a local groundwater flow system with a shorter transit time predominates. The private 4" wells (intermediate wells) pump groundwater from intermediate depths in the aquifer, show an average depth of 57 m and are com-monly cased with 4" tubes to a depth of 20 m. The pub-lic 6" wells (deep wells) extend to depths varying from 75 to 160 m and usually reach the top of basalts that comprise the Serra Geral Formation. These wells are continuously cased with 6" tubes and filters that are in-stalled from the intermediate to deep intervals of the aquifer. This situation might result in mixture of water from these layers. A regional system of groundwater flow predominates in the deep parts of the aquifer, with a longer transit time.
Potentiometric levels obtained from the set of wells
indicate the occurrence of downward flow potential in the urban area and upward flow potential in the area of the Comprido Creek, which is confirmed by nearby well PP05, where results showed conditions of artesianism controlled by topography.
Three hydrochemical zones were identified in the Adamantina Aquifer in Urânia that are in accordance with the depths of the studied wells. The first hydro-chemical zone is the Shallow Zone (up to 30 m), associ-ated with the private hand-dug wells (shallow wells) and exhibiting Na-Ca-Cl-NO3facies (Figure 3). The Inter-mediate Zone (30–70 m) is associated with the private 4" wells (intermediate wells) and shows Ca-HCO3 facies. The Deep Zone (>70 m) is associated with the public
6" wells (deep wells) and shows Na-Ca-HCO3facies. Table IV shows the results of a statistical evalua-tion performed on the analytical results of water sam-ples collected from shallow, intermediate and deep wells during four rounds of monitoring activities performed between June 1998 and June 1999. Elevated values of standard deviation were advective obtained for Crtotal, Cr6+, Fe
total, Mn2+ and SO24−, indicating that the calcu-lated mean value is not representative for the aquifer. In general, an anomalous high concentration of these parameters detected in a sample resulted in a tendency for elevation of the mean value.
Table IV also shows the average chemical composi-tion of water from well PP04, which may better represent hydrochemical conditions existing in the deep aquifer, below intermediate depths, as it is solely screened at the base of the aquifer. As mentioned previously, the pub-lic 6" wells are frequently screened from intermediate depths to the base of the aquifer. As a result, the concen-trations shown for water from these wells may in fact be considered as representative of a mixture of water from these depths.
From shallow to deep groundwater zones, the re-sults showed an increase in pH and HCO3−
concentra-tions and a decrease in electrical conductivity (EC), in-dicating a drop in salinity. Eh also decreased, but values indicate oxidizing conditions for the aquifer. Compar-ing the three groundwater categories, concentrations of Na+, K+, Ba2+, Cl–, and NO
3− are higher in the shallow
con-Fig. 3 – Conceptual hydrogeological and hydrogeochemical model of the Adamantina Aquifer in Urânia.
centrations of HCO3−, Na+, F–, and Cr6+are higher in
the deep aquifer.
Comparing the mean values obtained for water samples collected in the different aquifer zones, NO3−
and Cl– concentrations in shallow groundwater are 5 and 8 times higher than in deep groundwater, respec-tively. At shallow depths, nitrate concentrations exceed the drinking-water potability value of 45 mg.L–1 and gradually decrease with depth. The occurrence of ni-trate in the proximity of the surface can be attributed to the organic charge of septic systems and/or fertilizer use. Its decrease, together with the decrease of EC (salinity), Cl–and Na+, can be attributed to contaminant dispersion and dilution processes. The sample collected from well PP04, which better represents hydrochemical conditions in the deep and unpolluted aquifer, shows very low ni-trate content.
Water-rock interaction is better observed through
such parameters as pH, HCO3−, Na+, Ca2+ and Mg2+.
Increase in pH and HCO3−concentrations from the top
to the base of the aquifer controls the solubility of cal-cite and dolomite minerals (reaction 1), which exhibit increasing saturation values, until their saturation at the base of the aquifer (Table IV).
CaCO3+H+=Ca2++HCO3− (1)
In addition, there is substantial enrichment of Na+ in the aquifer relative to Cl–. The shallow and intermedi-ate depths of the aquifer show a Na/Cl molar ratio of 1.2, which increases to 46.3 in the deep aquifer, thus in-dicating that the rock is providing the water with Na+. The increase in Na+, followed by a decrease in Ca2+and Mg2+concentrations and Ca2+/HCO
3−molar ratios,
sug-gests the occurrence of a cation exchange reaction in the deeper parts of the aquifer (reaction 2).
TABLE IV
Summary of analytical data of groundwater in shallow, intermediate and deep wells studied in the municipality of Urânia (four rounds of sampling from June 1998 to June 1999).
Shallow wells Intermediate wells Deep wells
N wells 14 10 7 PP04
Parameter Unit Mean Std. Min. Max. Mean Std. Min. Max. Mean Std. Min. Max.
Depth m 11.4 4.5 5.2 18.0 57.1 17.5 40.0 100.0 130.6 30.8 75.0 160.0 109.2
Temperature ◦C 25.5 3.0 19.9 30.5 26.3 1.9 22.9 30.1 25.9 2.6 21.5 29.7 25.9 Conductivity µS/cm 273.8 100.5 130.0 499.0 205.0 59.6 93.3 272.0 185.1 49.2 119.7 268.5 174.2
Ph 5.78 0.43 5.03 6.45 6.55 0.54 5.42 7.08 7.40 1.03 6.09 8.90 8.61
Eh mV 525.3 29.9 460.7 569.0 494.6 12.3 474.0 513.7 474.0 26.7 443.0 525.3 472.5 O2 mg.L−1 3.45 1.12 1.54 5.60 4.52 1.11 2.01 6.31 3.79 0.54 3.19 4.59 3.19 Cr total mg.L−1 0.006 0.003 <0.005 0.013 0.013 0.006 0.005 0.025 0.051 0.045 0.013 0.12 0.120
Cr6+ mg.L−1 0.002 0.003 <0.005 0.010 0.013 0.008 0.005 0.025 0.044 0.042 0.010 0.12 0.120
Na+ mg.L−1 18.29 10.20 3.60 31.00 5.35 3.130 2.60 13.30 12.42 12.61 1.98 32.00 27.00 K+ mg.L−1 5.94 1.76 2.30 8.90 3.90 1.140 2.60 6.27 3.170 2.55 0.30 7.77 0.44 Ca2+ mg.L−1 17.73 9.82 6.52 40.50 21.04 9.620 7.73 38.05 15.64 10.55 4.30 35.20 7.18 Mg2+ mg.L−1 6.36 3.09 1.30 13.65 7.34 2.600 3.25 11.00 4.46 3.16 0.35 9.20 1.88 Ba2+ mg.L−1 0.30 0.16 0.08 0.77 0.22 0.100 0.08 0.42 0.15 0.10 0.03 0.35 0.03 Sr2+ mg.L−1 0.16 0.08 0.06 0.33 0.16 0.090 0.03 0.31 0.25 0.21 0.07 0.58 0.15 HCO−
3 mg.L−1 23.31 14.90 6.10 51.85 85.30 58.90 15.25 183.0 90.52 40.99 40.41 154.0 105.2 CO−
3 mg.L−1 – – – – – – – – – – 9.00 15.00 9.00
Cl− mg.L−1 22.19 13.06 5.73 45.58 6.65 6.470 0.36 22.12 2.66 1.39 0.89 4.09 0.90 SO2−
4 mg.L−1 0.69 0.67 0.180 2.46 0.28 0.512 0.01 1.72 0.16 0.075 0.08 0.26 0.14
NO−
3 mg.L−1 78.79 31.80 37.29 161.8 34.73 24.54 1.46 69.18 15.14 12.74 0.08 35.15 0.37 PO3−
4 mg.L−1 0.08 0.04 0.04 0.18 0.12 0.100 0.01 0.30 0.11 0.11 0.03 0.36 0.03 F− mg.L−1 0.08 0.04 0.03 0.16 0.12 0.060 0.03 0.20 0.14 0.035 0.08 0.19 0.15 Fe total mg.L−1 0.03 0.03 <0.01 0.09 0.02 0.030 <0.01 0.07 0.025 0.017 0.01 0.05 <0.01
Mn2+ mg.L−1 0.07 0.09 0.01 0.31 0.01 0.010 <0.01 0.04 0.01 0.02 <0.01 0.05 <0.01
Sat.Ind.**
–3.09 –1.65 +0.09
Calcite Sat.Ind.
–6.09 –3.23 +0.12
Dolomite
(1) N wells = number of wells; Std.: standard deviation; Min.: minimum; Max.: maximum; Sat.Ind. = saturation index. (2) Concentrations in italic and lower case highlight elevated values of standard deviation, indicating that the mean value is not a representative figure.
Reaction 2 decreases Ca2+ concentration and seems to control the dissolution of carbonate minerals, driving re-action 1 to the right, increasing the pH and HCO3−
con-centration. Table V summarizes the hydrogeochemical processes identified in the aquifer.
Behavior of chromium concentrations
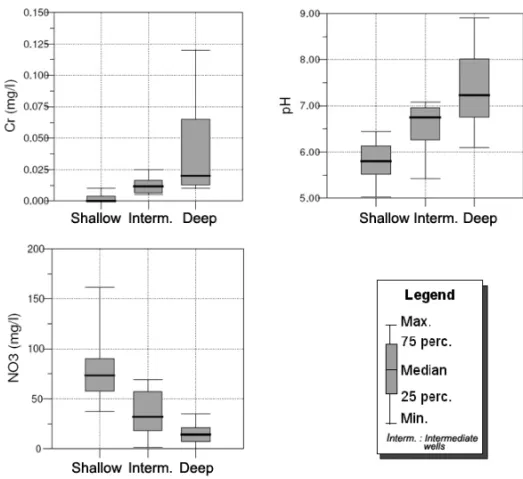
Chromium concentrations also showed distinct behav-ior at different depths in the aquifer (Fig. 4), with an increase from the shallow to deep zones (Table IV). Ten of the 14 shallow wells showed non-detected concentra-tions of chromium, whereas the remaining wells showed low concentrations (maximum of 0.013 mg.L–1). Chro-mium was detected in all 10 intermediate wells, although
at low concentrations, ranging from the detection limit to 0.025 mg.L–1. All deep wells showed the detection of chromium at concentrations that were generally higher than those found at intermediate depths. Three of the 7 samples showed concentrations exceeding the potability limit (0.05 mg.L–1).
TABLE V
Summary of hydrogeochemical processes identified in the 3 different hydraulic zones studied.
Shallow aquifer Intermediate aquifer Deep aquifer Environment Acidic waters under
oxidizing conditions
Acidic to neutral waters under oxidizing conditions
Alkaline waters under oxidizing conditions
Water type Na-Ca-Cl-NO3 Ca-HCO3 Na-Ca-HCO3
Cations Na+and Ca2+>Mg2+
and K+
↑Ca2+and Mg2+
↓Na+and K+
↑Na+
↓K+, Ca2+e Mg2+
Anions NO−
3 >HCO−3 and Cl− ↑HCO−3
↓NO−3 and Cl−
↑HCO− 3
↓↓NO−3 and Cl−
Molar ratios (meq.L−1/ meq.L−1)
Na+/Cl−= 1.2
Ca2+/HCO− 3 = 2.3
Na+/Cl−= 1.2
Ca2+/HCO− 3 = 0.7
Na+/Cl−= 46.3
Ca2+/HCO− 3 = 0.4
Geochemical processes – Major constituents
Low pH and most of the Na+,
NO−
3 and Cl−concentrations are
attributed to contamination by septic systems and/or fertilizer use. Conditions for dissolution of carbonate minerals.
Hydraulic dispersion of the contaminants. Dissolution of carbonate minerals, increasing pH and Ca2+and HCO−
3
concentrations.
Cation exchange of Na+by
Ca2+and Mg2+. Dissolution of carbonate minerals up to their solubility limits. Dissolution of carbonate minerals affected by cation exchange reaction, increasing pH and HCO−
3
concentrations. Chromium Low to very low
concentrations (usually non-detect);
Cr3+predominant. Mn2+usually detected.
Low concentrations (max. 0.025 mg.L−1); Cr6+predominant.
Moderate to high concentrations (max. 0.120 mg.L−1); Cr6+predominant;
(+) correlation with pH, Na+
and total alkalinity; (–) correlation with NO−
3.
Mn2+usually not detected. Possible
geochemical processes – Chromium
Pyroxene weathering; Cr3+cations predominate in the form of hydroxides and/or adsorbed onto clay/ hydroxides minerals; Possible reduction of Cr6+ into Cr3+by organic matter,
NH+
4, NO−2 and/or Fe2+.
Possible pyroxene weathering; Oxidation of Cr3+to Cr6+ by MnO2;
Adsorption of Cr6+anions by Al and Fe hydroxides.
Oxidation of Cr3+to Cr6+ by MnO2;
Increased pH and presence of competing anions cause desorption and mobilization of Cr6+anions.
↑or↓: elevation or decrease of concentrations in respect to the previous shallower aquifer level.
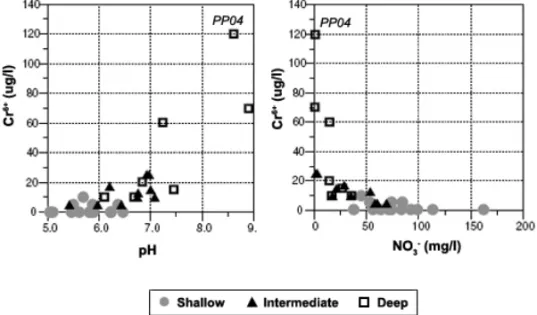
Correlation coefficients between chromium and the other chemical components were obtained. Except for significant correlations of Cr with pH (R = 0.80) and NO3−(R = –0.61) (Fig. 5), no statistically linear or
in-verse relationships were found in comparing chromium with other chemical species or physical parameters. As suggested in Figure 4, pH, Cr6+and NO
3− box plots
showed different patterns between shallow, intermedi-ate and deep wells.
Solely considering data regarding intermediate and deep wells, in order to reduce the main influence of cesspit contamination observed in the shallow aquifer,
a correlation between Cr6+and pH, NO
3−, Na+and total
alkalinity has been observed (Fig. 5). The highest con-centrations of chromium were observed in three deep wells (PP04 included), where the highest values of pH, Na+and total alkalinity were found, as well as the low-est concentrations of NO3−.
Fig. 4 – Box plots showing a comparison of chromium, pH and nitrate distribution for groundwater samples from shallow, intermediate and deep wells.
Sampling throughout different pumping intervals was performed over a 24-hours period with a constant flow rate in the public 6" wells (deep wells) PP02 and PP04. Samples were collected at 15 min, and then at 1, 6, 12, 18 and 24 h after the start of pumping. The results indicate that pH values and Cr6+and Na+concentrations increase in both deep wells over the pumping period, whereas NO3−concentrations decrease (Fig. 6).
Given that the characteristics of the aquifer are sidered to be of the unconfined to semiconfined type, con-tinuous pumping allows for the capture of deeper flows in the aquifer, represented by older waters that have been subject to a longer period of water-rock interaction. The observed relationships between Cr6+, pH, Na+and NO
3−
during this experiment are in accordance with the corre-lations observed in Figure 5.
Possible geochemical reactions involving chromium
Aqueous concentrations of chromium are dependent upon the chemistry of trivalent and hexavalent chromium species and are controlled by processes such as the precipitation/dissolution of chromium minerals, redox
transformation of Cr3+/Cr6+ and adsorption/desorption of Cr3+/Cr6+onto mineral surfaces.
According to Richard and Bourg (1991), Cr6+ min-erals are very scarce in nature and amorphous [Fe3+, Cr3+] hydroxide is probably the main phase controlling chromium solubility in natural environments. However, the chemical and mineralogical analyses conducted in this investigation indicated high concentrations of chro-mium in sandstones (average of 221 ppm), and espe-cially in pyroxene (augite) crystals (6000 ppm), which is one of the main heavy minerals found in the sandstone. Pyroxene is one of the most reactive minerals in weath-ering processes, according to the Goldich stability series (Kehew 2001), thus, this mineral may be considered as the main source of chromium found in water. However, chromium occurs as Cr3+ in pyroxenes and a redox re-action must take place to make Cr6+available and found in groundwater.
Fig. 5 – Relationship between hexavalent chromium concentrations and pH, nitrate, alkalinity and sodium concentrations.
of Cr3+ into Cr6+ at pH values greater than 9 (Fendorf and Zasoski 1992), however, according to Richard and Bourg (1991), the rate of oxidation is very slow and en-ables Cr3+to be involved in faster concurrent reactions, like sorption or precipitation. Considering that the res-idence time of water in aquifers may reach thousands of years and pH values are quite elevated in the deep aquifer, the possibility cannot be neglected that this re-action may occur.
However, manganese oxides, generally present as grain coatings, crack deposits or finely disseminated grains, are known to be the main agent responsible for
the oxidation of Cr3+ to Cr6+ in aquifers (Apte et al. 2006, Sedlak and Chan 1997, Richard and Bourg 1991, Eary and Rai 1987, Fendorf and Zazoski 1992, Fendorf 1995, Bartlett and James 1979).
Cr3++1.5MnivO
2(s)+H2O
=HCrO4−+1.5Mn2++H+
(3)
Fig. 6 – Variation of pH values and chromium, nitrate and sodium concentrations throughout pumping period.
the deep aquifer, where Cr6+ concentrations are higher. However, any Mn2+formed during Cr3+ oxidation will be converted back to MnO2in the presence of dissolved oxygen (Apte et al. 2006), which is observed in all depths in the aquifer in Urânia. In fact, chromium and manganese form a pair of chemical elements of oppo-site tendencies, since, under oxidizing conditions, Cr6+ is soluble as CrO2−
4 and Mn4+is present as MnO2; under reducing conditions, Cr3+ is removed from solution as Cr(OH)3and Mn2+is soluble (Richard and Bourg 1991). The same relationship (inverse correlation between Cr6+ and Mn2+) has also been observed by Gonzalez et al. (2005) in the Aroma Red Sands Aquifer in California.
In the shallow aquifer, more acidified waters con-tribute to more intensive weathering of pyroxenes, and Cr3+ rapidly precipitates as hydroxides or is adsorbed by Fe and Mn hydroxides (Richard and Bourg 1991). Part of the possible Cr6+produced in the shallow aquifer might be reduced back to Cr3+by organic matter (amino-acids and humic or fulvic (amino-acids) or by Fe2+ oxidation, which are fast reactions. Nitrification processes, which convert ammonium to nitrate, acidify waters and may also contribute to the immobilization of Cr3+ (Charlet and Manceau 1992, Rai et al. 1989).
immobilized by adsorption to clay minerals (low pHzpc minerals), a process that increases with pH (Richard and Bourg 1991).
Due to its anionic nature, Cr6+is preferentially re-tained on positively charged surfaces, for example, Al and Fe hydroxides (high pHzpcminerals), principally in more acidic conditions. In addition, most of the Cr6+ produced by Cr3+ oxidation reactions may be adsorbed by these minerals in the intermediate and deep portions of the aquifer.
However, adsorption of Cr6+ to minerals strongly decreases in the alkaline pH range and in the presence of other competing anions, increasing its mobility (Rai et al. 1989, Zachara et al. 1987). This may be the most probable phenomenon occurring in the deep aquifer, since the anomalous increase in pH, probably driven by cation exchange reactions involving Na+, Ca2+and Mg2+ and by the dissolution of carbonate minerals up to their solubility limits (reactions 1 and 2), is likely causing the desorption of Cr6+ anions to the aquifer. Table V summarizes possible geochemical processes involving chromium in the different parts of the aquifer.
CONCLUSIONS
Chromium is found in groundwater of the Adamantina Aquifer, at concentrations often exceeding the estab-lished potability limit (0.05 mg.L–1), in an extensive area covering at least 54 municipalities located in the north-western region of the State of São Paulo. An investi-gation conducted in the municipality of Urânia, where the highest concentrations were found, indicated that the origin of this contamination is natural, since elevated concentrations of chromium were detected in sandstones (average of 221 ppm) and especially in the mineral augite (6000 ppm), which is the main heavy mineral found in the sandstone. Besides this, no possible diffuse or point sources of contamination were observed in the study area. The results obtained for Urânia are good indica-tion that the chromium found in groundwater regionally may have the same origin.
The distribution of chromium concentrations in the different hydrochemical and hydraulic zones of the aquifer in Urânia clearly shows that the highest con-centrations originate in the deeper aquifer levels, where groundwater is older, the rock-water interaction is longer
and hydrochemical conditions allow chromium release into aqueous solution. In most of the groundwater sam-ples collected from the shallow wells, chromium has not been detected or observed concentrations are very low. The distribution pattern of these concentrations also re-inforces the hypothesis that the origin of chromium is natural. Dissolved chromium is essentially present in its hexavalent form, especially at the intermediate and deep levels of the aquifer.
The origin of Cr6+seems to be associated with the weathering of Cr-minerals, such as the Cr-augite identi-fied, followed by the redox transformation of Cr3+into Cr6+by another redox couple, for example, H
2O/O2(aq.) or Mn2+/Mn4+. According to many authors, manganese oxides are most likely responsible for Cr3+ oxidation. The processes of adsorption/desorption of Cr6+probably represent important reactions, since the highest Cr6+ con-centrations are found in the deep aquifer, where ground-water pH is more alkaline, which is a condition neces-sary for the desorption of Cr6+. This phenomenon may be occurring in the deep aquifer, where cation exchange reactions are driving the dissolution of carbonate miner-als, causing an anomalous increase in pH. Complemen-tary field and laboratory studies are now being conducted in order to confirm the occurrence of such geochemical processes responsible for the presence of chromium in groundwater.
ACKNOWLEDGMENTS
The authors are indebted to Fundação de Amparo à Pes-quisa do Estado de São Paulo (FAPESP) for financial support of the project (processes 97/13879-6, 98/15340-0 and 98/15340-05/698/15340-0598/15340-02-3). Bourotte has received a post-doc-toral grant from Conselho Nacional de Desenvolvimento Científico e Tecnológico (CNPq) (No. 154492/2006-0).
RESUMO
como natural, pois foram detectadas concentrações de cromo nos arenitos do aqüífero (média 221 ppm) e em piroxênios (6000 ppm), um dos principais minerais pesados encontra-dos nos sedimentos. Além disso, não foram observadas ou-tras possíveis fontes de contaminação difusas ou pontuais na área de estudo. Uma estratificação da qualidade da água no aqüífero foi observada e as mais elevadas concentrações de Cr6+foram detectadas na base do aqüífero (0,12 mg.L–1), onde as águas subterrâneas apresentam valores elevados de poten-cial redox (Eh = 472,5 mV) e de pH (8,61). A origem do Cr6+ na água deve estar associada com o intemperismo do piroxênio (augita), seguida da oxidação do Cr3+ pelos óxidos de man-ganês. As maiores concentrações de Cr6+estão provavelmente ligadas com reações de desorção, devido ao pH anomalamente alcalino da água subterrânea na base do aqüífero.
Palavras-chave:cromo, água subterrânea, aqüífero,
contami-nação natural.
REFERENCES
ALMODOVARMLN. 2000. A origem natural da poluição por cromo no Aqüífero Adamantina, município de Urânia, São Paulo, (In Portuguese – The origin of natural pollution by chromium in the Adamantina Aquifer, Urânia munici-pality, São Paulo), Ph.D. thesis, Institute of Geosciences, University of São Paulo, 199 p.
ALMODOVARMLNANDPACHECOA. 1995. Anomalia de Cromo nas Águas Subterrâneas de Urânia no Noroeste do Estado de São Paulo. Boletim IG-USP: Série Científica 26: 1–12.
APPELOCAJANDPOSTMAD.1993. Geochemistry, Ground-water and Pollution. Taylor and Francis Books, London, 649 p.
APTEAD, TAREVANDBOSEP. 2006. Extent of oxidation of Cr(III) to Cr(VI) under various conditions pertaining to natural environment. J Hazard Mater B128: 164–174. ATSDR. 2000. Toxicological profile for Chromium. Agency
for Toxic Substances and Disease Registry, U.S. Depart-ment of Health and Human Services, 461 p.
BALLJWANDIZBICKIJA. 2004. Occurrence of hexavalent chromium in ground water in the wester Mojave Desert, California. Appl Geochem 19: 1123–1135.
BARTLETTRJANDJAMESB. 1979. Behavior of chromium in soils: III. Oxidation. J Environ Qual 8: 31–35.
BRANDT NETO M, PETRI S AND COIMBRA AM. 1985.
Argilominerais do Grupo Bauru: considerações genéticas. In: SIMPÓSIOREGIONAL DEGEOLOGIA, 5, São Paulo. Atas. São Paulo, SBG – Núcleo São Paulo 1: 61–74.
CHARLETLANDMANCEAUAA. 1992. X-Ray absorption spectroscopic study of the sorption of Cr3+at the oxide-water interface II. Adsorption, coprecipitation and surface precipitation on hydrous ferric oxide. J Colloid Interface Sci 148: 443–458.
DAEE – DEPARTAMENTO DEÁGUAS EENERGIA ELÉTRI-CA. 1976. Estudo de Águas Subterrâneas. Região Admin-istrativa 7, 8 e 9, Bauru, São José do Rio Preto e Araçatuba. 4v. São Paulo, Brasil.
EARY LE AND RAI D. 1987. Kinetics of Chromium(III) oxidation to Chromium(VI) by reaction with manganese dioxide. Environ Sci Technol 21: 1187–1193.
FENDORFSE. 1995. Surface reactions of chromium in soils and waters. Geoderma 67: 55–71.
FENDORFSEANDZASOSKIRJ. 1992. Chromium(III) oxi-dation byδ-MnO21. Characterization. Environ Sci
Tech-nol 26: 79–85.
FERNANDESLAANDCOIMBRAAM. 2000. Revisão estrati-gráfica da parte oriental da Bacia Bauru (Neocretáceo). Rev bras Geocienc 30: 723–734.
GONZALEZAR, NDUNDUKANDFLEGALAR. 2005. Nat-ural occurrence of hexavalent chromium in the Aromas Red Sands Aquifer, California. Environ Sci Technol 39: 5505–5511.
HIRATAR, BASTOSC.ANDROCHAG. 1997. Mapeamento da vulnerabilidade a poluição dos aqüíferos do Estado de São Paulo. Secretaria do Meio Ambiente do Estado de São Paulo. São Paulo, 2v.
KEHEWAE. 2001. Applied chemical hydrogeology. Pren-tice-Hall. 368 p.
MARCOLANLANDBERTOLOR. 2007. Anomalias Geoquí-micas de Cromo em Arenitos da Formação Adamantina em Urânia – SP. XI Congresso Brasileiro de Geoquímica. Atas, CD, 4 p.
PARKHURSTDLANDAPPELOAAJ. 1999. User’s guide do PHREEQC (version 2) – A computer program for speci-ation, batch-reaction, one dimensional transport and in-verse geochemical modeling. US Geol. Survey, Water-resource Invest.
RAID, EARYLEANDZACHARAJM. 1989. Environmental chemistry of chromium. Sci Total Environ 86: 15–23. RICHARDFCANDBOURGACM. 1991. Aqueous
geochem-istry of chromium: a review. Water Res 25: 807–816. ROBERTSON FN. 1995. Geochemistry of ground water in
ROBLES-CAMACHOJANDARMIENTAMA. 2000. Natural chromium contamination of groundwater at León Valley, México. J Geochem Explor 68: 167–181.
SEDLAKDLANDCHANPG. 1997. Reduction of hexavalent chromium by ferrous iron. Geochim Cosmochim Acta 61: 2185–2192.
SOARESPC, LANDIMPMB, FÚLFAROVJANDSOBREIRO NETOAF. 1980. Ensaios de caracterização estratigráfica do Cretáceo no Estado de São Paulo: Grupo Bauru. Rev bras Geocienc 10: 177–185.