Cop
yright
© ABE&M t
odos os dir
eit
os r
eser
vados
.
Arq Bras Endocrinol Metab. 2011;55/7 494
Postglucose growth hormone nadir
and insulin-like growth factor-1 in
naïve-active acromegalic patients: do
these parameters always correlate?
Nadir do hormônio de crescimento após glicose e fator de crescimento insulina-símile do tipo 1 em pacientes acromegálicos ativos virgens de tratamento: são estes parâmetros sempre correlacionáveis?
Antônio Ribeiro-Oliveira Jr.1, Alex Faje2, Ariel Barkan2,3
T
he diagnosis of acromegaly is based on clinical features and biochemical criteria. While clinical suspicion is of extreme importance, laboratory evaluation is manda-tory to establish the diagnosis. Growth hormone (GH) is secreted in a pulsatile pat-tern. Normal individuals have undetectable levels during most of the daytime period. In contrast, GH is always detectable in acromegalic patients, promoting higher levels of insulin-like growth factor-1 (IGF-1) (1). Thus, even random GH levels < 1 µg/L do not rule out acromegaly. The two most used tests to assess biochemical activity in acromegaly are postglucose GH nadir (GHn) and IGF-1. GHn during an oral glucose tolerance test (OGTT) has been used as the standard method for acromegaly diagnosis (2), although we have recently reported suppression in low GH naïve-active acro-megalic patients below the current consensus values (3,4). Furthermore, it has been reported that OGTT should ideally be evaluated in relation to age (5-8), gender (5,7) and body mass index (5,8). Actually, there has been several attempts to deine GHn in normal patients using different assays, when cutoff values were lower than 0.3 (9,10). One report has suggested that random basal GH levels ≥ 5 µl in men, and ≥ 10 µl in women may possibly obviate the need of an OGTT suppression test, when IGF-1 is elevated (11). IGF-1 levels correlate with clinical features of acromegaly and are stable during the day (12). Studies have demonstrated that GHn and IGF-1 usually correlate well (13), although their relationship has not been tested in acromegalic populations with different GH outputs, and for different GHn thresholds.Thus, we aimed at evaluating the correlation between GHn and IGF-1 levels in two different populations of clinically and biochemically naïve-active acromegalic patients: one with clearly elevated, and the other with low mean 24-h GH concentrations. We studied thirty-eight adults with untreated acromegaly (22 males, 16 females), as deined by the presence of clinical symptoms and exam results showing elevated age-adjusted IGF-1 values. Their ages ranged from eighteen to seventy-three years old. All patients had been enrolled in other reported protocols at the University of Michigan. All patients underwent frequent blood sampling for GH followed by an OGTT, when a sample for IGF-1 was also collected. A mean 24-h GH value of 4.3 µg/L was used as the threshold value to distinguish “high” and “low” GH study groups. This cutoff val-ue was chosen because it represented the highest mean 24-h GH level in our studies of normal, healthy control adults (14). Fourteen patients were deined as “high” GH ac-romegalic patients (9 males, 5 females; mean age 40.6 ± 3.8 years) and twenty-four as
letter to the editor
1 Federal University of Minas Gerais, Belo Horizonte, MG, Brazil 2 University of Michigan, Department of Medicine, Division of MEND 3 University of Michigan, Department of Medicine, Neurosurgery, Ann Arbor, MI, USA
Correspondence to:
Antônio Ribeiro-Oliveira Jr Rua São Romão, 343/701 30330-120 – Belo Horizonte, MG, Brasil
Cop
yright
© ABE&M t
odos os dir
eit os r eser vados . 495 Arq Bras Endocrinol Metab. 2011;55/7
“low” GH acromegalic patients (13 males, 11 females; mean age 46.3 ± 2.9 years). All patients had a MRI-identiiable pituitary adenoma. A GH-secreting pitu-itary adenoma was histologically and immunochemical-ly identiied in all cases (n = 38). None of the patients had renal or hepatic impairment, and none were treated with dopamine agonists, somatostatin analogues, GH receptor antagonists, estrogen or any medication that could potentially affect GH secretion.
Participants consumed a standard isocaloric hospi-tal diet consisting of three meals and a bedtime snack during sample collection. Blood sampling for GH was performed every ten minutes for 24-h in all patients. Subsequently, an oral glucose load was given, followed by GH and glucose measurements every 10 min for two hours, between 07:00 and 09:00h (13 points in time), while patients were resting in a supine position. Serum GH was measured in duplicate using a chemi-luminescent assay (Nichols Institute Diagnostics, San Juan Capistrano, CA, USA). Sensitivity of the GH assay reported by the manufacturer, and conirmed by our experience, was 0.01 µg/liter. Plasma IGF-1 was mea-sured using a two-site immunoradiometric assay (Di-agnostic System Laboratories, Webster, TX, USA) in all samples. Age-adjusted IGF-1 values were obtained from a previously published large multicenter study by Brabant e cols. (15), which employed the same assay used in this study. Z-score calculation required the av-erage of age-speciic standard deviation reference val-ues, since reference data showed a slightly non-Gauss-ian distribution.
In order to address the relationship between GHn and IGF-1 levels, we subdivided the whole group of 38 patients according to both the group of origin (“high” or “low” GH group), and to GHn cutoff value of 1 µg/L. The relationship between logarithm-trans-formed GH levels and IGF-1 z-scores were analyzed by means of correlations using Spearman r in each
analy-sis. As all patients from the “high” GH group had GHn higher than 1 µg/L, we had thus obtained two groups and two subgroups of patients according to these cri-teria, respectively: “high” GH group with GHn higher than 1 µg/L (N = 14), “low” GH group with any GHn value (N = 24), “low” GH group with GHn higher or equal than 1 µg/L (N = 11), and “low” GH group with GHn lower than 1 µg/L (N = 13).
The two studied groups did not differ signiicantly in terms of age, gender, and body mass index. The 24-h individual mean GH for the “high” and “low” GH
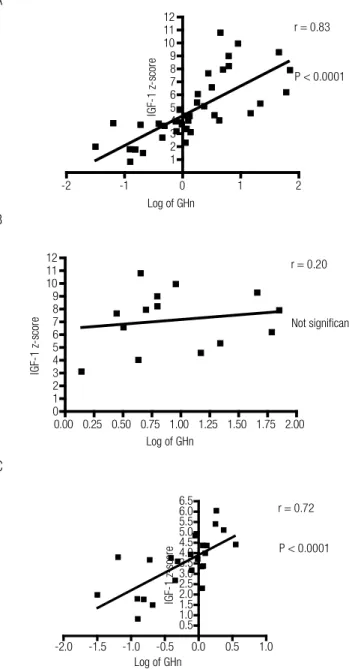
pa-tients ranged from 4.6 to 120.8, and 0.6 to 4.0 µg/L, respectively (P < 0.0001). There was a signiicant cor-relation between IGF-1 z-scores and mean 24-h GH for the entire group (r = 0.73, P < 0.0001). As shown in igure 1, signiicant correlations between GHn and IGF-1 z-scores were detected for both the entire group (r = 0.83, P < 0.0001) and the “low” GH group (r = 0.72, P < 0.0001).
Figure 1. Correlation between the logarithm-transformed postglucose growth hormone nadir (GHn) and insulin-like growth factor 1 (IGF-1) z-scores for the entire group (A; N = 38), and both “high” (B; N = 14), and “low” (C; N = 24) growth hormone groups.
-2 -1 0 1 2
1 2 3 4 5 6 7 8 9 10 11 12
P < 0.0001
Log of GHn
IG F-1 z -s co re
r = 0.83
0.00 0.25 0.50 0.75 1.00 1.25 1.50 1.75 2.00 0 1 2 3 4 5 6 7 8 9 10 11 12 Not significant
Log of GHn
IG F-1 z -s co re
r = 0.20
-2.0 -1.5 -1.0 -0.5 0.0 0.5 1.0 0.5 1.0 1.5 2.0 2.5 3.0 3.5 4.0 4.5 5.0 5.5 6.0 6.5
P < 0.0001 r = 0.72
Log of GHn
IG F-1 z -s co re A B C
However, GHn did not correlate with IGF-1 z--scores for the “high” GH group. As shown in igure 2, when the “low” GH group was subdivided into two
Cop
yright
© ABE&M t
odos os dir
eit
os r
eser
vados
.
496 Arq Bras Endocrinol Metab. 2011;55/7
subgroups according to the cutoff value of 1 µg/L for GHn, those patients who showed suppression higher or equal to 1 µg/L showed signiicant correlation with IGF-1 z-score (r = 0.80, P < 0.01), while those who showed suppression lower than 1 µg/L did not show signiicant correlation with IGF-1 Z-score.
ting it in relation to age, gender and body mass index (4), there is an important lack of agreement between GHn and IGF-1 when GH output is too high or too low. In the irst situation, repeated baseline GH levels, instead of GHn, may be of importance in follow-up alongside with IGF-1, due to possible saturation of GH receptors (12). More importantly, in the second situa-tion, no matter how low GHn is, it is still not enough to claim biochemical inactivity, and suppressed GHn should not, therefore, be regarded as important whe-never IGF-1 is high in acromegaly.
Disclosure: no potential conlict of interest relevant to this article was reported.
REFERENCES
1. Duncan E, Wass JA. Investigation protocol: acromegaly and its investigation. Clin Endocrinol (Oxf). 1999;50(3):285-93.
2. Giustina A, Chanson P, Bronstein MD, Klibanski A, Lamberts S, Casanueva FF, et al. A consensus on criteria for cure of acrome-galy. J Clin Endocrinol Metab. 2010;95(7):3141-8.
3. Vieira Neto L, Abuchan J, Araujo LA, Boguszewski CL, Bronstein MD, Czepielewski M, et al. Recomendações do Departamento de Neuroendocrinologia da Sociedade Brasileira de Endocrinologia e Metabologia para o diagnóstico e tratamento da acromegalia no Brasil. Arq Bras Endocrinol Metab. 2011;55(2):91-105. 4. Ribeiro-Oliveira A Jr, Faje AT, Barkan AL. Limited utility of oral
glucose tolerance test in biochemically active acromegaly. Eur J Endocrinol. 2011;164(1):17-22.
5. Arafat AM, Möhlig M, Weickert MO, Perschel FH, Purschwitz J, Spranger J, et al. Growth hormone response during oral gluco-se tolerance test: the impact of assay method on the estimation of reference values in patients with acromegaly and in healthy controls, and the role of gender, age, and body mass index. J Clin Endocrinol Metab. 2008;93(4):1254-62.
6. Colao A, Pivonello R, Cavallo LM, Gaccione M, Auriemma RS, Esposito F, et al. Age changes the diagnostic accuracy of mean profile and nadir growth hormone levels after oral gluco-se in postoperative patients with acromegaly. Clin Endocrinol (Oxf). 2006;65(2):250-6.
7. Colao A, Amato G, Pedroncelli AM, Baldelli R, Grottoli S, Gasco V, et al. Gender- and age-related differences in the endocrine para-meters of acromegaly. J Endocrinol Invest. 2002;25(6):532-8. 8. Vierhapper H, Heinze G, Gessl A, Exner M, Bieglmayr C. Use of
the oral glucose tolerance test to define remission in acromegaly. Metabolism. 2003;52(2):181-5.
9. Freda PU, Nuruzzaman AT, Reyes CM, Sundeen RE, Post KD. Sig-nificance of “abnormal” nadir growth hormone levels after oral glucose in postoperative patients with acromegaly in remission with normal insulin-like growth factor-I levels. J Clin Endocrinol Metab. 2004;89(2):495-500.
10. Rosário PW, Furtado MS. Growth hormone after oral glucose overload: revision of reference values in normal subjects. Arq Bras Endocrinol Metabol. 2008;52(7):1139-44.
11. Rosario PW. Measurement of basal GH in the diagnosis of acro-megaly. Arq Bras Endocrinol Metabol. 2010;54(7):668-9.
12. Barkan AL, Beitins IZ, Kelch RP. Plasma insulin-like growth factor-I/somatomedin-C in acromegaly: correlation with the
de-A
B
-0.1 0.0 0.1 0.2 0.3 0.4 0.5 0.6 0.5
1.0 1.5 2.0 2.5 3.0 3.5 4.0 4.5 5.0 5.5 6.0 6.5
P < 0.01
Log of GHn
IGF-1 z-score
r = 0.80
-1.75 -1.50 -1.25 -1.00 -0.75 -0.50 -0.25 0.00 0.0
0.5 1.0 1.5 2.0 2.5 3.0 3.5 4.0 4.5 5.0 5.5
Not significant
Log of GHn
IGF-1 z-score
r = 0.48
Figure 2. Correlation between the logarithm-transformed postglucose growth hormone nadir (GHn) and insulin-like growth factor 1 (IGF-1) z-scores in the “low” growth hormone group, according to the GHn cutoff value higher or equal than 1 µg/L (A; N = 11), or lower than 1 µg/L (B; N = 13).
Altogether, these data show that the correlation be-tween GHn and IGF-1 Z-scores, although signiicant for the entire group, is lost in the extremes of GHn, as demonstrated for the “high” GH group, and the “low” GH group with GHn lower than 1 µg/L. Interestingly, we have found GHn lower than 1 µg/L in more than 50% of our “low” GH acromegalic patients, and GHn lower than 0.4 µg/L in almost 30% of these patients. Moreover, we had two active female acromegalic pa-tients, in which GHn is expected to be higher than in males, showing GHn levels as low as 0.03 µg/L and 0.07 µg/L. Accordingly, a mild residual disease activity in a subgroup of treated acromegalic patients with GHn < 1 µg/L and increased IGF-1 was recently shown (16).
In conclusion, besides OGTT being superluous in the diagnosis of acromegaly in patients with active dise-ase and “high” GH (3), and the dificulty in
Cop
yright
© ABE&M t
odos os dir
eit
os r
eser
vados
.
497 Arq Bras Endocrinol Metab. 2011;55/7
gree of growth hormone hypersecretion. J Clin Endocrinol Me-tab. 1988;67(1):69-73.
13. Dobrashian RD, O’Halloran DJ, Hunt A, Beardwell CG, Shalet SM. Relationships between insulin-like growth factor-1 levels and growth hormone concentrations during diurnal profi-les and following oral glucose in acromegaly. Clin Endocrinol (Oxf). 1993;38(6):589-93.
14. Dimaraki EV, Jaffe CA, DeMott-Friberg R, Chandler WF, Barkan AL. Acromegaly with apparently normal GH secretion:
impli-cations for diagnosis and follow-up. J Clin Endocrinol Me-tab. 2002;87(8):3537-42.
15. Brabant G, Von Zur Muhlen A, Wuster C, Ranke MB, Kratzsch J, Kiess W, et al. Serum insulin-like growth factor I reference values for an automated chemiluminescence immunoassay system: re-sults from a multicenter study. Horm Res. 2003;60(2):53-60. 16. Elias PC, Lugao HB, Pereira MC, Machado HR, Castro M, Moreira
AC. Discordant nadir GH after oral glucose and IGF-I levels on treated acromegaly: refining the biochemical markers of mild di-sease activity. Horm Metab Res. 2010;42(1):50-5.