1
Universidade Federal da Fronteira do Sul, Coordenação Acadêmica de Passo Fundo, Curso de Medicina. Rod. RS 153, km 3, 99034-600, Passo Fundo, RS, Brasil. Correspondência para/Correspondence to: IL LINDEMANN. E-mail: <[email protected]>. 2
Universidade Federal de Pelotas, Faculdade de Nutrição, Curso de Nutrição. Pelotas, RS, Brasil. 3
Universidade Federal do Rio Grande, Faculdade de Medicina, Programa de Pós-Graduação em Ciências da Saúde. Rio Grande, RS, Brasil.
Article based on the doctoral dissertation of IL LINDEMANN, intitled “Avaliação da promoção da alimentação saudável na atenção básica de Pelotas (RS)”. Universidade Federal do Rio Grande; 2015.
Reception of nutrition information by
adult and older adult users of Primary
Healthcare: Occurrence, associated
factors, and sources of information
Informações sobre nutrição entre adultos
e idosos usuários da Atenção Primária de
Saúde
:
ocorrência, fatores associados
e fontes de informação
Ivana Loraine LINDEMANN1,3
Emily Parker MOLON2
Gicele Costa MINTEM2
Raúl Andrés MENDOZA-SASSI3
A B S T R A C T
Objective
To investigate reception of nutrition information (outcome), associated factors, and types of sources.
Methods
This cross-sectional study, conducted in 2013, included 1,246 adult and older adult users of the Primary Healthcare network of Pelotas, Rio Grande do Sul, Brazil. The sample was characterized by reception of nutrition information, its sources, and demographic, socioeconomic, health, knowledge, and life habit variables. Prevalence ratios and their respective 95% confidence intervals investigated associations between reception of nutrition information and independent variables.
Results
physically active were more likely to receive nutrition information, and normal weight individuals were less likely. The outcome differed by income strata, being highest in the highest quintile. There was a linear trend for education level and for following the Ten Steps to Healthy Eating: the outcome was more likely in individuals with at least higher education and those who followed at least four steps. The most cited sources of nutrition information were television shows (56.2%), other (46.2%), physician (41.2%), Internet (25.1%), and family members (20.9%), which did not differ by sex.
Conclusion
Primary healthcare users received little nutrition information, and television could be a useful tool for the institutions responsible for the sector to disseminate the official nutritional recommendations.
Keywords: Feeding behaviour. Health promotion. Nutrition in public health. Primary health care.
R E S U M O
Objetivo
Investigar o recebimento de informações sobre nutrição, fatores associados e tipos de fontes.
Métodos
Estudo transversal, realizado em 2013, com 1 246 adultos e idosos usuários da Atenção Primária de Saúde de Pelotas, Rio Grande do Sul. A amostra foi caracterizada quanto ao recebimento de informações sobre nutrição, suas fontes, e variáveis demográficas, socioeconômicas, de saúde, de conhecimento e de hábitos de vida. A associação das variáveis independentes com o recebimento de informações sobre nutrição foi verificada por meio das razões de prevalências e seus intervalos de confiança.
Resultados
A prevalência do recebimento de informações sobre nutrição foi de 37,6% (IC95=34,9–40,3) e a probabilidade de sua ocorrência foi maior entre idosos, entre aqueles com autopercepção positiva da alimentação, que recebiam informações sobre saúde e fisicamente ativos e, menor entre eutróficos. Observaram-se diferenças entre estratos de renda, sendo a probabilidade do desfecho maior no quintil mais elevado. Verificou-se tendência linear para escolaridade e seguimento dos 10 Passos da Alimentação Saudável, sendo a probabilidade do desfecho maior entre usuários com no mínimo ensino superior e entre os que seguiam no mínimo 4 passos. Quanto às fontes de informações sobre nutrição, as mais citadas foram programa de televisão (56,2%), outra (46,2%), médico (41,2%), Internet (25,1%) e familiares (20,9%) e não foram observadas diferenças conforme o sexo.
Conclusão
Os usuários da Atenção Primária de Saúde pouco recebiam informações sobre nutrição e, fazer uso da televisão como ferramenta para divulgar as recomendações alimentares oficiais, poderia ser útil às instituições responsáveis pelo setor.
Palavras-chave: Comportamento alimentar. Promoção da saúde. Nutrição em saúde pública. Atenção primária à saúde.
I N T R O D U C T I O N
The important role of healthy eating and consequently, proper nutrition for health promotion, prevention of many diseases, and the nonpharmacological treatment of such diseases is widely known [1-3]. Nutrition information from reliable sources allows individuals, families, and communities to make autonomous food choices safely because their choices depend not only on their individuality but also on their
environment [4]. Since health professionals, especially dietitians and those related to Primary Healthcare, have the responsibility of promoting an adequate and healthy diet [5-7], they should be able to provide nutrition information.
despite its value and the public interest for such information, promoted mainly by the media, few studies have examined the population’s sources of nutrition information [8]. The most frequent sources reported so far are the media, especially television, health professionals, especially physicians, family members, friends [8-10], and food labels [8]. One of the few Brazilian studies that investigated sources of nutrition information found that the most frequent sources for university students from São Paulo were family members (27.6%), food labels/supplements (27.6%), and physicians (26.5%) [11].
Knowing the proportion of the population that receives nutrition information is important because it allows the assessment of whether the actions implemented by the government and recommended by the World Health Organization (WHO) [4] are efficient, enabling authorities to change or diversify the target population. On the other hand, knowing the most frequent sources of nutrition information indicates which sources need to be better explored and which require more content.
Hence, given the importance of the subject and the scarcity of studies on it, this study aims to investigate the reception of nutrition information by users of Primary Healthcare, its associated factors, and the main types of sources.
M E T H O D S
This study used data from a cross-sectional study, conducted from May to October 2013, that assessed the promotion of a healthy diet by the urban Primary Healthcare network of Pelotas, a municipality in the south of Rio Grande do Sul. At the time, the network consisted of 36 Primary Healthcare Units, and 14 of these units had implemented the Family Health Strategy (ESF) program, with a coverage of 38.9%.
The study included individuals aged 20 years or more of both sexes, but excluded
women who were pregnant or breastfeeding and individuals with physical or mental disabilities because of possible special diets, differentiated nutritional assessment, or difficulty to answer the questionnaire.
The sample size was calculated by the software Epi Info 6.04 (Centers for Disease Control and Prevention, Atlanta, Georgia, United States), considering different risk factors, a relative risk of 2.0, confidence level of 95%, power of 80%, unexposed-to-exposed ratio of 1:9, and expected prevalence of the outcome of at least 13%, which resulted in a sample size of 936 respondents. Additional 10% and 25% of respondents were added to compensate for losses and confounding factors, respectively, resulting in a sample size of 1,264 individuals. All urban Primary Healthcare Units were included in a two-stage sampling process. First, proportional random sampling defined the number of interviewees in each Primary Healthcare Unit. Proportionality was defined by the mean number of procedures conducted in the month before the start of data collection. Then, by convenience sampling, a pair of interviewers consecutively interviewed the required number of users waiting for care.
The outcome, reception of nutrition information, was assessed by the question, “Do you receive nutrition information?”. Those who answered positively were asked, “From where do you receive nutrition information?”. The answer options were: family members, Internet, television program, radio program, newspaper, magazine, book, physician, nurse, and other(s), and multiple answers were allowed. Those who answered “other” were asked, “Which?”.
minimum salary at the time was R$678.00, equivalent to roughly US$320.00 when the data were collected), education level (in completed years of formal education, categorized as elementary school/high school/higher education or more), and employment status (employed/not employed).
With respect to health, the study collected self-reported diagnosis of Chronic Noncommunicable Diseases (NCDs), namely obesity, diabetes Mellitus, high blood pressure, high cholesterol, high triglycerides, and/or heart disease (categorized as yes/no). Nutritional status was also investigated by collecting self-reported weight and height (Body Mass Index [BMI], categorized as normal weight/excess weight, using the following cutoffs: 18.5 ≤ BMI <25/≥25kg/m2
for adults and 22 ≤ BMI <27/≥27kg/m2 for older
adults as recommended by [5]. Self-perceived health and diet (negative/positive), and food insecurity (yes/no, using the scale proposed by Bickel et al. [12]) were also assessed.
Regarding knowledge and access to health services, the following variables were analyzed: reception of health information (yes/ no) and model of healthcare implemented in the user’s Primary Healthcare Unit (traditional/ESF).
Regarding life habits, the study assessed compliance with the Ten Steps to Healthy Eating [13] (noncompliant/compliance with 1-3 steps/ compliance with 4 steps or more) created by the Brazilian Ministry of Health, whether the user faced difficulties to consume a healthy diet (yes/no), smoking status (smoker/nonsmoker), physical activity (active/inactive), and alcohol intake (yes/no).
A questionnaire was used for data collection. The questionnaire had been tested and coded by six pairs of trained interviewers who visited the Primary Healthcare Units, identified the eligible users, and interviewed them in the waiting room after obtaining the users’ Informed Consent. The users were interviewed on weekdays, in the mornings
and afternoons, during the working hours of the unit, before the medical appointment. The second interviewer and field supervisor invited the individuals who refused to participate in the study a second and third times, respectively. Losses were not compensated.
The data were entered twice. The software EpiData 3.1 (EpiData Association, Denmark) identified outliers or consistency errors and cleaned the database. The statistical package Stata, version 12 (Stata Corp., College Station, United States) analyzed the data, described the sample in terms of absolute and relative frequencies, and mean and standard deviation, and calculated the prevalence of the outcome and its 95% Confidence Intervals (95%CI). Bivariate analysis investigated possible associations between the outcome and exposure factors, generating crude Prevalence Ratios (PR) and their 95%CI.
Multivariate analysis consisted of Poisson regression with cluster-robust variance, generating the adjusted PR and their 95%CI. The analysis was of the backward stepwise type and followed a four-level hierarchical model [14]: 1st level – demographic and socioeconomic variables; 2nd level – health status; 3rd level – knowledge and access to healthcare services; and 4th level – life habits. The variables of each level were entered in the model, and those with p>0.20 were removed one by one to avoid negative confounding. Then, the variables from the next level were entered and so on to the last level. The linear trend (Wald test) and heterogeneity of ordered and unordered polytomous variables, respectively, were tested.
The absolute and relative frequencies, and the respective confidence intervals were calculated for the types of nutrition information sources reported by the participants, which were then compared by sex by the Chi-square test. The significance level was set at 5% (p<0.05) for all tests.
the Universidade Federal do Rio Grande (Process nº 23116,005717/2012-98), and complied with Resolution nº 466/12 of the National Health Council and the main ethical principles of the Declaration of Helsinki.
R E S U L T S
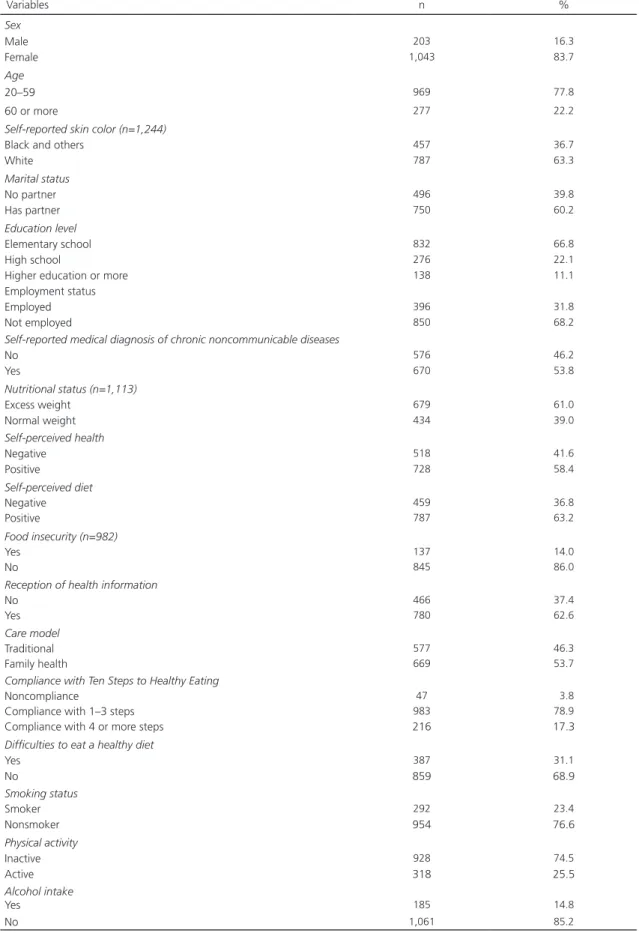
During the field work, a total of 1,264 users were selected and 1,246 users were effectively interviewed, resulting in a loss of 1.4%. Most interviewees were female (83.7%), not employed (68.2%), and aged 20 to 59 years (77.8%), and had white skin color (63.3%), domestic partner (60.2%), and elementary school (66.8%). Income per capita varied from R$0.00 to R$3,333.30 (mean 496.90 ± Standard Deviation [SD]=344.10), with means of R$142.95 (± SD=71.69) in the first quintile, R$289.53 (± SD=37.90) in the second quintile, R$416.78 (± SD=51.78) in the third quintile, R$629.13 (± SD=67.08) in the fourth quintile, and R$1,034.87 (± SD=304.83) in the fifth quintile. Most participants had been diagnosed with one or more NCDs (53.8%), had excess weight (61.0%), had positive self-perceived health (58.4%) and diet (63.2%), and were food secure (86.0%). Most participants received health information (62.6%) and care from the ESF (53.7%). Only 17.3% of the sample complied with four or more of the Ten Steps to Healthy Eating, and 31.1% reported having difficulties to eat healthy. Most participants were nonsmokers (76.6%), did not consume alcohol (85.2%), and were physically inactive (74.5%) (Table 1).
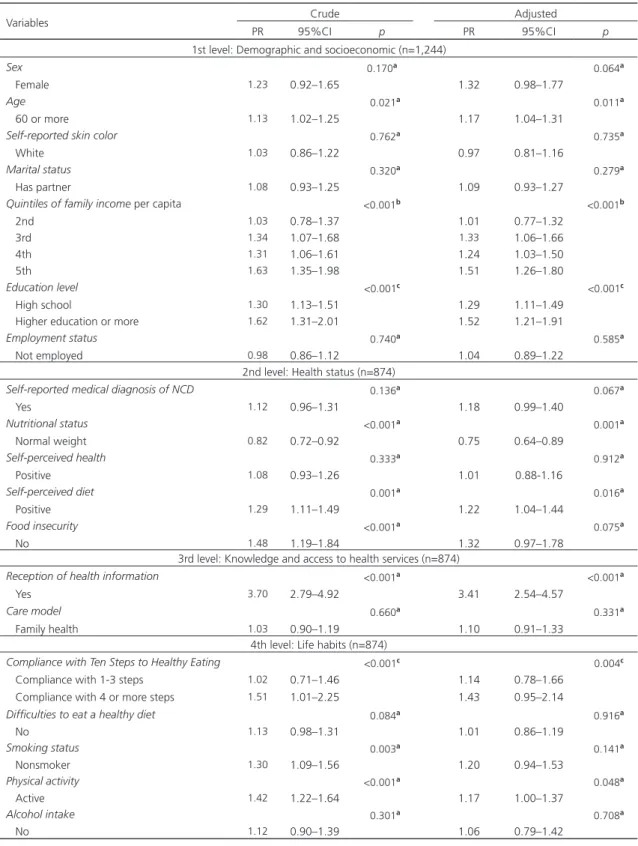
More than one-third of the sample (37.6%; 95%CI=34.9–40.3) had received nutrition information. The study factors associated with the outcome were higher age (PR=1.17; 95%CI=1.04–1.31), positive self-perceived diet (PR=1.22; 95%CI=1.04–1.44), reception of health information (PR=3.41; 95%CI=2.54–4.57), nutritional status, where normal weight individuals were less likely to be associated with the outcome (PR=0.75; 95%CI=0.64–0.89), and physical
activity, which was borderline significant (PR=1.17; 95%CI=1.00–1.37). The outcome was also influenced by income stratum, with the highest quintile being more likely to receive health information (PR=1.51; 95%CI=1.26–1.80, heterogeneity p<0.001). A linear trend of association with the outcome was found for education level and compliance with the Ten Steps to Healthy Eating: the outcome was more likely in individuals with higher education or more (PR=1.52; 95%CI=1.21–1.91) and in those who complied with four or more steps (PR=1.43; 95%CI=0.95–2.14). After adjustment, food insecurity and positive smoking status lost their effect (Table 2).
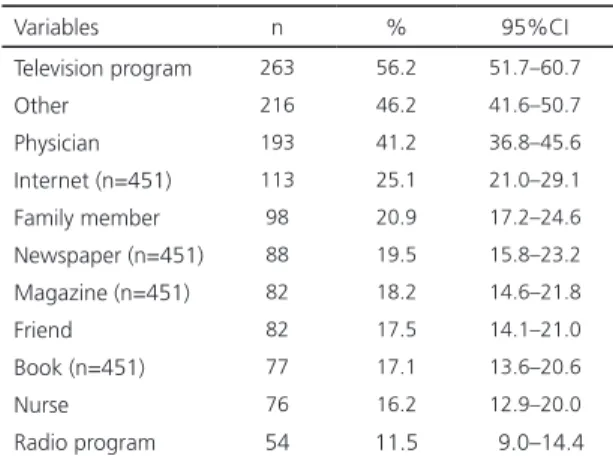
The most common sources of nutrition information were television programs (56.2%), others, (46.2%), physician (41.2%), Internet (25.1%), and family member (20.9%) (Table 3). Dietitians were the most prevalent ‘other source’
of nutrition information, cited by 168 (77.8%) individuals. The outcome prevalence did not differ by sex (data not shown).
D I S C U S S I O N
Few studies have investigated the reception of nutrition information, whether by the general population or users of health services, especially its occurrence, associated factors, and sources. This study, conducted in a medium-sized municipality in the Brazilian South, found that fewer than 25% of the sample reported having received nutrition information.
Table 1. Characterization of a sample of adult and older adult users of Primary Healthcare. Pelotas (RS), Brazil. 2013 (n=1,246).
Variables n %
Sex
Male 203 16.3
Female 1,043 83.7
Age
20–59 969 77.8
60 or more 277 22.2
Self-reported skin color (n=1,244)
Black and others 457 36.7
White 787 63.3
Marital status
No partner 496 39.8
Has partner 750 60.2
Education level
Elementary school 832 66.8
High school 276 22.1
Higher education or more 138 11.1
Employment status
Employed 396 31.8
Not employed 850 68.2
Self-reported medical diagnosis of chronic noncommunicable diseases
No 576 46.2
Yes 670 53.8
Nutritional status (n=1,113)
Excess weight 679 61.0
Normal weight 434 39.0
Self-perceived health
Negative 518 41.6
Positive 728 58.4
Self-perceived diet
Negative 459 36.8
Positive 787 63.2
Food insecurity (n=982)
Yes 137 14.0
No 845 86.0
Reception of health information
No 466 37.4
Yes 780 62.6
Care model
Traditional 577 46.3
Family health 669 53.7
Compliance with Ten Steps to Healthy Eating
Noncompliance 47 3.8
Compliance with 1–3 steps 983 78.9
Compliance with 4 or more steps 216 17.3
Difficulties to eat a healthy diet
Yes 387 31.1
No 859 68.9
Smoking status
Smoker 292 23.4
Nonsmoker 954 76.6
Physical activity
Inactive 928 74.5
Active 318 25.5
Alcohol intake
Yes 185 14.8
Table 2. Crude and adjusted analyses of the factors associated with access to nutrition information reported by adult and older adult users of Primary Healthcare. Pelotas (RS), Brazil. 2013 (n=1,246).
Variables Crude Adjusted
PR 95%CI p PR 95%CI p
1st level: Demographic and socioeconomic (n=1,244)
Sex 0.170a 0.064a
Female 1.23 0.92–1.65 1.32 0.98–1.77
Age 0.021a 0.011a
60 or more 1.13 1.02–1.25 1.17 1.04–1.31
Self-reported skin color 0.762a 0.735a
White 1.03 0.86–1.22 0.97 0.81–1.16
Marital status 0.320a 0.279a
Has partner 1.08 0.93–1.25 1.09 0.93–1.27
Quintiles of family income per capita <0.001b <0.001b
2nd 1.03 0.78–1.37 1.01 0.77–1.32
3rd 1.34 1.07–1.68 1.33 1.06–1.66
4th 1.31 1.06–1.61 1.24 1.03–1.50
5th 1.63 1.35–1.98 1.51 1.26–1.80
Education level <0.001c <0.001c
High school 1.30 1.13–1.51 1.29 1.11–1.49
Higher education or more 1.62 1.31–2.01 1.52 1.21–1.91
Employment status 0.740a 0.585a
Not employed 0.98 0.86–1.12 1.04 0.89–1.22
2nd level: Health status (n=874)
Self-reported medical diagnosis of NCD 0.136a 0.067a
Yes 1.12 0.96–1.31 1.18 0.99–1.40
Nutritional status <0.001a 0.001a
Normal weight 0.82 0.72–0.92 0.75 0.64–0.89
Self-perceived health 0.333a 0.912a
Positive 1.08 0.93–1.26 1.01 0.88-1.16
Self-perceived diet 0.001a 0.016a
Positive 1.29 1.11–1.49 1.22 1.04–1.44
Food insecurity <0.001a 0.075a
No 1.48 1.19–1.84 1.32 0.97–1.78
3rd level: Knowledge and access to health services (n=874)
Reception of health information <0.001a <0.001a
Yes 3.70 2.79–4.92 3.41 2.54–4.57
Care model 0.660a 0.331a
Family health 1.03 0.90–1.19 1.10 0.91–1.33
4th level: Life habits (n=874)
Compliance with Ten Steps to Healthy Eating <0.001c 0.004c
Compliance with 1-3 steps 1.02 0.71–1.46 1.14 0.78–1.66 Compliance with 4 or more steps 1.51 1.01–2.25 1.43 0.95–2.14
Difficulties to eat a healthy diet 0.084a 0.916a
No 1.13 0.98–1.31 1.01 0.86–1.19
Smoking status 0.003a 0.141a
Nonsmoker 1.30 1.09–1.56 1.20 0.94–1.53
Physical activity <0.001a 0.048a
Active 1.42 1.22–1.64 1.17 1.00–1.37
Alcohol intake 0.301a 0.708a
No 1.12 0.90–1.39 1.06 0.79–1.42
Note: Statistical tests: aChi-square2; bHeterogeneity; CLinear trend. Reference categories: male, 20–59 years of age, non-white, has no partner, 1st income quintile, elementary school, employed, has not been medically diagnosed with chronic noncommunicable diseases, excess weight, negative self-perceived health and diet, food insecurity, has no access to health information, traditional healthcare model, noncompliance with the Ten Steps to Healthy Eating, has difficulties to eat a healthy diet, smoker, physically inactive, and consumes alcohol.
The probability of receiving nutrition information was higher in older adults, possibly because they are the population segment that most frequents health services due to their higher morbidity load [16]. Health services are a potential source of nutrition information either because of the information material available, such as posts or pamphlets or because of educational actions targeting individuals or groups. On the other hand, it may also be because older adults represent the highest proportion of television viewers [17-19], the most cited source of nutrition information in the study sample and recognizably the main means of information and entertainment in Brazil [19]. Television viewing may also explain why women are more concerned with health and nutrition [20,21], although this outcome did not differ by gender, unlike a Canadian sample, whose most frequent source of nutrition information was food labels [8].
The outcome was more likely to be found in users with higher education level and income. In the case of education level, the trend was linear. The association between the outcome and education level is still controversial [8]. Even though higher-income and higher-education individuals use Primary Healthcare, their most common sources of nutrition information were
Table 3. Sources of nutrition information reported by adult and
older adult users of Primary Healthcare. Pelotas (RS), Brazil, 2013 (n=468).
Variables n % 95%CI
Television program 263 56.2 51.7–60.7
Other 216 46.2 41.6–50.7
Physician 193 41.2 36.8–45.6
Internet (n=451) 113 25.1 21.0–29.1
Family member 98 20.9 17.2–24.6
Newspaper (n=451) 88 19.5 15.8–23.2
Magazine (n=451) 82 18.2 14.6–21.8
Friend 82 17.5 14.1–21.0
Book (n=451) 77 17.1 13.6–20.6
Nurse 76 16.2 12.9–20.0
Radio program 54 11.5 9.0–14.4
not physicians or nurses, suggesting that they can search for information and increase their information sources more autonomously as they have better means to do so.
The probability of receiving nutrition information was also higher in users with a positive self-perceived diet, those who complied a higher number of the Ten Steps to Healthy Eating (linear trend), and those who were physically active, which, combined with the fact that normal weight individuals were less likely to receive nutrition information, suggests that nutrition information is sought by those who wish to lose weight.
Reception of health information was the variable that most increased the probability of the outcome possibly because much health information disseminated nowadays regard food choices, especially foods to maintain or lose weight as the prevalence of excess weight is high [22] and society in general worships thinness [23]. Moreover, although proper nutrition is an important component for preventing and treating NCDs, reception of information on the subject was not significantly associated with self-perceived health or NCD diagnosis.
Although a reasonable portion of the sample cited getting nutrition information from television programs and the Internet, and this study did not assess search sites and their content, or television programs and the information they provided, this finding requires pondering. Regarding the Internet, data for Brazil was not found, but in Canada the most common online sources of health and nutrition information were not commercial sites, but government or institutional sites, which were considered the best sources of information, followed by articles written by health professionals [24]. Knowing how much television influences behavior [17], it is important to emphasize the importance of assessing and regulating the scientificity of what it disseminates.
individuals who cited ‘other sources’ in the options provided by the questionnaire, even though the sample consisted of Primary Healthcare users, leading us to expect that health professionals, namely physicians and nurses, were the most frequent sources of nutrition information. This result may stem from the fact that 19 (52.8%) of the 36 Primary Healthcare Units had a dietitian in their staff, which not only promotes the reception of nutrition information but may also qualify the process.
The main positive point of this study is its contribution to the knowledge of nutrition information reception, more specifically, in Primary Healthcare users, a subject that is still little explored. The small percentage of losses and the adequate statistical power for most of the study associations are also positive aspects. The limitation is the study’s cross-sectional design, which prevents the identification of outcome determinants and the possibility of reverse causality for some variables. Another important aspect is the fact that participants had been interviewed in the waiting rooms of the healthcare units, which may have resulted in an over- or underestimation of some variables.
C O N C L U S I O N
In conclusion, the findings show that Primary Healthcare users receive little nutrition information. The groups least likely to receive such information were adults, individuals with lower income, education level, and normal weight, individuals who had a negative self-perceived diet, individuals who did not receive health information, individuals who did not comply with any of the Ten Steps to Healthy Eating, and those who were physically inactive. Considering the influence of television on Brazilians, television could be a useful tool for the agencies and institutions in charge of this subject to disseminate official dietary recommendations, increasing the dissemination of proper nutrition information. The role of
health professionals, especially physicians and nurses, should also be contemplated because they are not cited as the most frequent sources of nutrition information despite their direct contact with Primary Healthcare users.
C O N T R I B U T I O N S
IL LINDEMANN and EP MOLON helped to collect and tabulate the data, discuss the results, and write the article. GC MINTEM and RA MENDOZA-SASSI helped to tabulate the data, discuss the results, and write the article. IL LINDEMANN and RA MENDOZA-SASSI helped to create the project.
R E F E R E N C E S
1. Sinclair J, Lawson B, Burge F. Which patients receive advice on diet and exercise? Do certain characteristics affect whether they receive such advice? Can Fam Physician. 2008;54(3):404-12.
2. Jaime PC, Silva ACF, Lima AMC, Bortolini GA. Ações de alimentação e nutrição na atenção básica: a experiência de organização no Governo Brasileiro. Rev Nutr. 2011;24(6):809-24. https:// doi.org/10.1590/S1415-52732011000600002
3. American Diabetes Association. Standards of medical care in diabetes 2014. Diabetes Care. 2014;37(Suppl.1):14-80. https://doi.org/10.2337/ dc14-S014
4. Ministério da Saúde (Brasil). Secretaria de Atenção à Saúde. Guia alimentar para a população brasileira. 2ª ed. Brasília: Ministério da Saúde; 2014 [acesso 2016 mar 14]. Disponível em: http://189.28.128.100/dab/docs/portaldab/ publicacoes/guia_alimentar_populacao_brasileira. pdf
5. Ministério da Saúde (Brasil). Secretaria de Atenção à Saúde. Protocolos do Sistema de Vigilância Alimentar e Nutricional – SISVAN na assistência à saúde. Série B. Textos Básicos de Saúde. Brasília: Ministério da Saúde; 2008 [acesso 2017 fev 16]. Disponível em: http://189.28.128.100/nutricao/ docs/geral/protocolo_sisvan.pdf
6. Ministério da Saúde (Brasil). Secretaria de Vigi-lância em Saúde. Política Nacional de Promoção da Saúde. 3ª ed. Série B. Textos Básicos de Saúde. Série Pactos pela Saúde 2006, 7. Brasília: Ministério da Saúde; 2010.
Nutrição. Série B. Textos Básicos de Saúde. Brasília: Ministério da Saúde; 2012.
8. Goodman S, Hammond D, Pillo-Blocka F, Glanville T, Jenkins R. Use of Nutritional Information in Canada: National Trends between 2004 and 2008. J Nutr Educ Behav. 2011;43(5):356-65. https://doi.org/10.1016/j.jneb.2011.02.008
9. Lin W, Lee Y. Nutrition knowledge, attitudes, and dietary restriction behavior of the Taiwanese elderly. Asia Pac J Clin Nutr. 2005;14(3):221-9.
10. Zoellner J, Connell C, Bounds W, Crook L, Yadrick K. Nutrition literacy status and preferred nutrition communication channels among adults in the lower Mississippi delta. Prev Chronic Dis. 2009;6(4):1-11.
11. Santos KMO, Barros Filho AZ. Fontes de infor-mação sobre nutrição e saúde utilizadas por estudantes de uma universidade privada de São Paulo. Rev Nutr. 2002;15(2):201-10. https://doi. org/10.1590/S1415-52732002000200009
12. Bickel G, Nord M, Price C, Hamilton W, Cook J. Measuring food security in the United States: Guide to measuring household food security. Revised 2000. Alexandria: United States Department of Agriculture; 2000.
13. Ministério da Saúde (Brasil). Secretaria de Atenção à Saúde. Alimentação saudável para todos: siga os dez passos. Brasília: Ministério da Saúde; [acesso 2017 fev 16]. Disponível em: http://189.28.128.100/ nutricao/docs/geral/10passosAdultos.pdf
14. Victora CG, Huttly SR, Fuchs SC, Olinto MTA. The role of conceptual frameworks in epidemiological analysis: A hierarchical approach. Int J Epidemiol. 1997;26(1):224-2.
15. World Health Organization. Global strategy on diet, physical activity and health. Resolution of the World Health Assembly. Fifty-seventh World Health Assembly. Geneva: WHO; 2004 [cited 2017 Feb 16]. Available from: http://www. who.int/dietphysicalactivity/strategy/eb11344/ strategy_english_web.pdf
16. Pilger C, Menon MU, Mathias TAF. Utilização de serviços de saúde por idosos vivendo na comu-nidade. Rev Esc Enferm USP. 2013;47(1):213-20.
17. Acosta-Orjuela GM. Como e porque idosos bra-sileiros usam a televisão: um estudo dos usos e gratificações associados ao meio [doutorado]. Cam-pinas: Universidade Estadual de Campinas; 2001.
18. Acosta MA, Rodrigues FAS, Pastorio A. Análise do uso dos meios de comunicação por idosos de Santa Maria/RS. Estud Interdiscipl Envelhec. 2012;17(1):167-82.
19. Galdiole FER. Diretrizes de usabilidade para pro-gramas interativos de entretenimento para o público idoso em TV digital [mestrado]. Bauru: Universidade Estadual Paulista Júlio de Mesquita Filho; 2013.
20. Beydoun MA, Wang Y. Do nutrition knowledge and beliefs modify the association of socio-economic factors and diet quality among US adults? Prev Med. 2008;46(2):145-53.
21. Vinholes DB, Assunção MCF, Neutzling MB. Frequency of healthy eating habits measured by the 10 Steps to Healthy Eating score proposed by the Ministry of Health: Pelotas, Rio Grande do Sul State, Brazil. Cad Saúde Pub. 2009;25(4):791-9.
22. NCD Risk Factor Collaboration. Trends in adult body-mass index in 200 countries from 1975 to 2014: A pooled analysis of 1698 population-based measurement studies with 19.2 million participants. Lancet. 2016;387(10026):1377-96.
23. Martins VL. Valores estéticos e estigmas sociais ligados ao culto à beleza. Intraciência. 2010;2(1):26-105.
24. Ostry A, Young ML, Hughes M. The quality of nutritional information available on popular websites: A content analysis. Health Educ Res. 2008;23(4):648-55. https://doi.org/10.1093/her/ cym050