Marco Aurélio PeresI
Anelise Viapiana MasieroII Giana Zabarto LongoII
Gino Chaves da RochaII
Izabella Barison MatosII
Kathie NajnieIII
Maria Conceição de OliveiraII
Marina Patrício de ArrudaII
Karen Glazer PeresI
I Programa de Pós-Graduação em Saúde Coletiva. Centro de Ciências da Saúde. Universidade Federal de Santa Catarina. Florianópolis, SC, Brasil
II Centro de Ciências da Saúde. Universidade do Planalto Catarinense. Lages, SC, Brasil III Fundação Oswaldo Cruz. Rio de Janeiro, RJ,
Brasil Correspondence: Marco Aurélio Peres
Programa de Pós-Graduação em Saúde Coletiva
Centro de Ciências da Saúde Universidade Federal de Santa Catarina Campus Universitário Trindade 88010-970 Florianópolis, SC, Brasil E-mail: [email protected] Received: 5/13/2009 Approved: 4/6/2010
Article available from: www.scielo.br/rsp
Self-rated health among adults
in Southern Brazil
ABSTRACT
OBJECTIVE: To analyze factors associated with self-rated health in adults.
METHODS: A population-based, cross-sectional study was performed with
a sample of 2,051 adults aged between 20 and 59 years, in the city of Lages, Southern Brazil, in 2007. Household questionnaires were applied to obtain data on self-rated health, socioeconomic and demographic conditions, smoking habit, lifestyle and self-reported morbidities. Blood pressure, weight, height and abdominal circumference were measured. multivariable analysis was performed using Poisson regression, adjusted for the sampling design effect and stratifi ed by sex.
RESULTS: Prevalence of positive self-rated health was 74.2% (95% CI:
71.3;77.0), signifi cantly higher in men (82.3%, 95%CI: 79.3;85.0) than in women (66.9%, 95%CI: 63.2;70.7). Poorer, less educated and older men showed higher prevalences of negative self-rated health. After adjustment, high blood pressure levels and reporting chest wheezing were strongly associated with negative self-rated health in men. Prevalence of negative self-assessment was higher in poorer, less educated and older women and in those who showed abdominal obesity. High blood pressure levels, diabetes, chest wheezing and shortness of breath remained associated with the outcome after adjustment in women. The number of morbidities self-reported by women and men showed an association with negative self-rated health.
CONCLUSIONS: Women and individuals who were older, poorer or less
educated considered their health condition to be fair or poor. The higher the number of self-reported morbidities, the greater the proportion of individuals with negative self-rated health; the effect of morbidities was greater in women.
DESCRIPTORS: Adult. Self Assessment (Psychology). Life Style. Body
Weights and Measures. Socioeconomic Factors. Health Knowledge, Attitudes, Practice. Health Surveys.
INTRODUCTION
Self-rated health has been used in population health surveys because it can be easily applied and it has a high level of validity and reliability. Such assessment is a marker of inequalities among population subgroups, it shows high levels of predictive values of morbimortality and it enables international comparisons to be made.11,21 Individuals with a negative self-rated health had a relative risk
of death almost two times higher than those who considered their health as excellent.7
Population-based studies on self-rated health are impor-tant to know health conditions and to monitor them throughout time. They allow the assessment of effec-tiveness of health policies, actions and services. Self-rated health can be incorpoSelf-rated into the health surveil-lance system due to its relatively easy feasibility.
Studies on self-rated health are recommended by the
World Health Organization (WHO)3 and some
popula-tion-based studies performed in Brazil have followed the WHO recommendations, such as the 2003 World Health Survey,20 the health module of the 1998 and 2003
National Household Sample Survey (PNAD)1,5,6 and the
state of São Paulo Health and Life Condition Survey.a
In view of the importance of such population-based research, the present study aimed to analyze factors associated with self-rated health in adults.
METHODS
A cross-sectional study was performed in the city of Lages, in the state of Santa Catarina, Southern Brazil, between May and October 2007. In 2005, the population of this city totaled 166,733 inhabitants, 97.4% of whom lived in its urban area.b In 2000, Lages had a municipal
human development index (HDI-M) of 0.813, coming in 74th place among the 293 cities of the state of Santa
Catarina and 315th place among the 5,564 Brazilian
cities.c The representative sample was comprised of
2,051 adults aged between 20 and 59 years (in complete years), living in an urban area (52% of the city’s total population).b The present study is part of a broader
health survey with several outcomes investigated, where a specifi c sample size calculation, suffi cient to estimate the prevalence of self-rated health, was made for each outcome. A 95% confi dence level, prevalence of fair and poor self-rated health of 25%,d sampling error of
3.5% and a design effect equal to two were adopted. A total of 10% was added to the sample size to compen-sate for losses and refusals and 20% to control possible confounding factors in the multivariable analysis, totaling 1,531 individuals. A 95% confi dence level, power of 80%, expected outcome (negative self-rated health) in the non-exposed group of 20%, ratio between the number of exposed and non-exposed individuals of 20:80 and minimum relative risk to be detected of 1.6 were adopted. The required minimum sample size to analyze these associations was 722 individuals. Analyses were stratifi ed by sex. The EpiInfo software, version 6.04, was used to calculate sample size.
a Cesar CLG, Carandina L, Alves MCGP, Barros MBA, Goldbaum M. Saúde e condição de vida em São Paulo. Inquérito multicêntrico de saúde no Estado de São Paulo – ISA-SP. São Paulo: USP/FSP; 2005.
b Instituto Brasileiro de Geografi a e Estatística. Estimativas de população. [cited 2007 Jan 15] Available from: http://www.ibge.gov.br/home/ estatistica/populacao/estimativa2009/default.shtm
c Programa das Nações Unidas para o Desenvolvimento. Atlas do Índice de Desenvolvimento Humano. [cited 2009 Jan 10] Available from: www.pnud.org.bra/atlas/tanking/IDH-M
d Instituto Brasileiro de Geografi a e Estatística. Pesquisa Nacional por Amostra de Domicílio: acesso e utilização de serviços de saúde: 2003. Rio de Janeiro: IBGE; 2005.
Sample was selected using a two-stage cluster sampling scheme. First, 60 of the 186 census tracts of Lages were randomly selected using a random sampling scheme without replacement. Next, a block was randomly selected and, on it, a corner was thus selected as the starting point of households to be visited, with the fi eld work beginning clockwise. A total of 34 individuals and 17 households were included per census tract.
Exclusion criteria included institutionalized individuals (those staying in prisons, hospices, or hospitals), ampu-tees, bedridden individuals, those with casts, those who could not remain in the adequate position for the required anthropometric measurements and those who were considered handicapped, thus unable to answer the questionnaire. Losses corresponded to residents in randomly selected households that were visited at least four times by the research team, including a minimum of one visit on weekends and another at night time, when the examiner/interviewer could not locate the selected person or when they refused to participate.
Household visits were conducted by ten pairs of interviewers, all supervised. Field interviewers were trained and remained unaware of the study objectives. Data were collected using face-to-face interviews and included the taking of participants’ blood pressure in two moments (at the beginning and end of the appli-cation of questionnaire) and anthropometric measure-ments. Training and a pre-test of the questionnaire with 30 adults aged between 20 and 59 years, living in an area covered by a local health unit, were conducted. The pilot study was performed with 90 individuals in one of the randomly selected census tracts. This research project was widely promoted by the local media (most popular radio station, television and local newspaper), aiming to increase adherence. Data collection quality control was performed in 10% of the sample, using telephone interviews conducted by one of the supervisors.
The outcome of the study was self-rated general health, obtained through the following question: “Compared to people of your age, how would you rate your health in general?”. “Excellent”, “very good” and “good” responses were grouped in the positive self-rated health category, whereas “fair” and “poor” responses were grouped in the negative self-rated health category.
self-reported health morbidities. Socio-demographic variables were: age (20 to 29, 30 to 39, 40 to 49 and 50 to 59 years); level of education (≤ 4, 5 to 8, 9 to 11, ≥12 complete years); per capita family income in reais, calculated as the sum of the previous month income, divided by the number of residents in the house (one minimum wage was equivalent to R$ 380.00 or approxi-mately U$ 211.00 at the time of this study), and catego-rized according to quartiles (0.026-0.500; 0.510–0.880; 0.890–1.580; 1.590–19.740); self-reported ethnicity (black, mixed, white, Asian, indigenous); and marital status (with a partner and without a partner).
Health-related behavior and habits included smoking
(non-smoker, former smoker, and current smoker;22
level of physical activity (suffi cient, ≥150 minutes/ week, and insuffi cient, <150 minutes/week), measured by the short version in Portuguese of the International Physical Activity Questionnaire (IPAQ);10 and problems
with alcohol, surveyed with the Cut Down, Annoyed, Guilty, Eye-opener (CAGE) Questionnaire, previously validated in Brasil.15 Individuals who showed CAGE
values ≥ 1 were those considered to have problems
associated with alcohol use.
Blood pressure levels were measured at the begin-ning and end of questionnaire application (at least ten minutes) and the second measurement was considered. Measurements were carried out with the interviewee in a sitting position, with feet on the fl oor, left arm resting on a table at the level of the heart and palm facing upward. Electronic equipment with a digital reading system(Techline®), which had been adequately calibrated, was used to measure blood pressure levels. Systolic and diastolic pressure levels were categorized into normal and high. Individuals with a systolic pres-sure >140 mmHg (PAS>140 mmHg) and/or diastolic pressure >90 mmHg (PAD>90 mmHg), or hypertensive individuals who had been regularly using anti-hyperten-sive drugs were considered to have high blood pressure levels.4 Body weight was measured with individuals
wearing light clothes, barefoot, in an upright position, with the feet together and arms extended alongside the body, with the palms facing the legs. Weight was measured using portable digital scales (Tanita®) with a 0.1 kg accuracy and 150 kg capacity; participants were weighed only once. Height was taken by fi xing an inelastic measuring tape on a vertical surface without a skirting board, at a height of 100 cm from the fl oor, with the use of adhesive tape. Individuals were measured without their shoes, wearing nothing on their heads, standing with their heels together and these, gluteal region, shoulders and head touching the vertical surface of the wall, and looking straight ahead while breathing in. Weight and height were used to calculate the body mass index (BMI). Individuals were categorized as follows: eutrophic (BMI < 25 kg/m2),
overweight (25.0 kg/m2≤ BMI ≤ 29.9 kg/m2) or obese
(BMI ≥ 30 kg/m2).22 Measurement of the natural line
with the smallest waist circumference was taken with the use of the same measuring tape, with the individual standing and while breathing out. Cut-off values for normality were ≤ 102 cm in men and ≤ 88 cm in women, considering individuals with values higher than these to have abdominal obesity.18
Participants were asked about a medical diagnosis of diabetes mellitus, self-reported wheezing in the last 12 months, breathlessness while walking fast on a straight surface or gentle slope, and diagnosis of chronic bronchitis.17
The occurrence of episodes of toothache in the six months prior to interview and the number of natural teeth present in each jaw (ten natural teeth or more; fewer than ten natural teeth; no natural teeth) were also assessed.
A variable that combines all self-reported general health and oral conditions was created and categorized as follows: none, one, two, or three or more self-reported morbidities.
Data were entered in duplicate in the Epi-Info software, version 6.04,by previously trained keyboarders. After verifying the reliability of data, statistical analyses were carried out using the STATA statistical package, version 9.0.
This research project was approved by the Research Ethics Committee of the Universidade do Planalto Catarinense, under protocol 001/2007, in November 2006. Participants in this study signed an informed consent form.
RESULTS
Response rate was 98.6%, which represents 2,022 individuals, of which 61.5% were women. Estimated general prevalence of positive self-rated health was 74.2% (95% CI: 71.3;77.0); among men, this preva-lence was 82.3% (95% CI: 79.3;85.0), while, among women, 66.9% (95% CI: 63.2;70.7).
In both sexes, there was a greater proportion of younger individuals, with higher income and level of education and whose ethnicity was white or Asian, who rated their health as positive than those who were poorer, less educated and either black or indigenous. Among men, the absence of a partner was associated with posi-tive self-rated health, whereas ethnicity did not show statistical signifi cance. The highest proportion of posi-tive self-rated health was observed in men with level
of education equal to or higher than 12 years (91.1%), while the lowest proportion was among women with four or less years of study (44.7%) (Table 1).
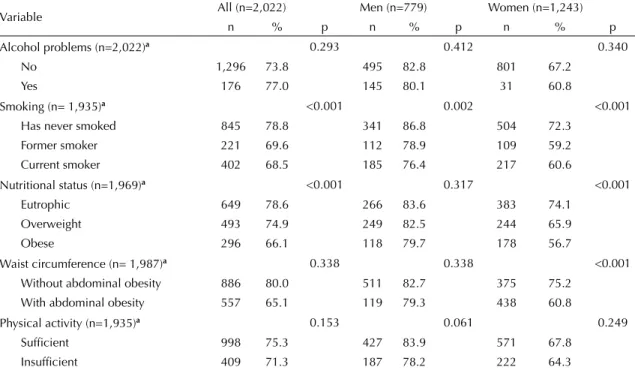
More non-smoking and eutrophic individuals rated their health as positive. Among men, only smoking was asso-ciated with negative self-rated health. The proportion of positive self-rated health was higher in those who had never smoked, followed by former smokers and, last of all, current smokers. To be physically active did not achieve statistical signifi cance with positive self-rated health in men. Among women, in addition to smoking, nutritional status and waist circumference were associ-ated with negative self-rassoci-ated health. Women who were overweight and obese and those with abdominal obesity considered their health to be negative (Table 2).
The lowest proportions of individuals who rated their health as positive were found in adults with high blood pressure levels, those who reported having diabetes, wheezing, breathlessness, bronchitis and a lower number of natural teeth present. The higher the number of morbidities, the lower the proportion of individuals with positive self-rated health (Table 3).
Table 1. Positive self-rated health, according to demographic and socioeconomic characteristics in adults. City of Lages, Southern Brazil, 2007.
Variable
All (n=2,022)
Men (n=779)
Women (n=1,243)
n % p n % p n % p
Positive self-rated health (n = 2,002) 1,472 74.2 640 82.3 832 66.9 Ethnicity (n=2,017)a 0.001 0.057 <0.001
White and Asian 969 77.7 421 84.0 548 70.9 Black, mixed and indigenous 499 67.5 216 78.5 283 60.5 Per capita household income (n=1,984)b <0.001 <0.001 <0.001
4th quartile 404 87.0 182 89.2 222 84.4
3rd quartile 392 77.4 177 84.7 215 70.3
2nd quartile 347 71.0 153 80.1 194 62.8
1st quartile 300 61.3 116 71.6 184 54.1
Level of education (years)(n=1,995)b <0.001 <0.001 <0.001
≥ 12 406 89.3 164 91.1 242 87.7
9 to 11 505 83.6 225 88.9 280 78.2
5 to 8 369 66.6 182 77.4 187 55.7
≤ 4 176 50.6 63 60.6 113 44.7
Age group (years) (n=2,018)b <0.001 <0.001 <0.001
20 to 29 522 84.7 233 89.6 288 79.6
30 to 39 350 80.0 151 86.3 199 74.0
40 to 49 356 69.0 144 78.7 212 61.4
50 to 59 240 58.5 109 69.0 131 49.4
Marital status (n=2,017)a 0.032 0.009 0.273
With a partner 1,410 72.7 442 80.1 565 65.9 Without a partner 607 77.4 197 87.2 263 69.0
Table 4 shows the crude and adjusted prevalence ratios between negative self-rated health and variables in men. Among socioeconomic and demographic vari-ables, the following were associated with negative self-rated health: per capita income, level of educa-tion and age. Poorer, less educated and older men had higher prevalences of negative self-rated health, when compared to richer, more educated and younger ones. Smoking and physical activity lost their association with each other when adjusted for socioeconomic and demographic variables. Among the morbidities analyzed, the following continued to be associated with negative self-rated health after adjustment: having high blood pressure levels and reporting wheezing, whereas breathlessness was on the borderline of association. The number of morbidities was strongly associated with negative self-rated health. Prevalence ratios varied between 2.3 and 5.0 in men with one morbidity and those with three or more morbidities, respectively.
Among women, negative self-rated health was strongly associated with per capita household income, level of education and age. Prevalence of negative self-rated health was higher in poorer, less educated and older women and those who had abdominal obesity. These associations remained after adjustment for more distal variables. Among associated morbidities in the crude analysis, only high blood pressure levels, diabetes,
wheezing and breathlessness remained associated with the outcome after adjustment. Like men, the number of morbidities was strongly associated with negative self-rated health (Table 5).
DISCUSSION
A total of ¾ of the population studied rated their health as positive, with signifi cant differences according to sex, age, income and level of education. Older, poorer and less educated individuals and women considered their health to be worse. The higher the number of self-reported comorbidities, the greater the proportion of individuals with negative self-rated health. The magnitude of effect of morbidities in women was higher than in men. These results are in accordance with those from the World Health Survey performed in Brazil and the 1998 National Household Sample Survey.1,5,20,21
Levels of education interfere with the perception of health, understanding of information about health promotion and prevention, adoption of healthy life-styles, adherence to therapeutic treatments and use of health services.e By selecting a response, the participant
indicates their general health status, considering the physical, social and psychological/mental dimensions. Studies suggest that the physical dimension seems to have more infl uence on self-rated health.f
e Ministério da Saúde Comissão Nacional sobre Determinantes Sociais de Saúde. As causas sociais das iniqüidades em saúde no Brasil: relatório fi nal. Brasília, DF; 2008.
f Barros MBA. Auto-avaliação de saúde. In: Cesar CLG, Carandina L, Alves MCGP, Barros MBA, Goldbaum M. Saúde e condição de vida em São Paulo. Inquérito multicêntrico de saúde no Estado de São Paulo – ISA-SP. São Paulo: USP/FSP; 2005. p.173-82.
Table 2. Positive self-rated health, according to health-related habits, nutritional status and waist circumference in adults. City of Lages, Southern Brazil, 2007.
Variable All (n=2,022) Men (n=779) Women (n=1,243)
n % p n % p n % p
Alcohol problems (n=2,022)a 0.293 0.412 0.340
No 1,296 73.8 495 82.8 801 67.2
Yes 176 77.0 145 80.1 31 60.8
Smoking (n= 1,935)a <0.001 0.002 <0.001
Has never smoked 845 78.8 341 86.8 504 72.3 Former smoker 221 69.6 112 78.9 109 59.2 Current smoker 402 68.5 185 76.4 217 60.6
Nutritional status (n=1,969)a <0.001 0.317 <0.001
Eutrophic 649 78.6 266 83.6 383 74.1 Overweight 493 74.9 249 82.5 244 65.9
Obese 296 66.1 118 79.7 178 56.7
Waist circumference (n= 1,987)a 0.338 0.338 <0.001
Without abdominal obesity 886 80.0 511 82.7 375 75.2 With abdominal obesity 557 65.1 119 79.3 438 60.8
Physical activity (n=1,935)a 0.153 0.061 0.249
Suffi cient 998 75.3 427 83.9 571 67.8 Insuffi cient 409 71.3 187 78.2 222 64.3
The effect of self-rated health on the risk of death varies according to the level of education and income. Poor self-rated health is strongly associated with mortality in adults with high level of education and/or income.8
The results of this study agree with those of Dachs,5
who found that 70% of individuals belonging to the
fi rst decile of income had a positive self-rated health, whereas this value totaled 87% among those in the upper decile. Higher income is associated with the acquisition of assets and products, including medications, greater access to leisure activities and greater work autonomy, aspects related to health. Individuals with a higher level of education reported multidimensional aspects such as feelings of physical and psychological well-being, being physically active and not having diseases, when compared to those who were less educated. These tend to assess their health by associating it with physical and functional aspects.12
The prevalence of negative self-rated health increased signifi cantly with age, as exemplifi ed by what occurred with the results of the State of São Paulo Multicenter Health Survey(ISA-SP).f In the present study, younger
individuals considered their health to be good. Among these, there was a different in perception according to sex; men rated their health in a more positive way. The proportion of positive self-rated health in women in the 30-to-39-year age group was similar to that of men in the 40-to-49-year age group. By using more health services, women can have a greater proportion of diagnoses of diseases and report more complaints than men.14-16
The percentages of dissatisfaction with one’s own health increased with age in women, thus corroborating the results of Brazilian1,21 and international studies.2,13,g
Smoking, physical activity, diabetes, symptoms of bron-chitis and number of natural teeth present lost statis-tical signifi cance when adjusted for groups of distal
Table 3. Positive self-rated health, according to high blood pressure levels and self-reported morbidities in adults. City of Lages, Southern Brazil, 2007.
Variable All Men Women
n % p n % p n % p
Blood pressure levels (n=2,016)a <0.01 <0.01 <0.01
Normal 1,041 79.3 416 86.7 625 73.3
High 426 64.4 222 74.7 204 52.8
Diabetes (n=2,012)a <0.01 0.01 <0.01
No 1,402 76.1 612 83.2 790 69.5
Yes 62 46.5 24 61.5 38 38.0
Wheezing (n=2,019)a <0.01 <0.01 <0.01
No 1,255 79.2 557 86.6 698 72.0
Yes 215 53.9 82 60.7 133 48.9
Breathlessness (n=1,933)a <0.01 <0.01 <0.01
No 1,044 84.5 501 86.8 543 81.5
Yes 376 55.7 113 66.5 263 50.6
Symptoms of bronchitis (n=2,008)a <0.01 <0.01 <0.01
No 1,420 75.9 618 83.9 802 68.5
Yes 49 48.9 20 51.3 29 46.8
Natural teeth present (n=2,018)b <0.001 <0.01 <0.01
≥ 20 1,054 82.6 484 86.6 570 78.1
10 a 19 247 69.6 104 80.6 143 60.9
<10 168 47.0 50 56.2 118 42.8
Joint effects (n=1,905)b <0.001 <0.001 <0.001
No morbidities 460 93.2 217 94.8 243 91.4 1 morbidity 507 80.5 232 84.1 275 76.6 2 morbidities 278 69.9 105 78.4 173 63.8 3 or more morbidities 154 42.7 50 51.5 104 38.1
a Chi-square test; b Linear trend test.
variables, suggesting that these factors act as mediators between social conditions and self-rated health.
The major sources of bias in cross-sectional studies are associated with selection and reverse causality
or temporal bias. The hypothetical theoretical model adopted simulates a determination model, although it is not possible to guarantee that the chain of determination established actually occurred. This theoretical exercise is preferable to the mere entry of variables according
Table 4. Association between negative self-rated health and demographic, socioeconomic variables, health-related types of behavior and self-reported morbidities in adult men. City of Lages, Southern Brazil, 2007.
Variable Crude Adjusted
PR 95% CI p PR 95% CI p
Ethnicitya 0,049 0,306
Black, mixed, indigenous 1,3 1,0;1,8 1,2 0,9;1,6
Per capita household incomea <0,001 0,044 3rd quartile 1,4 0,9;2,2 1,3 0,8;1,9
2nd quartile 1,8 1,2;2,8 1,6 1,0;2,5
1st quartile 2,6 1,6;4,2 1,8 1,0;3,2
Level of education (years)a <0,001 0,001
9 to 11 1,2 0,7;2,3 1,2 0,6;2,1
5 to 8 2,5 1,5;4,2 1,9 1,0;3,3
≤ 4 4,4 2,7;7,2 2,6 1,4;4,8
Age (years)a <0,001 0,001
30 to 39 1,2 0,8;2,1 1,1 0,6;1,8
40 to 49 2,1 1,3;3,3 1,6 1,0;2,7
50 to 59 3,0 2,0;4,5 2,4 1,4;3,9
Marital statusa 0,012 0,682
Without a partner 0,6 0,5;0,9 1,1 0,7;1,6
Smokingb 0,004 0,131
Former smoker 1,6 1,0;2,6 1,1 0,7;1,9 Current smoker 1,8 1,2;2,6 1,3 0,9;2,0
Physical activityb 0,087 0,075
Insuffi cient 1,4 1,0;1,9 1,3 1,0;1,8
Blood pressure levelsc <0,001 0,047
High 1,9 1,4;2,6 1,5 1,0;2,2
Diabetesc 0,001 0,793
Yes 2,3 1,4;3,6 1,2 0,7;2,0
Wheezingc <0,001 0,004
Yes 2,9 2,1;4,0 1,7 1,2;2,5
Breathlessnessc <0,001 0,057
Yes 2,5 1,9;3,4 1,4 1,0;2,0
Symptoms of bronchitisc <0,001 0,224
Yes 3,0 2,0;4,5 1,4 0,8;2,4
Natural teeth present <0,001 0,182
10-19 1,4 1,1;2,0 0,8 0,5;1,2
< 10 3,3 2,4;4,4 1,4 0,9;2,2
Joint effectsd <0,001 <0,001
1 morbidity 3,0 1,6;6,0 2,3 1,2;4,5 2 morbidities 4,1 1,9;8,8 2,7 1,3;5,3 3 or more morbidities 9,2 4,7;18,1 5,0 2,5;10,1
a Distal variables, adjusted among themselves; b Intermediate variables, adjusted among themselves and for group 1 variables; c Proximal variables, adjusted among themselves and for groups 1 and 2 variables; d Proximal variable, adjusted for groups 1
to mostly statistical criteria. In the present study, a representative sample of the population aged between 20 and 59 years of the city and a response rate higher
than 90% were obtained, in addition to the sample being homogeneously distributed among age groups. However, the proportion of women in the sample was
Table 5. Association between negative self-rated health and demographic and socioeconomic variables, health-related types of behavior and self-reported morbidities in adult women. City of Lages, Southern Brazil, 2007.
Variable Crude Adjusted
PR 95% CI p PR 95% CI p
Ethnicitya 0,001 0,230
Black, mixed, indigenous 1,4 1,1;1,6 1,1 0,9;1,3
Per capita household incomea <0,001 <0,001
2nd quartile 1,9 1,3;2,8 1,7 1,2;2,5
3rd quartile 2,4 1,7;3,3 1,9 1,3;2,8
4th quartile 2,9 2,1;4,2 2,1 1,5;3,0
Level of education (years)a <0,001 <0,001
9-11 1,8 1,1;2,8 1,5 0,9;2,5
5-8 3,6 2,4;5,4 2,4 1,5;3,8
≤ 4 4,5 3,0;6,7 2,6 1,6;4,1
Age (years)a <0,001 <0,001
30 to 39 1,3 1,0;1,6 1,0 0,8;1,3
40 to 49 1,9 1,5;2,4 1,6 1,3;1,9
50 to 59 2,5 2,0;3,1 1,9 1,5;2,4
Smokingb <0,001 0,160
Former smoker 1,5 1,2;1,9 1,1 0,9;1,4 Current smoker 1,4 1,2;1,7 1,1 1,0;1,4
Nutritional statusb <0,001 0,975
Overweight 1,3 1,1;1,6 0,9 0,7;1,1
Obese 1,7 1,4;2,0 1,0 0,7;1,3
Waist circumferenceb <0,001 0,034
With abdominal obesity 1,6 1,4;1,8 1,3 1,1;1,6
Blood pressure levelsc <0,001 0,042
High 1,8 1,5;2,1 1,2 1,0;1,4
Diabetesc <0,001 0,009
Sim 2,0 1,7;2,4 1,3 1,1;1,6
Chiado no peitoc <0,001 0,006
Yes 1,8 1,6;2,1 1,3 1,1;1,5
Wheezingc <0,001 <0,001
Yes 2,7 2,2;3,3 1,9 1,5;2,4
Breathlessnessc <0,001 0,976
Yes 1,7 1,3;2,2 1,0 0,7;1,4
Symptoms of bronchitic <0,001 0,298
10 to 19 1,8 1,4;2,3 1,2 0,9;1,6
<10 2,6 2,1;3,2 1,2 0,9;1,6
Joint effectsd <0,001 <0,001
1 morbidity 2,7 1,8;4,0 2,2 1,5;3,1 2 morbidities 4,2 2,8;6,3 2,8 1,9;4,3 3 or more morbidities 7,2 5,0;10,3 4,2 2,9;6,1
a Distal variables, adjusted among themselves; b Intermediate variables, adjusted among themselves and for group 1 variables; c Proximal variables, adjusted among themselves and for groups 1 and 2 variables; d Proximal variable, adjusted for groups 1
higher than that of the population, thus leading to the decision of performing global analyses weighted by sex. All data collection instruments adopted in this study have been validated and used in Brazil and abroad. Likewise, measure instruments (weight, height and blood pressure) were calibrated. The data collection team was trained and standardized and this collection underwent quality control, which contributed to the internal validity of the study.
The literature on the theme adopts different forms of
outcome categorization. The Inquérito de Saúde do
Estado de São Paulo (for individuals aged more than
60 years) used the Medical Outcome Study 36-item Short Form Health Survey (SF 36), validated in Brazil. According to Theme-Filha,21 studies based on
health interviews in Barcelona, Spain, and the 1998 PNAD used the following categories: very good, good, fair, poor and very poor, similarly to those adopted by the 2003 World Health Survey in Brazil
(very good, good, average, poor and very poor). In the 1996 National Health Interview Survey and Current Population Survey, conducted in the United States, and in the Health and Social Survey, conducted in Quebec, Canada, the alternatives were the same adopted in the present study,21 whereas the longitudinal study in
electrical and gas workers in France (GAZEL study) used a scale with eight categories, ranging from very good to very poor.9 These methodological differences
hinder comparisons among studies.
1. Barata RB, Almeida MF, Montero CV, Silva ZP. Health inequalities based on ethnicity in individuals aged 15 to 64, Brazil, 1998. Cad Saude Publica.
2007;23(2):305-13. DOI: 10.1590/S0102-311X2007000200006
2. Beltrão KI, Sugahara S. Comparação de informações sobre saúde das populações brasileira e norte-americana baseada em dados PNAD/98 e NHIS/96.
Cienc Saude Coletiva. 2002;7(4):841-67.
DOI:10.1590/S1413-81232002000400017 3. Bruin A, Picavest HSJ, Nossikov A, editors. Health
interview surveys: toward international harmonization of methods and instruments. Copenhagen: WHO; 1996. (Regional Publication European Series, 58). 4. Chobanian AV, Bakris GJ, Black HR, Cushman WC,
Green LA, Izzo JL Jr, et al. The Seventh Report of the Joint National Committee on Prevention, Detection, Evaluation, and Treatment of High Blood Pressure: the JNC 7 report. JAMA. 2003;289(19):2560-72.
5. Dachs JNW. Determinantes das desigualdades na autoavaliação do estado de saúde no Brasil: análise dos dados da PNAD/1998. Cienc Saude
Coletiva. 2002;7(4):641-57.
DOI:10.1590/S1413-81232002000400004
6. Dachs JNW, Santos APR. Auto-avaliação do estado de saúde no Brasil: análise dos dados da PNAD/2003.
Cienc Saude Coletiva. 2006;11(4):887-94.
DOI:10.1590/S1413-81232006000400012 7. DeSalvo KB, Bloser N, Reynolds K, He J, Muntner
P. Mortality prediction with a single general self-rated health question: a meta-analysis. J Gen Intern Med. 2006;21(3):267-75. DOI:10.1111/j.1525-1497.2005.00291.x
8. Dowd JB, Zajacova A. Does the predictive power of self-rated health for subsequent mortality risk vary by socioeconomic status in the US? Int J Epidemiol. 2007;36(6):1214-21. DOI:10.1093/ije/dym214 9. Goldberg M, Chastang JF, Leclerc A, Zins M, Bonenfant
S, Bugel I, et al. Socioeconomic, demographic, occupational, and health factors associated with participation in a long-term epidemiologic survey: a prospective study of the French GAZEL cohort and its target population. Am J Epidemiol. 2001;154(4):373-84. DOI:10.1093/aje/154.4.373
10. Hallal PC, Dumith SC, Bastos JP, Reichert FF, Siqueira FV, Azevedo MR. Evolução da pesquisa epidemiológica em atividade física no Brasil: revisão sistemática. Rev Saude Publica. 2007;41(3):453-60. DOI:10.1590/S0034-89102007000300018 11. Höfelmann DA, Blank N. Auto-avaliação de saúde
entre trabalhadores de uma indústria no sul do Brasil.
Rev Saude Publica. 2007;41(5):777-87. DOI:10.1590/
S0034-89102007000500012
12. Huisman M, van Lenthe F, Mackenbach J. The predictive ability of self-assessed health for mortality in different educational groups. Int J Epidemiol.
2007;36(6):1207-13. DOI:10.1093/ije/dym095 13. Kelleher CC, Friel S. Nic Gabhainn S, Tay JB.
Socio-demographic predictors of self- rated health in the Republic of Ireland: fi ndings from the National Survey on Lifestyle, Attitudes and Nutrition, SLAN. Soc
Sci Med. 2003;57(3):477-86.
DOI:10.1016/S0277-9536(02)00371-4
14. MacIntyre S, Ford G, Hund K. Do women “over-report” morbidity? Men’s and women’s responses to structured prompting on a standard question on long standing illness. Soc Sci Med. 1999;48(1):89-98. DOI:10.1016/ S0277-9536(98)00292-5
15. Masur J, Monteiro MG: Validation of the “CAGE” alcoholism screening test in a Brazilian psychiatric in patient hospital setting. Braz J Med Biol Res.
1983;16(3):215-8.
16. Mendoza-Sassi R, Béria JU, Fiori N, Bortolotto A. Prevalência de sinais e sintomas, fatores sociodemográfi cos associados e atitude frente aos sintomas em um centro urbano no Sul do Brasil. Rev
Panam Salud Publica. 2006;20(1):22-8. DOI: 10.1590/
S1020-49892006000700003
17. Menezes AMB, Victora CG, Padilla RP. The Platino project: methodology of a multicenter prevalence survey of chronic obstructive pulmonary disease in major Latin American Cities. BMC Med Res Mehtodol. 2004;17(4):15. DOI:10.1186/1471-2288-4-15 18. National Institutes of Health. Clinical Guidelines
on the Identifi cation, Evaluation, and Treatment of Overweight and Obesity in Adults: the evidence report. Obes Res. 1998;6 Suppl. 2:S51-209. 19 Szwarcwald CL, Souza-Júnior PRB, Esteves MA,
Damacena GN, Viacava F. Socio-demographic of self-rated health in Brazil. Cad Saude Publica. 2005;21(Supl. 1):554-64. DOI:10.1590/S0102-311X2005000700007
20. Theme-Filha MM, Szwarcwald CL, Souza-Júnior PRB. Socio-demographic characteristics, treatment coverage, and self-rated health of individuals who reported six chronic diseases in Brazil, 2003. Cad Saude Publica.
2005;21(suppl.1):S43-53. DOI: 10.1590/S0102-311X2005000700006
21. Theme Filha MM, Szwarcwald CL, Souza Junior PRB. Medidas de morbidade referida e inter-relações com dimensões de saúde. Rev Saude
Publica. 2008;42(1):73-81.
DOI:10.1590/S0102-311X2005000700006
22. World Health Organization. Obesity: preventing and managing the global epidemic of obesity. Geneva; 2004.
REFERENCES
Matos IB was funded by the Fundo de Incentivo a Pesquisa of the Universidade do Planalto Catarinense – (research support fund, Process 2006/12).