SPEECH PERCEPTION TEST HINT BRAZIL
IN GROUPS OF SUBJECTS EXPOSED
AND NOT EXPOSED TO OCCUPATIONAL NOISE
Teste de percepção da fala HINT Brasil em grupos
de sujeitos expostos e não expostos a ruído ocupacional
Aline de Moraes Arieta(1), Christiane Marques do Couto(2), Everardo Andrade da Costa(3)
(1) Speech Therapist; PhD in Public Health, Faculty of Medical
Sciences, University of Campinas – UNICAMP, Campinas, SP, Brazil; Master in Public Health Epidemiology at the Uni-versity of Campinas, UNICAMP.
(2)Speech Therapist; Professor of Audiology at the University
of Campinas, SP, Brazil; PhD in the Faculty of Medicine, University of São Paulo – USP.
(3) Otorhinolaryngologist; Collaborating Professor of
Otorhino-laryngology, Head and Neck Surgery, Faculty of Medical Sciences, University of Campinas – UNICAMP, Campinas, SP, Brazil; PhD in Public Health from the University of Cam-pinas – UNICAMP.
Funding: FAPESP
Conlict of interests: non-existent
The analysis of the speech perception threshold
relects the recognizing abilities by simulating a daily
hearing situation, when tested with a competitor noise2,3.
Subjects with or without hearing loss exposed
to noise seldom complain about this condition, but
often complain about speech perception dificulties,
especially in a noisy environment4.
The necessity to observe the HINT technology
results in the normal hearing group exposed and not exposed to occupational noise came from the indings of a previous study where a normal hearing
group had the worst results in a speech perception
test when exposed to noise5. Hearing loss affects
speech identiication in noise affecting two mecha -nisms: audibility, especially on high frequencies where the speech sounds are in a minor intensity, and distortion, which reduces the speech detection in noise6. Noise induced hearing loss (NIHL) is
considered one of the worst health problems in
ABSTRACT
Purpose: investigate the difference in the signal to noise ratio in subjects exposed and not exposed
to occupational noise, with and without hearing loss using the Hearing in Noise Test, version in Portuguese of Brazil. Method: 206 subjects, 49 females and 157 males were evaluated and divided :
56 normal hearing without noise exposure (Group 1); 70 normal hearing exposed to occupational noise (Group 2); 80 exposed occupational noise with sensorineural hearing loss (Group 3). We analyzed the
signal to noise ratio using the HINT Brazil in four presentation conditions: S-no noise, NF-noise front, NR-noise right, NL- noise left; RC-noise composite (weighted average of presentations with noise ) and the results were recorded in dB. Results: the mean values obtained were: G1: 25.0 (S), –5.0 (NF),
–12.3 (NR), –12.4 (NL) and –8.7 (NC); G2 : 26.4 (S), –4.7 (NF), –11.9 (NR), –11.9 (NL) and –8.3 (NC); G3: 34.1 (S) – 2.8 (NF), –8.9 (NR), –8.8 (NL), –5.8 (NC). Conclusion: there was signiicant difference
between the values of the group of unexposed subjects (G1) with the above (G2) only on condition Noise Composite (NC). The group of subjects with hearing loss (G3) showed a signiicant difference in the groups G1 and G2, with worse performance in all conditions. The worst performance for speech understanding in noise was related to the degree of hearing loss and noise exposure.
KEYWORDS: Hearing; Speech Perception; Hearing Tests; Speech Discrimination Tests; Noise
INTRODUCTION
workers7, beyond the fact that is part of great
discus-sions regarding public health in Brazil8. Speech
recognition of sentences in silence and noise in workers with NIHL may appear in lower degrees of
loss and increase signiicantly in higher degrees9.
Speech perception tests with competitive noise in low redundancy situations that contemplate a wide analysis of hearing disabilities and amplify
logo-audiometric tests indings, are not frequently used in the country, especially in subjects exposed
to occupational noise10,11.
The Hearing in Noise Test (HINT) appears as a strategy to improve the Speech Recognition Test (SRT) metering. Developed in 199412, it has
been utilized in different languages and population groups. In Brazil, recently standardized in normal hearing groups13, is based in an adaptive test
technique, where the sentence presentation level increases or decreases accordingly to a spectral noise in own speech14. Speech perception test
are realized with monosyllables or polysyllables routinely. It’s really important the use of phonetic
context sentences with HINT, word familiarity, intonation variation and inluence level intelligibility
in noise. In many countries HINT is used in workers
screening, especially where hearing plays a vital or important role in the job15,16.
The purpose of this study was to research the differences in speech to noise ratio in subjects
exposed and not exposed to occupational noise
with and without hearing loss by using the HINT, version in Portuguese from Brazil.
METHOD
After the approval of the local Research Ethic Committee, 206 subjects were analyzed at the Occupational Otorhinolaringology Ambulatory and
were divided in 3 groups: G1 – 56 subjects with normal hearing non-exposed to occupational noise; G2 – 70 subjects with normal hearing exposed to occupational noise; G3 – 80 subjects with sensori
-neural hearing loss exposed to occupational noise. G3 was initially divided in two subgroups: subjects exposed to suggestive and non-suggestive occupa -tional noise NIHL in order to verify the homogeneity
between these subgroups. Mann-Whitney statis -tical analyzes demonstrate homogeneity in every
variable. Thus, G3 was classiied as a hearing loss
subject group. Below are the results.
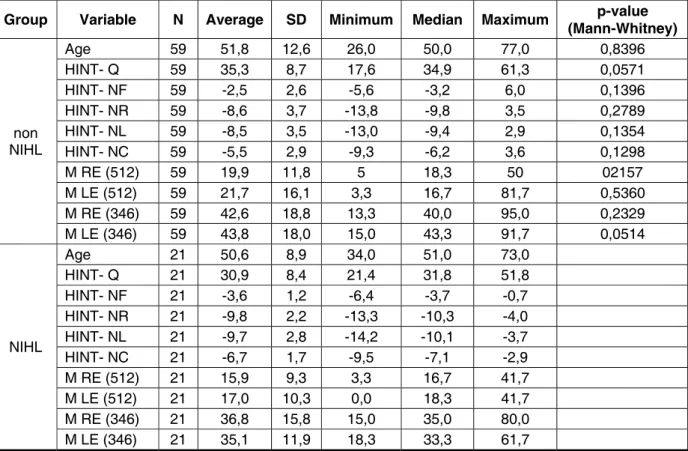
Group Variable N Average SD Minimum Median Maximum p-value
(Mann-Whitney)
non NIHL
Age 59 51,8 12,6 26,0 50,0 77,0 0,8396
HINT- Q 59 35,3 8,7 17,6 34,9 61,3 0,0571
HINT- NF 59 -2,5 2,6 -5,6 -3,2 6,0 0,1396
HINT- NR 59 -8,6 3,7 -13,8 -9,8 3,5 0,2789
HINT- NL 59 -8,5 3,5 -13,0 -9,4 2,9 0,1354
HINT- NC 59 -5,5 2,9 -9,3 -6,2 3,6 0,1298
M RE (512) 59 19,9 11,8 5 18,3 50 02157
M LE (512) 59 21,7 16,1 3,3 16,7 81,7 0,5360
M RE (346) 59 42,6 18,8 13,3 40,0 95,0 0,2329
M LE (346) 59 43,8 18,0 15,0 43,3 91,7 0,0514
NIHL
Age 21 50,6 8,9 34,0 51,0 73,0
HINT- Q 21 30,9 8,4 21,4 31,8 51,8
HINT- NF 21 -3,6 1,2 -6,4 -3,7 -0,7
HINT- NR 21 -9,8 2,2 -13,3 -10,3 -4,0
HINT- NL 21 -9,7 2,8 -14,2 -10,1 -3,7
HINT- NC 21 -6,7 1,7 -9,5 -7,1 -2,9
M RE (512) 21 15,9 9,3 3,3 16,7 41,7
M LE (512) 21 17,0 10,3 0,0 18,3 41,7
M RE (346) 21 36,8 15,8 15,0 35,0 80,0
M LE (346) 21 35,1 11,9 18,3 33,3 61,7
HINT application conditions: Q- Quiet; NF- Noise Front; NR- Noise Right; NL- Noise Left; NC- Noise Composite
500, 1000 and 2000 Hz average frequencies were used by serving as a daily hearing ability metering indicator. Over 2000 Hz frequencies, which help in speech perception, were also used9
The criteria used to determine the groups were:
– G1: adult, Brazilian Portuguese native speaker,
presenting normal tonal hearing threshold until 25 dB, from 250 to 8000Hz17, without
speech perception impairment in noise, good comprehension of the instructions and
non-exposed to noise.
– G2: adult, Brazilian Portuguese native speaker,
working for a period longer than 1 year, 8 hours per
day exposed to occupational noise, presenting
normal tonal hearing threshold until 25 dB, from 250 to 8000Hz and good comprehension of the instructions.
– G3: adult, Brazilian Portuguese native speaker,
working for a period longer than 1 year, 8
hours per day exposed to occupational noise,
presenting sensorineural hearing loss. In other words, hearing threshold over 25 dB in at least one of the 250 to 8000Hz frequencies, bilaterally.
The exclusion criteria to every group were: neuro
-logical and/or verbal luency changes, middle ear
impairment, cerumen stopper or sentences hearing
dificulty. To G1 and G2: adults or elderly with
hearing loss and complains on speech perception
in noise. To G3: adults or elderly with mixed or
conductive and unilateral hearing loss.
In G1, a total of 56 subjects (57,1% females and 42,8% males) with 27,5 years average age (standard deviation = 9,2) were analyzed. G2 was composed by 70 subjects (8,5% females and 91,4% males)
with 37 years average age (standard deviation = 10,9) and 11,2 years (standard deviation = 8,5)
of exposure to noise. In G3, 80 subjects (13,7% females and 86,2% males) with the average age of
51,5 years (standard deviation = 11,9) and average
exposure to noise of 19,5 years (standard deviation
= 8,5) participated in this study.
An external auditory canal inspection was
done in order to guarantee any change in the middle ear. Participants were submitted to a basic hearing anamnesis, threshold tonal audiometry, followed by the application of the speech tests using headphones. The results processed by the system were stored.
HINT utilizes a microprocessor HTD (Hearing Test Device) version 7.2 Audiometric System, produced by Bio-Logic, developed at House Ear Institute, Los Angeles, USA, in 199412.
HINT contains 12 lists of 20 sentences each, digitally recorded which can be presented in silence and noise. Those sentences are standardized
accordingly to the language, dificulty, intelligibility
and phonetic distribution.
The test application varies from 2 minutes for the 12 sentences list and 3-4 minutes for the 20 sentences list. Sentences were presented by a
male speaker in quiet and in noise ixed at 65 dB
(A), accordingly to the established standards. The equipment presents the recorded sentences with a male professional voice and a competitive noise created from the same voice spectrum. It also conducts the whole test procedure, including the tonal audiometry.
Speech and noise were presented with headphones in four conditions: Quiet (Q), noise front (NF), noise right (NR) and noise left (NL). The processor also calculates the noise composite (NC) by the weighted average of the three noise results:
NC = 2 x (NF + NR + NL) / 4
Each subject sits inside an audiometric booth in order to perform the test. The previously recorded signal and noise stimuli are played to the headphones by the equipment programmed to simulate the stimuli localization.
HINT selects randomly 1 in 12 sentence lists and its presentation follows the up-down strategy, which allows the determination of the speech recognition threshold (SRT) to the signal/noise ratio, established
at 50%14. The irst four sentences are presented
with a rate of 4 to 4 dB which estimates the subject
threshold. From the ifth sentence on, the rate is changed to 2 dB and the deinite threshold is deter -mined after the presentation of the 20 sentences to each condition of the test.
The participants must repeat the listened sentence completely in order to be accepted and the
examiner must compute (yes or no) each presented
sentence so that the program calculates the signal/ noise ratio in the system.
Subjects were tested with headphones to compare the results of the normal hearing groups in Brazilian Portuguese and with other works involving the current material.
The results were calculated by the signal/noise metering. It’s important to point that the more
negative it is, greater is the dificulty of the test, due
to the speech is lower than the presented noise. A descriptive analysis with the presentation of frequency distribution tables to categorical variables and position and dispersion measurements to numerical variables was presented. In order to compare the proportion, we used the Qui-Quadrado
test or Fischer exact test when necessary. To
compare continuous or ordinal measurements
test. To verify the linear association between the measurements, we used the Sperman Correlation
Coeficient. This coeficient varies from –1 to 1 and the values close to the extremes indicate negative
or positive correlation, while the values close to
zero indicate no correlation. The signiicance level adopted to the statistical analysis was 5%18.
RESULTS
The relation between HINT application conditions
and noise exposure time in G2 showed signiicant difference in Spearman linear coeficient in S (c=
0,26568; p= 0,0262) e NC (c=0,29413; p= 0,0135).
In G3, the statistical results were not signiicant.
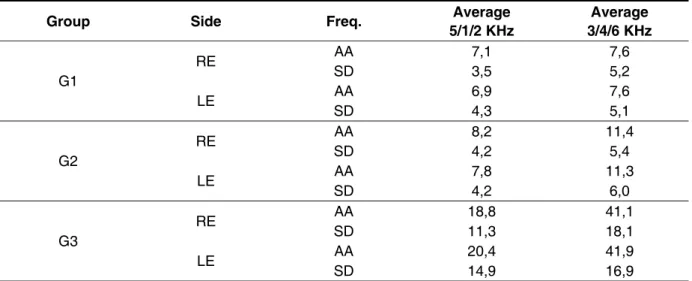
Table 1 shows the distribution of 500, 1000, 2000, 3000, 4000 and 6000 Hz average thresholds in both ears of each group.
The average of 500, 1000, 2000, 3000, 4000 and 6000 Hz frequencies from both ears were compared to verify the threshold differences between the
groups using Spearman linear correlation coefi -cient. A correlation between HINT performance and the averages described was found, showing that the worst is the average, worst is the HINT
perfor-mance. In G1, correlation for the Q condition was found; in G2, correlation for the 500, 1000 and 2000
Hz averages in the conditions Q, NR, NL and NC, and for the 3000, 4000 and 6000 Hz averages in the condition NL were found. Such results are shown in the Table 2
Table 1 – Hearing threshold averages by frequency average and their respective standard deviation to the three groups
Hearing threshold arithmetic averages (AA) and their standard deviation (SD) in groups: G1 – normal hearing group not exposed to noise; G2- normal hearing group exposed to noise and G3 – hearing loss subject group; right ear (RE) and left ear (LE)
Group Side Freq. Average
5/1/2 KHz
Average 3/4/6 KHz
G1
RE AA 7,1 7,6
SD 3,5 5,2
LE AA 6,9 7,6
SD 4,3 5,1
G2
RE AA 8,2 11,4
SD 4,2 5,4
LE AA 7,8 11,3
SD 4,2 6,0
G3
RE AA 18,8 41,1
SD 11,3 18,1
LE AA 20,4 41,9
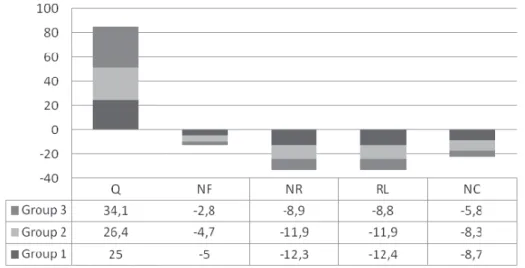
A statistical difference (p=0,0001) was found
only in the NC condition between G1 and G2 by
performing a descriptive analysis and comparisons between the groups on HINT test performance with
headphones using the Krukal-Wallis method..
Figure 2 shows the HINT Brazil values on each condition per group. Despite the answers beneath the normal thresholds for every group in the logo-audiometric tests, an inferior performance was
found in G3 when compared to G1 and G2. This
results shows that hearing loss subjects present an inferior relation signal/noise to the HINT Brazil test.
Comparative tests between G1 and G3, and also between G2 and G3 showed differences in every test conditions (p<0,0001) by the Kruskal-Wallis
method.
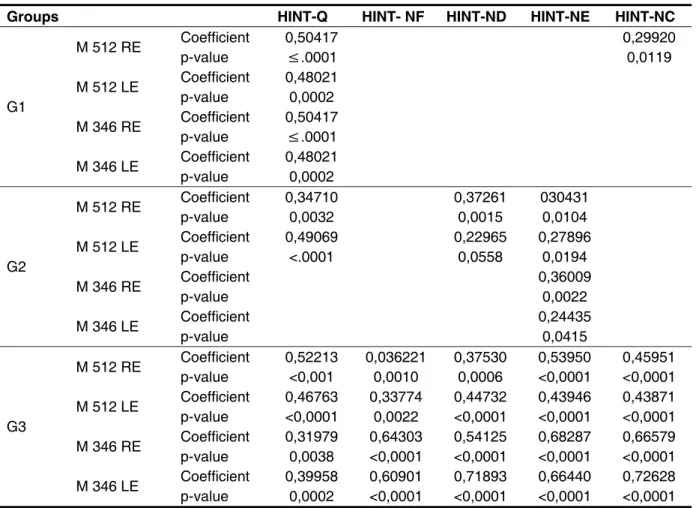
The average values in normal hearing subjects in Brazilian studies considering the four conditions in HINT Brazil performance are described in the Table 4
Groups HINT-Q HINT- NF HINT-ND HINT-NE HINT-NC
G1
M 512 RE Coefficient 0,50417 0,29920
p-value ≤.0001 0,0119
M 512 LE Coefficient 0,48021
p-value 0,0002
M 346 RE Coefficient p-value 0,50417 ≤.0001
M 346 LE Coefficient 0,48021
p-value 0,0002
G2
M 512 RE Coefficient 0,34710 0,37261 030431
p-value 0,0032 0,0015 0,0104
M 512 LE Coefficient 0,49069 0,22965 0,27896
p-value <.0001 0,0558 0,0194
M 346 RE Coefficient 0,36009
p-value 0,0022
M 346 LE Coefficient 0,24435
p-value 0,0415
G3
M 512 RE Coefficient p-value 0,52213 <0,001 0,036221 0,0010 0,37530 0,0006 0,53950 <0,0001 0,45951 <0,0001
M 512 LE Coefficient 0,46763 0,33774 0,44732 0,43946 0,43871
p-value <0,0001 0,0022 <0,0001 <0,0001 <0,0001
M 346 RE Coefficient 0,31979 0,64303 0,54125 0,68287 0,66579
p-value 0,0038 <0,0001 <0,0001 <0,0001 <0,0001
M 346 LE Coefficient 0,39958 0,60901 0,71893 0,66440 0,72628
p-value 0,0002 <0,0001 <0,0001 <0,0001 <0,0001
Table 2 – HINT ratio in test conditions and averages (500/1000/2000 and 3000/4000/6000) to right ear and left ear in the groups
Figure 2 – HINT values to the conditions: Quiet (Q), Noise Front (NF), Noise Right (NR), Noise Left (NL) and Noise Composite (NC) for the three groups.
Group N Variable Average SD Minimum Median Maximum p-value
(Kruskal-Wallis)
G1 56
HINT- Q 25,0 6,3 13,1 26,1 36,8 <0,0001
HINT- NF -5,0 0,9 -6,7 -5,1 -2,7 <0,0001
HINT- NR -12,3 1,1 -14,7 -12,5 -9,8 <0,0001
HINT- NL -12,4 1,1 -15,0 -12,3 -10,1 <0,0001
HINT- NC -8,7 0,8 -10,1 -8,7 -6,5 <0,0001
G2 70
HINT- Q 26,4 5,6 14,5 27,1 39,6 <0,0001
HINT- NF -4,7 1,0 -7,6 -4,8 -2,0 <0,0001
HINT- NR -11,9 0,9 -13,6 -11,9 -9,6 <0,0001
HINT- NL -11,9 1,1 -14,2 -12,0 -9,1 <0,0001
HINT- NC -8,3 0,8 -10,3 -8,3 -6,1 <0,0001
G3 80
HINT- Q 34,1 8,8 17,6 34,4 61,3 <0,0001
HINT- NF -2,8 2,3 -6,4 -3,4 6,0 <0,0001
HINT- NR -8,9 3,4 -13,8 -10,0 3,5 <0,0001
HINT- NL -8,8 3,4 -14,2 -9,6 2,9 <0,0001
HINT- NC -5,8 2,7 -9,5 -6,6 3,6 <0,0001
HINT (with headphones) Q NF NR NL NC
Present study- G1 25 -5,0 -12,3 -12,4 -8,7
Present study- G2 26,4 -4,7 -11,9 -11,9 -8,3
Bevilacqua13 15,3 -4,6 -12,2 -12,2 -8,4
Arieta25 25,7 -5,1 -12,3’ -12,3 -8,5
Table 3 – Descriptive analysis and HINT comparisons in the four test conditions
HINT application conditions: Q- Quiet; NF- Noise Front; NR- Noise Right; NL- Noise Left; NC- Noise Composite
Table 4 – Average values from HINT Brazil application conditions in national researches in normal hearing subject groups
DISCUSSION
HINT has shown numerous clinical and research applications, besides allowing comparisons between different languages. As shown, HINT Brazil was
applied in subjects exposed and not exposed to
noise, with and without hearing loss in order to verify the differences in speech perception in noise.
Studies verify that the audiological evaluation fails to predict with precision the recognition speech performance in subjects from different ages due to the fact that it doesn’t include competitive noise19.
The criterion to G1 and G2 was to present
audiometric thresholds inside the normality pattern, showing differences between them relative to
the exposure or not to noise. This differentiation
becomes important to not overestimate the results,
because in G1 included normal hearing subjects in a widespread way. The subjects exposed could
participate and elevate the hearing threshold20.
When comparing G1 and G2, we observed a
statistical difference (p<0,0001) in NC condition and the normal hearing performance was inferior.
Studies reveal inferior speech recognition in
normal hearing groups exposed to noise when compared to a control group without exposure. The authors suggest that noise may cause signiicant
distortions on the temporal processing21. These
indings are similar to those found in this study, as we found signiicant speech perception change,
considering the weighted average in NC, in the
normal hearing group exposed to noise.
The exposure time was evaluated and we found signiicant change in Q and NC conditions in G2 and no difference was found in G3. However, we found that HINT worsens as time of exposure increases to the group of normal subjects exposed to occupa -tional noise22.
Increased risk of hearing loss inducted by noise
was found in another study, when noise exposure
was combined to hands and arms vibration23. Such
study showed HINT values in noiseless condition
(Q) of 25 dBA (G1), 26,4 dBA (G2) and 34,1 dBA (G3) respectively.
Findings from studies including speech sentences tests, not using HINT technology, showed noiseless sentences recognition values ranging from 18,5 to 26,7 dBA9; 23,9 ± 5,2 dBA9, 14,6 and 31,4 dBA24
Studies performed in Brazil with HINT technology show that the signal/noise ratio in NF, NR, NL and NC conditions were similar to those obtained in the normal hearing group research, tested with headphones13,25.
A study in normal hearing subjects with and without speech recognition impairment complains, using the noise sentences test recorded on a CD,
found average values in speech/noise ratio to the group without complains of –6,26 (right ear) and –7,12 (left ear), and to the group with complains of –3,62 (right ear) and –4,12 (left ear). These results show that normal hearing subjects with speech recognition complains in noisy environments have worse performance when compared to subjects without complains10.
Another study, performed in 53 subjects exposed
to noise with NIHL diagnosis found sentences recognition threshold in silence average values of 23,9 dBA and signal/noise ratio of –2,7 dB. It was observed a worsens from 2,8 to 4,8 dB in NIHL group performance when compared to normal hearing26. These results are similar to those showed
in this study where the average value of 34,1 dBA was found in hearing loss subjects in noiseless condition. A signal/noise ratio of –5,8 dB was found
in NC condition, conirming the worsen of 2,9 dB (33% on HINT Brazil) in sentence recognition in
hearing loss subjects when compared to normal hearing.
Exams involving 400 ears from subjects exposed
to occupational noise with normal hearing or hearing loss induced by noise (different degrees) diagnosis were performed and the average values from the Silence Sentence Recognition Threshold (SSRT) test found were from 14,6 to 31,4 dBA without considering eventual differences due the hearing loss degree. The author found a signal/noise ratio variation from –5,09 to –0,1 dB24. Our study shows
signal/noise ratio data of –5,8 dB, similar to those
exposed to NC condition.
Researchers evaluated the sentence recognition threshold with and without competitive noise in a group with NIHL and compared the results with normal hearing subjects. To obtain the data, the researchers used the SSRT and Noise Sentence Recognition Thresholds (NSRT) tests. A total of 88
ears were examined (22 with normal hearing and
the rest with different degrees of NIHL) and the results showed an inferior result in the answers of SSRT and NSRT in subjects with NIHL. Also, a tendency of escalation as NIHL increases was found9. These indings are like those found in the
present study, where the performance of hearing loss subjects is worse when compared to normal hearing subjects, and becomes even worst in the presence of competitor noise.
–4,80 to –2,79 dB in the NSRT test. Thus, the authors showed a decrease of 2,7 dB (ranging from 1,88 to 4,88 dB) between the normal hearing and the NIHL groups averages.
It’s important to remember that SSRT and NSRT
use the same elements as HINT: ixed noise at 65
dB(A) and sentences with speech spectrum noise, but the difference is in the form they are applied, because HINT allows the sentences presentation in software, different test conditions, computes the signal/noise ratio fast and doesn’t need to be applied by CD and/or audiometer. The authors also suggest routine tests application to measure the subject group speech perception.
The indings are similar to those found in a
normal hearing and hearing loss subjects research regarding the worse speech perception performance from the hearing loss subjects when compared to normal hearing and these results are not detected in logo-audiometric tests applied in the clinic27.
We observed correlation between HINT
performance in Q condition and the audiometric thresholds averages, being in agreement with
indings that indicate that both tests can predict the
intelligibility. However, HINT offers more information as it evaluates the signal/noise ratio with speech spectrum noise sentence stimuli and enables a substantially precise measure in different population groups in different languages28.
CONCLUSION
Our study found that there is difference regarding HINT Brazil test performance in normal hearing
subjects exposed and not exposed to occupational
noise in the Composite Noise condition. The worst HINT performance in every application condition was in the hearing loss group when compared to normal hearing subjects with and without noise
exposure.
HINT using shows to be an eficient method to verify speech perception dificulties in noise in the
hearing loss group. Nevertheless, further research are necessary in order to disseminate and apply HINT Brazil method in the clinic practice.
REFERENCES
1. Cervera T, Gonzalez-Albernaz J. Test of Spanish
sentences to measure speech intelligibility in noise conditions. Behav Res. 2011;43:459-67.
2. Anderson S, Parbery-Clark A, Yi HG, Kraus N.
A Neural Basis of Speech-in-Noise Perception in Older Adults. Ear & Hearing. 2011;32(3):1-8.
3. Feng Y, Yin Shankai, Kiefte M, Wang J. Temporal
resolution of normal hearinh and speech perception
RESUMO
Objetivo: investigar a diferença da relação sinal/ruído em sujeitos expostos e não expostos a ruído
ocupacional, com e sem perda auditiva, com a utilização do Hearing in Noise Test na versão em Português do Brasil. Método: 206 sujeitos, 49 do gênero feminino e 157 do gênero masculino, foram
avaliados e divididos em: 56 normo-ouvintes sem exposição a ruído (Grupo 1); 70 normo-ouvintes expostos a ruído ocupacional (Grupo 2); e 80 expostos a ruído ocupacional com rebaixamento audio
-métrico sensorioneural (Grupo 3). Foi analisado a relação sinal/ruído com o HINT Brasil em quatro
condições de apresentação: S- sem ruído; RF- ruído frontal; RD- ruído a direita; RE-ruído a esquerda; RC- ruído composto (média ponderada das apresentações com ruído) e os resultados foram ano-tados em dB. Resultados: os valores médios obtidos foram: G1: 25,0 (S), –5,0 (RF), –12,3 (RD),
–12,4 (RE) e –8,7 (RC); G2: 26,4(S),-4,7(RF), –11,9(RD), –11,9(RE) e –8,3 (RC); G3: 34,1 (S), –2,8
(RF), –8,9 (RD), –8,8 (RE), –5,8 (RC).Observou-se diferença signiicante entre os valores do grupo
de sujeitos não exposto (G1) com os do exposto (G2) apenas na condição Ruído Composto (RC). O grupo de sujeitos com rebaixamento audiométrico (G3) apresentou diferença signiicante em relação aos grupos G1 e G2, com pior desempenho em todas as condições de aplicação. Conclusão: o pior desempenho no entendimento da fala em ruído foi no grupo com perda auditiva quando comparado
ao de normo-ouvintes com e sem exposição ao ruído.
in noise for adults with sloping high-frequency hearing loss. Ear e Hearing.2010;31(1):115-25.
4. Wang D, Kjems U, Pedersen MS, Boldt JB,
Lunner T. Speech inteligibility in background noise with ideal binary time-frequency masking. J Acoust Soc Am. J. Acoust. Soc. Am. 2009; 125(4): 2336-47. 5. Alvord LS. Cochlear dysfunction in
normal-hearing patientes with history of noise exposure.
Ear and Hearing. 1983;4(5):247:50.
6. Soli SD, Wong LLN. Assesment of speech
intelligibility in noise with the Hearing in Noise Test. Int J Audiol. 2008;47:356-61.
7. Steinmetz LG, Zeigelboim BS, Lacerda AB,
Morata, TC, Marques JM. Características do
zumbido em trabalhadores expostos a ruído. Rev
Bras Otorrinolaringol. 2009;75(1):7-14.
8. Agrawal Y, Niparko JK, Dobie RA. Estimating
the effect of occupation noise exposure on hearing
thresholds: the importance of adjusting for confunding varibles. Ear e Hearing. 2010;31(2):234-7.
9. Coser PL, Costa MJC, Coser MJS, Fukuda, Y. Reconhecimento de sentenças no silêncio e no ruído em indivíduos portadores de perda auditiva induzida pelo ruído. Braz J Otorhinolaryngol. 2000;66(4):362-70.
10. Becker KT, Costa MJ, Lautenschlager L, Tochetto TM, Santos SN. Reconhecimento de
fala em indivíduos com e sem queixa clínica de diiculdade para entender a fala no ruído. Arq Int
Otorrinolaringol. 2011;15(3):276-82.
11. Presado ACO, Peck, GMF, Souza MOPM.
Prevalência de perda auditiva induzida pelo ruído nas audiometrias realizadas em trabalhadores de uma indústria de cerâmica do sul catarinense entre o período de julho de 2009 a setembro de 2011. Arq. Catarin. Med. 2011;40(4):36-41.
12. Nilsson M, Soli SD, Sullivan JA. Development of the hearing in noise test for the measurement of speech reception theresholds in quiet and in noise. J Acoust Soc Am. 1994;95(2):1085-99.
13. Bevilacqua et al. The Brazilian Portuguese Hearing in Noise Test. Int J Audiol. 2008;47:364-5.
14. Levitt H, Rabiner LR. Use of a seqüentian strategy in inteligibility testing. J Acoust Soc Am. 1967;42:609-12.
15. Fuent A, McPherson B. Central Auditory
Damage Induced by solvent exposure. Int J Occup
Saf Ergon. 2007;13(4):391-7.
16. Laroche C, Soli S, Giguere C, Lagace J,
Vaillancount V, Fortin M. Na approach to the development of hearing-critcal Jobs. Noise Health. 2003;6(21):17-37.
17. Davis H, Silverman SR. Interpretação dos resultados da avaliação audiológica. In: Santos TMM, Russo ICP. Prática da audiologia clínica. 6 ed. São Paulo;Cortez, 2007: 291-310.
18. Conover WJ. Pratical Nonparametric Statistics. Nova Iorque.John Wiley & Sons Inc.1971.
19. Souza P, Boike K, Witherell. K, Tremblay K.
Prediction of speech recognition from audibility in older listeners with hearing loss: Efects of age,
ampliication, and background noise. J Am Acad
Audiol. 2007;18:54-65.
20. Alvord LS. Cochlear dysfunction in
normal-hearing patientes with history of noise exposure.
Ear and Hearing. 1983;4(5):247-50.
21. Agrawal Y, Niparko JK, Dobie RA. Estimating
the effect of occupation noise exposure on hearing
thresholds: the importance of adjusting for confunding varibles. Ear e Hearing. 2010;31(2):234-7.
22. Kumar UA, Ameenudin S, Sangamanatha AV. Temporal and speech processing in normal hearing
individuals exposed to occupation noise. Noise e
Health. 2012;14(58):100-5.
23. Pettersson H, Burström L, Hagberg M, Lundström R, Nilsson T. Noise and hand-arm
vibration exposure in relation to the risk of hearing
loss. Noise e Health. 2012;14(59):159-65.
24. Smoorenburg GF. Speech perception in
quiet and in noise conditions by individuals with noise-induced hearing loss in relation to their tone audiogram. J Acoust. Soc. Am. 1992;91(1):423-37. 25. Arieta, AM. Teste de percepção da fala HINT Brasil, em normo- ouvintes e usuários de aparelhos auditivos – Atenção à saúde auditiva [Dissertação]. Campinas (SP): Faculdade de Ciências Médicas/ Unicamp; 2009.
26. Plomp R., Mimpen AM. Improving the reability of testing the speech reception threshold for sentences. Audiology 1979;18:43-52.
27. Costa E.A. Brazilian Portuguese Speech material and its apllication in occupation audiology. Audiology. 2001;40:123-32.
28. Giguere, C. Laroche, C. Soli, S.D. Vaillancourt,
V. Functionally-based screening criteria for hearing – critical jobs based on the Hearing in Noise Test. Int J Audiol. 2008;47:319-28.
Received on: September 20, 2012 Accepted on: February 11, 2013
Mailing address: Aline de Moraes Arieta
Rua Ipiranga, 730, apto151 – Centro Piracicaba – SP – Brasil
CEP: 13400-485