ORIGINAL ARTICLE
Amphetamine-type stimulant use and conditional paths of
consumption: data from the Second Brazilian National
Alcohol and Drugs Survey
Luciana T.S. Massaro,
1,2Renata R. Abdalla,
1,2Ronaldo Laranjeira,
1,2Raul Caetano,
3Ilana Pinsky,
1Clarice S. Madruga
1,21Instituto Nacional de Cieˆncia e Tecnologia para Polı´ticas Pu´blicas do A´ lcool e Outras Drogas (INPAD), Sa˜o Paulo, SP, Brazil.2Departamento de Psiquiatria, Universidade Federal de Sa˜o Paulo (UNIFESP), Sa˜o Paulo, SP, Brazil.3Prevention Research Center, Oakland, CA, United States.
Objective:The aim of this study was to estimate nationally representative prevalence rates of amphetamine-type stimulant (ATS) use and to identify consumption-associated factors, proposing a conditional model of direct and indirect consumption paths.
Method: Using data from the Second Brazilian National Alcohol and Drugs Survey, this cross-sectional study analyzed a subsample of 3,828 participants between 15 and 64 years old, gathering information on the use of psychoactive substances in a probabilistic sample of the Brazilian household population. Results: Rates of lifetime and last-year ATS use were, respectively, 4.1 and 1.6%. Economically privileged individuals and users of other substances were more at risk for using ATS. The results suggest that higher education decreases the chances of ATS consumption. The conditional model showed that higher income increased ATS use, higher education lowered the odds of such an increase, and cocaine use cancelled that associative effect.
Conclusion:Brazil presents high rates of ATS use. Prevention and treatment strategies should focus on the protective effect of higher education levels and should target polydrug use. Knowledge of ATS-associated factors and user profiles is the starting point for developing effective treatments and tailored prevention strategies.
Keywords: Amphetamine-type stimulants; moderation model; epidemiology; prevalence; Brazil
Introduction
Amphetamine-type stimulants (ATS) are a group of synthetic drugs that includes amphetamine and methamphetamine, as well as other substances, such as cathinones, methcathi-none, fenethylline, ephedrine, pseudoephedrine, methylphe-nidate, and 3,4-methylenedioxymethamphetamine (MDMA, or ‘‘ecstasy’’), some of which are legally produced, purchased, and used.1The global proliferation of new synthetic drugs, also known as new psychoactive substances (NPS) is challenging pre-established mechanisms of access and policy control.2It is worrisome how fast and easily these new substances are being designed and produced, placing the recreational drug industry a step ahead of judicial authorities and drug control agencies.3
Recent reports indicate ATS usage rates of 0.5 and 0.6% in Europe and North America, respectively.4,5Data
on ATS consumption in Latin America are scarce, deriv-ing mostly from police arrest reports, which are usually inaccurate. Nevertheless, according to the most recent
United Nations Office on Drugs and Crime (UNODC) Latin American ATS Assessment, this class of drugs is one of the most widely used in the region, second only to cannabis.1
To date, estimations of ATS consumption in Brazil have been limited to specific populations, such as students6,7
and professional drivers,8 with recent studies indicating increased consumption in these populations.8,9 Despite
the large body of evidence showing the addictive and neurotoxic proprieties of most drugs belonging to the ATS class,10 the general perception of users is that these drugs are less harmful than others, and the damage to physical, mental, and social health2 is, therefore, frequently underestimated.10,11 Some of the health con-sequences of ATS use are sleep disorders, psychosis, paranoid hallucination, agitation, confusion, severe panic, anxiety, depression, irregular heartbeat, tremors, muscle cramps and decreased capacity to cope with changing ambient temperature (which may result in hypo- or hyperthermia), including the risk of death.2,4,10 Addition-ally, the negative cognitive effects of ATS have been the subject of recent studies.12Worse still is the fact that ATS consumers are usually polydrug users,11thus increasing their health risks, such as sexual risk behaviors, which might lead to unfavorable outcomes.13In addition, previous
studies have shown that socioeconomic and demographic
Correspondence: Clarice S. Madruga, Universidade Federal de Sa˜o Paulo, Departamento de Psiquiatria, Rua Borges Lagoa, 570/82, CEP 04038-000, Sa˜o Paulo, SP, Brazil.
E-mail: [email protected]
Submitted Dec 15 2015, accepted Feb 22 2017, Epub Jul 06 2017.
characteristics can also have an impact on ATS consump-tion, acting either as protective factors against or risk factors for drug use and the development of addiction.14
This class of drug is still expensive compared to other stimulants such as cocaine,15 which is generally more
available and cheaper in Brazil, leading to a higher chance of concomitant use. Furthermore, it is expected that higher education would decrease the chance of illicit drug use.14 Taking into account this body of evidence, the aim of this study was to propose a conditional path model for estimating the direct effect of income on ATS use in the country, exploring the role that education level and cocaine use play in the indirect path of this relationship. The study also provides national rates and investigates factors asso-ciated with ATS use in the country. Knowledge of the paths leading to ATS use is crucial to the development of tailored prevention strategies and treatment policies.1,16
Materials and methods
Sampling and procedures
The Second Brazilian National Alcohol and Drugs Survey (BNADS II), conducted in 2012, used a multistage cluster sampling procedure to select 4,607 individuals aged 14 years old or older – including an oversample of 1,157 adolescents – from the Brazilian household population. Brazilian residents who do not speak Portuguese (e.g., in isolated tribes) and individuals with severe intellectual disability were excluded from the sample. The overall response rate was 77%, with 79% in the oversample of adolescents. The BNADS II sampling17 involved four stages: the selection of 149 counties using probability-proportional-to-size methods; the selection of 375 total census sectors from within those counties, also using probability-proportional-to-size methods; the selection of 8 households within each census sector by simple random sampling; and, finally, the selection of one member of each household to be interviewed by the next-birthday method. Trained interviewers conducted face-to-face interviews of approximately one hour in the home of the respondent, using a standardized questionnaire. Metho-dological improvements over the BNADS I were imple-mented to avoid the underreporting of illicit drug use and to expand the list of evaluated substances. In BNADS II, the questionnaire’s illicit drug use section was completed in a separate room by the participant, who then returned it to the interviewer in a sealed envelope. That change confounds comparisons between the two measurements (2006 and 2012) of illicit drug use rates. Additional details regarding the methodology employed in the BNADS II are available elsewhere.18,19
Measurements
Socioeconomic and demographic variables
In the present study, we evaluated a subsample of individuals between 15 and 64 years of age (n=3,828) to allow comparisons with other studies in the literature. Socio-economic and demographic variables (sex, age, education
level, marital status, and personal income) were ana-lyzed. Rates were also estimated for the five major geographic regions of Brazil.
Substance use assessment
We assessed self-reported lifetime and past-year use of ATS-class substances. Within the ATS class, we included questions about amphetamine, crystal meth, methyl-phenidate, ecstasy and other MDMA-derivative use, as well as non-prescribed snorted methylphenidate (Ritalin). The decision to combine these substances into a single variable was made, in the first place, to allow national comparisons with the UNODC data,2 which combines these drugs into an ATS category, although a new class called NPS in under consideration, which would act as an umbrella category for all newly-developed drugs, whether stimulants or not.
We also assessed the self-reported lifetime and past-year use of other substances, including alcohol, tobacco, cannabis, cocaine (snorted or smoked), hallucinogenic drugs (such as lysergic acid diethylamide and psilocybin mushrooms), anesthetic drugs (such as ketamine and gamma-hydroxybutyrate), and tranquilizers (benzodiazepines). In order to guarantee confidentiality, the drug-related questions were not asked face-to-face but were answered in private by each participant and returned at the end of the interview in a sealed envelope, which was immedi-ately sealed in a bag in front of the respondent. Alcohol use disorder was assessed according to DSM-5 criteria.20
Control variables
Multivariate models included sex, age, and education level as control variables. The conditional model included sex and age as control variables.
Statistical analysis
(or a combination of the two) in an integrated conditional process model (i.e., moderations).23To test the modera-tion model as a hypothesis, we used the analytic method discussed by Preacher and Preacher et al.,24,25 adopt-ing an algorithm for conditional process analysis.23 The
moderation effects were estimated in PROCESS macro using a maximum likelihood estimator. Bias-corrected bootstrapping confidence intervals with 10,000 bootstrap samples were used to test the null hypothesis (i.e., that the indirect effect of cocaine use on ATS use is not significant), which did not take sample weighting into account. When confidence intervals contained zero, the null hypothesis was accepted.26All models were evaluated using multiple indices of model fit27: a non-significant chi-square statistic, comparative fit index values greater than 0.95, and standardized root mean square residual values less than 0.08.
Results
Amphetamine-type stimulant use
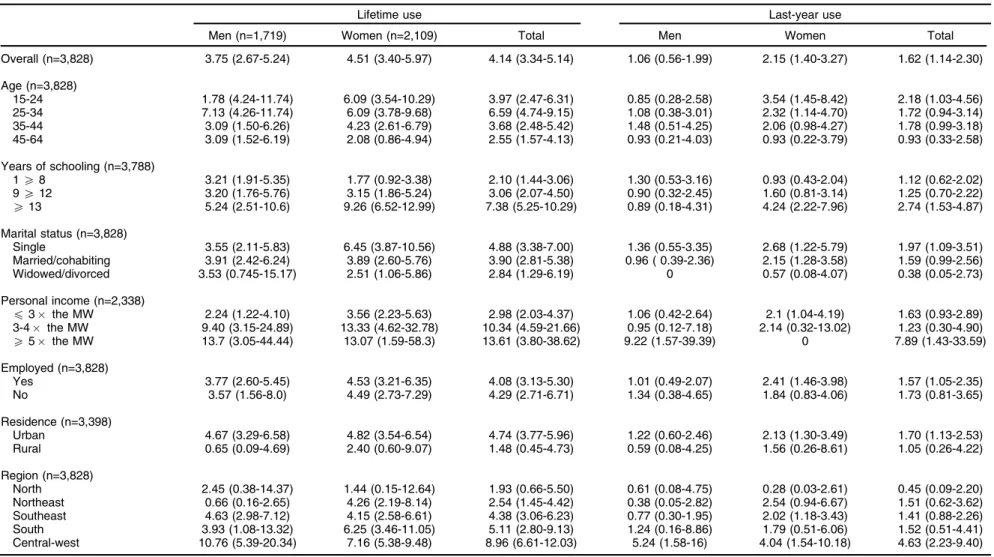
Lifetime ATS use was reported by 4.1% of the individuals in the sample (4.5% of the women and 3.8% of the men), as shown in Table 1. The use of ATS in the last 12 months (last-year ATS use) was reported by 1.6% of the indi-viduals in the sample (2.2% of the women and 1.1% of the men). The prevalence of lifetime and last-year ATS use was lower among inhabitants of rural areas. The ATS use rates were significantly higher in the central-west region than in the four other major regions of Brazil (the north, northeast, southeast, and south), reaching 9.0 and 4.6% for lifetime and last-year use, respectively (po0.05; Table 1).
Preliminary analysis of factors associated with ATS use
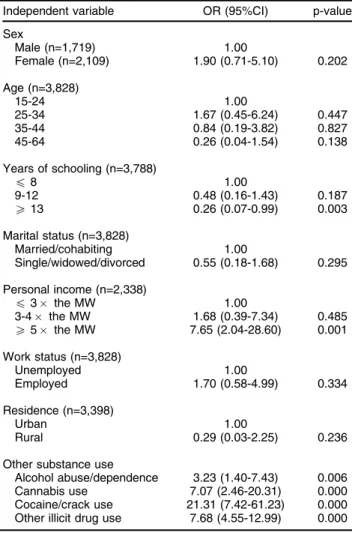
Our preliminary results showed a significant association between income and last-year ATS use, in which the chance of using ATS were approximately 5 times greater for individuals in the highest income bracket than for those in the lowest income bracket (Table 2). The pre-liminary multivariate analysis also identified that the higher the education level, the lower the risk of ATS use. Last-year ATS use was positively associated with the use of all other illicit substances. Users of ATS were 7.07 times more likely to use cannabis, 7.68 times more likely to use other illegal substances and 21.31 times more likely to use cocaine or crack than non-ATS users. There was no significant association between ATS use and alcohol use disorder.
Path models for ATS consumption
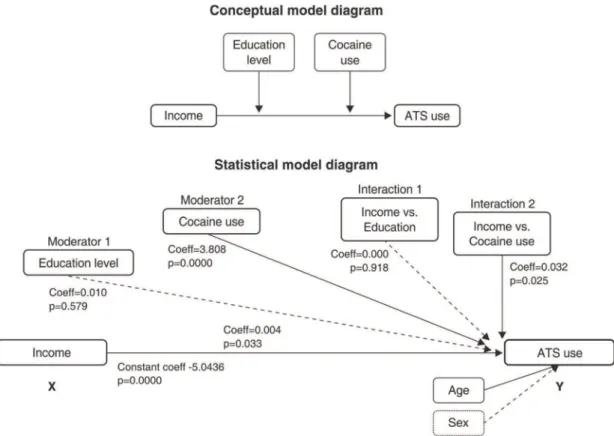
In the preliminary multivariate regression models, after adjustments for all other socioeconomic and demographic characteristics, illicit drug use, cannabis and cocaine use were associated with ATS use, whereas education level lowered the chances of such use. Among all possible com-binations of direct and indirect effects of these variables with ATS use, the best goodness-of-fit was shown by
cocaine use and education as concomitant moderators of the direct effect of income on ATS use. The predictive power of this model was estimated using R2methods to
determine goodness-of-fit (i.e., the McFadden, Cox & Snell, and Nagelkerke methods),28 resulting in
satisfac-tory values of 0.138, 0.019, and 0.1466, respectively. As shown in Figure 1, education level and cocaine use moderated the effect size of income on ATS use. In other words, the chance of using ATS significantly decreased with a high education level (X13 years of schooling). The conditional model analysis showed (Table 3) a significant odds reduction with education level for the two quartiles of years of schooling – 9.5 years (effect, 0.0004; 95%CI 0.0002-0.0007) and 19.5 years (effect, 0.0004; 95%CI 0.0002-0.0006) – provided the value of the second moderator (cocaine use) was 0 (null). However, when the second moderator value was 1 (concomitant cocaine use), the association with education level ceased to be significant. In other words, education level had no effect on the magnitude of the direct effect between income and ATS use when cocaine use was concurrent. All association models were adjusted for sex and age. The same model was not valid when cocaine use was replaced by cannabis use or other illicit drug use as possible moderators.
Discussion
The use of ATS is a new issue in Brazil and has yet to be fully investigated. Our results indicate that 1.6% of a representative sample of the Brazilian population had used at least one ATS in the last year. Given the popu-lation size,29this suggests that 3 million Brazilians used ATS in the 12 months prior to the survey. This indicates an enormous drug market and a potentially heavy burden on Brazilian society. This prevalence surpasses the 1% reported for Latin America in the latest UNODC study.1
In fact, it is higher than the prevalence reported for all other Latin American countries (e.g., approximately 1.0% for Costa Rica, 0.67% for Colombia, and 0.5% for Bolivia), as well as for most European countries, where the average consumption rate is 0.6%.2,30
The prevalence estimated in our study follows a trend detected in another survey conducted in Brazil,31,32which demonstrated a twofold increase (from 0.3 to 0.7%) in amphetamine consumption between 2001 and 2005. In fact, the UNODC recently issued a warning about the increased use of stimulants in low- and middle-income countries, which are considered the preferred targets of organized crime groups involved in the ATS trade. The increased demand for ATS in such countries is probably associated with their emerging economies and young populations. Ecstasy-related arrests are also on the rise in Brazil, accounting for 47% of all ATS-related arrests between 2008 and 2012 in South America, Central America, and the Caribbean.1
The high prevalence of ATS consumption among women should also be highlighted. Stimulant misuse among women has previously been studied in Brazil,33 and our estimations corroborate those of a 2009 survey of college students, which estimated that the rates of lifetime ATS
Table 1 Prevalence of lifetime and last-year use of amphetamine-type stimulants, by sociodemographic characteristic and sex, in individuals between 15 and 64 years of age
Lifetime use Last-year use
Men (n=1,719) Women (n=2,109) Total Men Women Total
Overall (n=3,828) 3.75 (2.67-5.24) 4.51 (3.40-5.97) 4.14 (3.34-5.14) 1.06 (0.56-1.99) 2.15 (1.40-3.27) 1.62 (1.14-2.30)
Age (n=3,828)
15-24 1.78 (4.24-11.74) 6.09 (3.54-10.29) 3.97 (2.47-6.31) 0.85 (0.28-2.58) 3.54 (1.45-8.42) 2.18 (1.03-4.56) 25-34 7.13 (4.26-11.74) 6.09 (3.78-9.68) 6.59 (4.74-9.15) 1.08 (0.38-3.01) 2.32 (1.14-4.70) 1.72 (0.94-3.14) 35-44 3.09 (1.50-6.26) 4.23 (2.61-6.79) 3.68 (2.48-5.42) 1.48 (0.51-4.25) 2.06 (0.98-4.27) 1.78 (0.99-3.18) 45-64 3.09 (1.52-6.19) 2.08 (0.86-4.94) 2.55 (1.57-4.13) 0.93 (0.21-4.03) 0.93 (0.22-3.79) 0.93 (0.33-2.58)
Years of schooling (n=3,788)
1X8 3.21 (1.91-5.35) 1.77 (0.92-3.38) 2.10 (1.44-3.06) 1.30 (0.53-3.16) 0.93 (0.43-2.04) 1.12 (0.62-2.02) 9X12 3.20 (1.76-5.76) 3.15 (1.86-5.24) 3.06 (2.07-4.50) 0.90 (0.32-2.45) 1.60 (0.81-3.14) 1.25 (0.70-2.22)
X13 5.24 (2.51-10.6) 9.26 (6.52-12.99) 7.38 (5.25-10.29) 0.89 (0.18-4.31) 4.24 (2.22-7.96) 2.74 (1.53-4.87)
Marital status (n=3,828)
Single 3.55 (2.11-5.83) 6.45 (3.87-10.56) 4.88 (3.38-7.00) 1.36 (0.55-3.35) 2.68 (1.22-5.79) 1.97 (1.09-3.51) Married/cohabiting 3.91 (2.42-6.24) 3.89 (2.60-5.76) 3.90 (2.81-5.38) 0.96 ( 0.39-2.36) 2.15 (1.28-3.58) 1.59 (0.99-2.56) Widowed/divorced 3.53 (0.745-15.17) 2.51 (1.06-5.86) 2.84 (1.29-6.19) 0 0.57 (0.08-4.07) 0.38 (0.05-2.73)
Personal income (n=2,338)
p3 the MW 2.24 (1.22-4.10) 3.56 (2.23-5.63) 2.98 (2.03-4.37) 1.06 (0.42-2.64) 2.1 (1.04-4.19) 1.63 (0.93-2.89) 3-4 the MW 9.40 (3.15-24.89) 13.33 (4.62-32.78) 10.34 (4.59-21.66) 0.95 (0.12-7.18) 2.14 (0.32-13.02) 1.23 (0.30-4.90)
X5 the MW 13.7 (3.05-44.44) 13.07 (1.59-58.3) 13.61 (3.80-38.62) 9.22 (1.57-39.39) 0 7.89 (1.43-33.59)
Employed (n=3,828)
Yes 3.77 (2.60-5.45) 4.53 (3.21-6.35) 4.08 (3.13-5.30) 1.01 (0.49-2.07) 2.41 (1.46-3.98) 1.57 (1.05-2.35) No 3.57 (1.56-8.0) 4.49 (2.73-7.29) 4.29 (2.71-6.71) 1.34 (0.38-4.65) 1.84 (0.83-4.06) 1.73 (0.81-3.65)
Residence (n=3,398)
Urban 4.67 (3.29-6.58) 4.82 (3.54-6.54) 4.74 (3.77-5.96) 1.22 (0.60-2.46) 2.13 (1.30-3.49) 1.70 (1.13-2.53) Rural 0.65 (0.09-4.69) 2.40 (0.60-9.07) 1.48 (0.45-4.73) 0.59 (0.08-4.25) 1.56 (0.26-8.61) 1.05 (0.26-4.22)
Region (n=3,828)
North 2.45 (0.38-14.37) 1.44 (0.15-12.64) 1.93 (0.66-5.50) 0.61 (0.08-4.75) 0.28 (0.03-2.61) 0.45 (0.09-2.20) Northeast 0.66 (0.16-2.65) 4.26 (2.19-8.14) 2.54 (1.45-4.42) 0.38 (0.05-2.82) 2.54 (0.94-6.67) 1.51 (0.62-3.62) Southeast 4.63 (2.98-7.12) 4.15 (2.58-6.61) 4.38 (3.06-6.23) 0.77 (0.30-1.95) 2.02 (1.18-3.43) 1.41 (0.88-2.26) South 3.93 (1.08-13.32) 6.25 (3.46-11.05) 5.11 (2.80-9.13) 1.24 (0.16-8.86) 1.79 (0.51-6.06) 1.52 (0.51-4.41) Central-west 10.76 (5.39-20.34) 7.16 (5.38-9.48) 8.96 (6.61-12.03) 5.24 (1.58-16) 4.04 (1.54-10.18) 4.63 (2.23-9.40)
Data presented as % (95% confidence interval). MW = Brazilian national minimum wage.
B
ras
P
siquiatr
.
2
0
17;39(3)
L
T
S
M
assaro
et
consumption were higher among women.7 The high prevalence of ATS use among women is a cause for concern, because it is known that heavy consumption patterns and symptoms of dependence are more rapidly established in women than men, and that the rates of relapse after one or more periods of abstinence are higher among women than men,34 which demonstrates the need for gender-specific support strategies. We also found significant associations between ATS use and the use of other substances, which is in agreement with a considerable body of evidence in the literature.35,36 Over a third of Brazilian college students reported using two or more substances in 2009, with amphetamine compounds among the most consumed substances.7 Although pre-senting large confidence intervals, our findings suggest that ATS users in Brazil are up to 21 times more likely to consume cocaine and almost 7 times more likely to use cannabis than individuals who do not use ATS. The strong association with cannabis is well documented, indi-cating an overlapping of user profiles. This can be attri-buted to user attempts to self-regulate the effects of ATS;
cannabis acts mainly as a sedative,37 alleviating some of the undesirable effects of the stimulants. An associa-tion between ATS use and cocaine use has also been reported, due to similarities between user profile and use context. Above all, we highlight the association found between ATS use and socioeconomic status. Such a relationship has been identified in other studies con-ducted in Brazil7 and is supported by the fact that new synthetic stimulants are still relatively expensive in Brazil and other Latin American countries. Preliminary results from the Global Drug Survey 2015 showed that the average price of ecstasy in Brazil was h8.6 per pill and h44.5 per gram,15confirming unofficial sources that one
gram of MDMA can cost up to four times as much as the same amount of cocaine in Brazil. Our results corroborate this claim, showing that higher income increased the risk of ATS use. This was also confirmed by the conditional path model, in which this direct effect was moderated by cocaine use (whether snorted or smoked). The same relationship was not found with other illicit drugs, such as cannabis. The conditional model also showed that education level moderates the association between income and ATS use: each additional year of schooling reduces the direct effect between income and ATS use. However, when cocaine use was concomitant, the asso-ciation with education level ceased (i.e., education level no longer decreased the chance of ATS use). Thus, cocaine use moderates the association between income and ATS use, magnifying the direct effect. This path analysis is quite self-explanatory, providing a clear insight into how such relationships can occur in a real-life context. Its interpretation leads to the conclusion that any attempts to prevent ATS use among risk groups should always embrace the prevention of other drug use and stress the harms of polydrug use. However, our results also indicate that a higher education level reduces the risk of ATS use in isolation (i.e., not combined with other stimulants). It is therefore imperative to promote the development of professional skills as protective measures against drug use. Initiatives aimed at prevention are efficient only when correctly targeted.38Consequently, it is of the utmost importance to target the vulnerable groups identified in this study: young, affluent, poorly educated, polydrug users, and, in the specific case of ATS, women. The evidence presented here should help assess the impact that ATS use has on the mental health care system in Brazil, as well as provide a foundation for more efficient public health policies and strategies.
The intrinsic limitations of this study should be men-tioned. First, we used a cross-sectional design, which demands a very careful interpretation of path analysis models to avoid assumptions about causal relationships. In addition, as in most assessments of illicit drug use, we must consider the possibility that drug use was under-reported. Furthermore, we must emphasize that the variety of new synthetic stimulants is so broad that neither the participant’s self-report nor even basic toxicology assess-ments could precisely detect which type of stimulants had actually been taken. To avoid misclassification, this study grouped any non-prescribed stimulant into a single category.
Table 2 Last-year use of amphetamine-type stimulants in relation to sociodemographic characteristics and the use of other substances*
Independent variable OR (95%CI) p-value
Sex
Male (n=1,719) 1.00
Female (n=2,109) 1.90 (0.71-5.10) 0.202
Age (n=3,828)
15-24 1.00
25-34 1.67 (0.45-6.24) 0.447 35-44 0.84 (0.19-3.82) 0.827 45-64 0.26 (0.04-1.54) 0.138
Years of schooling (n=3,788)
p8 1.00
9-12 0.48 (0.16-1.43) 0.187
X13 0.26 (0.07-0.99) 0.003
Marital status (n=3,828)
Married/cohabiting 1.00
Single/widowed/divorced 0.55 (0.18-1.68) 0.295
Personal income (n=2,338)
p3 the MW 1.00
3-4 the MW 1.68 (0.39-7.34) 0.485 X5 the MW 7.65 (2.04-28.60) 0.001
Work status (n=3,828)
Unemployed 1.00
Employed 1.70 (0.58-4.99) 0.334
Residence (n=3,398)
Urban 1.00
Rural 0.29 (0.03-2.25) 0.236
Other substance use
Alcohol abuse/dependence 3.23 (1.40-7.43) 0.006 Cannabis use 7.07 (2.46-20.31) 0.000 Cocaine/crack use 21.31 (7.42-61.23) 0.000 Other illicit drug use 7.68 (4.55-12.99) 0.000
95%CI = 95% confidence interval; MW = Brazilian national minimum wage.
*Logistic regression models and sociodemographic variables were mutually adjusted for age, sex, and education level.
This study represents a major investigation of ATS-use issues in a representative sample of the Brazilian popula-tion, one of the largest developing countries in the world. A cluster-like alignment of factors and events – a young population, an emerging economy, and a shortfall in mental health care and social services – has led to the rise of this foreseeable (and preventable) public health issue.
Acknowledgements
This study was supported by grants from Conselho Nacional de Desenvolvimento Cientı´fico e Tecnolo´gico (CNPq) during the survey design and implementation and from Coordenac¸a˜o de Aperfeic¸oamento de Pessoal de Nı´vel Superior (CAPES) during the data analysis and inter-pretation stages.
Disclosure
The authors report no conflicts of interest.
References
1 United Nations Office on Drugs and Crime (UNODC). Amphetamine-type stimulants in Latin America [Internet]. 2014 [cited 2017 Mar 10]. www.cicad.oas.org/Smart/Reports/1_ENG.pdf
2 United Nations Office on Drugs and Crime (UNODC). Global Syn-thetic Drugs Assessment: Amphetamine-type stimulants and new psycoactive substances [Internet]. May 2014 [cited 2017 Mar 10]. unodc.org/documents/scientific/2014_Global_Synthetic_Drugs_ Assessment_web.pdf
3 Smith JP, Sutcliffe OB, Banks CE. An overview of recent develop-ments in the analytical detection of new psychoactive substances (NPSs). Analyst. 2015;140:4932-48.
4 European Monitoring Centre for Drugs and Drug Addiction (EMCDDA). European Drug Report: Trends and Developments 2015 [Internet]. 2015 [cited 2017 Mar 10]. emcdda.europa.eu/attache-ments.cfm/att_239505_EN_TDAT15001ENN.pdf
5 United Nations Office on Drugs and Crime (UNODC). World Drug Report 2015 [Internet]. 2015 [cited 2017 Mar 10]. unodc.org/docu-ments/wdr2015/World_Drug_Report_2015.pdf
6 Mendes SV, Troncoso LDy T, do Nascimento BS, Mu¨hlbauer M. Estudo sobre o uso de drogas estimulantes entre estudantes de medicina. Cienc Atual. 2015;5:2-12.
7 Andrade AG, Duarte P, Oliveira LGd. I levantamento nacional sobre o uso de a´lcool, tabaco e outras drogas entre universita´rios das 27 capitais brasileiras. Brası´lia: Secretaria Nacional de Polı´ticas sobre Drogas; 2010.
8 Oliveira LG, Endo LG, Sinagawa DM, Yonamine M, Munoz DR, Leyton V. [Persistent amphetamine consumption by truck drivers in Sa˜o Paulo State, Brazil, despite the ban on production, prescription, and use]. Cad Saude Publica. 2013;29:1903-9.
Figure 1 Conceptual and statistical diagrams illustrating the direct and indirect effects on amphetamine-type stimulant consumption.
Table 3 Conditional effect of income on amphetamine-type stimulant use at moderator values (years of schooling and cocaine use)
Years of schooling
Cocaine
use Effect p-value 95%CI
0 0 -0.0004 0.033 0.000-0.0009 9.5 0 -0.0004 0.006 0.0002-0.0007 19.5 0 -0.0004 0.001 0.0002-0.0006 0 1 0.001 -0.001 -0.003-0.0009 9.5 1 0.001 -0.001 -0.003-0.0009 19.5 1 0.001 -0.001 -0.003-0.0009
9 Wagner GA, Oliveira LG, Barroso LP, Nishimura R, Ishihara LM, Stempliuk Vd A, et al. Drug use in college students: a 13-year trend. Rev Saude Publica. 2012;46:497-504.
10 Schifano F, Corkery J, Naidoo V, Oyefeso A, Ghodse H. Overview of amphetamine-type stimulant mortality data--UK, 1997-2007. Neuro-psychobiology. 2010;61:122-30.
11 Uosukainen H, Tacke U, Winstock AR. Self-reported prevalence of dependence of MDMA compared to cocaine, mephedrone and ketamine among a sample of recreational poly-drug users. Int J Drug Policy. 2015;26:78-83.
12 Sanvicente-Vieira B, Romani-Sponchiado A, Kluwe-Schiavon B, Brietzke E, Araujo RB, Grassi-Oliveira R. Theory of mind in sub-stance users: a systematic minireview. Subst Use Misuse. 2017;52: 127-33.
13 Remy L, Narvaez J, Sordi A, Guimaraes LS, Von Diemen L, Surratt H, et al. Correlates of unprotected sex in a sample of young club drug users. Clinics (Sao Paulo). 2013;68:1384-91.
14 Schenker M, Minayo MCS. Fatores de risco e de protec¸a˜o para o
uso de drogas na adolesceˆncia. Cienc Saude Coletiva. 2005;10: 707-17.
15 Global Drug Survey. Global drug survey 2015 findings [Internet]. 2015. globaldrugsurvey.com/the-global-drug-survey-2015-findings/ 16 United Nations Office on Drugs and Crime (UNODC). World Drug
Report 2013 [Internet]. 2013 [cited 2017 Mar 10]. unodc.org/doc/ wdr2013/World_Drug_Report_2013.pdf
17 Instituto Nacional de Cieˆncia e Tecnologia para Polı´ticas Pu´blicas do A´ lcool e Outras Drogas (INPAD). II Levantamento Nacional de A´lcool e Drogas [Internet]. 2012 [cited 2017 Mar 10]. http://inpad.org.br/ lenad/resultados/relatorio-final/
18 Madruga CS, Laranjeira R, Caetano R, Pinsky I, Zaleski M, Ferri CP. Use of licit and illicit substances among adolescents in Brazil -- a national survey. Addict Behav. 2012;37:1171-5.
19 Abdalla RR, Madruga CS, Ribeiro M, Pinsky I, Caetano R, Laranjeira R. Prevalence of cocaine use in Brazil: data from the II Brazilian national alcohol and drugs survey (BNADS). Addict Behav. 2014; 39:297-301.
20 American Psychiatric Association. Diagnostic and Statistical Manual of Mental Disorders, Fifth Edition (DSM-5). Arlington: American Psy-chiatric Publishing; 2013.
21 StataCorp. Stata statistical software.College Station: StataCorp LP; 2013.
22 Instituto Brasileiro de Geografia e Estatı´stica (IBGE). Censo demo-gra´fico 2010: resultados gerais da amostra [Internet]. 2012 Apr 27. ibge.gov.br/home/presidencia/noticias/imprensa/ppts/000000084731 04122012315727483985.pdf
23 Hayes AF. Introduction to mediation, moderation, and conditional process analysis - a regression-based approach. New York: Guilford; 2015.
24 Preacher KJ. Multilevel SEM strategies for evaluating mediation in three-level data. Multivariate Behav Res. 2011;46:691-731. 25 Preacher KJ, Zhang Z, Zyphur MJ. Alternative methods for assessing
mediation in multilevel data: the advantages of multilevel SEM. Struct Equ Modeling. 2011;18:161-82.
26 Edwards JR, Lambert LS. Methods for integrating moderation and mediation: a general analytical framework using moderated path analysis. Psychol Methods. 2007;12:1-22.
27 Hu Lt, Bentler PM. Cutoff criteria for fit indexes in covariance struc-ture analysis: conventional criteria versus new alternatives. Struct Equ Modeling. 1999;6:1-55.
28 Allison PD. Measures of fit for logistic regression [Internet]. 2014 [cited 2017 Mar 10]. statisticalhorizons.com/wp-content/uploads/GOF ForLogisticRegression-Paper.pdf.
29 Instituto Brasileiro de Geografia e Estatı´stica (IBGE). Pesquisa nacional de sau´de 2013 [Internet]. 2013 [cited 2017 Mar 10]. ibge. gov.br/home/estatistica/populacao/pns/2013/
30 European Monitoring Centre for Drugs and Drug Addiction (EMCDDA). The state of the drugs problem in Europe. Annual Report 2012 [Internet]. 2012 [cited 2017 Mar 10]. emcdda.europa.eu/atta-chements.cfm/att_190854_EN_TDAC12001ENC_.pdf
31 Carlini EA, Galduro´z JCF, Noto AR, Nappo SA. I Levantamento domiciliar sobre o uso de drogas psicotro´picas no Brasil: envolvendo as 107 maiores cidades do paı´s – 2001 [Internet]. 2002 [cited 2017 Mar 10]. institutopaisefilhos.com.br/layout/apostilas/ILDomiciliarUso DrogasPsicotropicas.pdf
32 Carlini EA, Galduro´z JC, Noto AR, Carlini CM, Oliveira LG, Nappo SA, et al. II Levantamento domiciliar sobre o uso de drogas psico-tro´picas no Brasil: estudo envolvendo as 108 maiores cidades do paı´s: 2005. Centro Brasileiro de Informac¸a˜o sobre Drogas Psicotro´picas
(CEBRID): UNIFESP - Universidade Federal de Sa˜o Paulo; 2007. 33 Wagner GA, Stempliuk Vde A, Zilberman ML, Barroso LP, Andrade
AG. Alcohol and drug use among university students: gender differ-ences. Rev Bras Psiquiatr. 2007;29:123-9.
34 Becker JB, Hu M. Sex differences in drug abuse. Front Neuroendo-crinol. 2008;29:36-47.
35 Simons JS, Gaher RM, Correia CJ, Bush JA. Club drug use among college students. Addict Behav. 2005;30:1619-24.
36 Herbeck DM, Brecht ML, Lovinger K, Raihan A, Christou D, Sheaff P. Poly-drug and marijuana use among adults who primarily used methamphetamine. J Psychoactive Drugs. 2013;45:132-40. 37 Davey J, Armstrong K, Martin P. Results of the Queensland
2007-2012 roadside drug testing program: the prevalence of three illicit drugs. Accid Anal Prev. 2014;65:11-7.
38 Escrito´rio das Nac¸o˜es Unidas sobre Drogas e Crime (UNODC).
Normas internacionais de prevenc¸a˜o do uso de drogas [Internet].
2013. unodc.org/documents/lpo-brazil//noticias/2013/09/UNODC_ Normas_Internacionais_PREVENCAO_portugues.pdf