www.biogeosciences.net/12/6809/2015/ doi:10.5194/bg-12-6809-2015
© Author(s) 2015. CC Attribution 3.0 License.
Seasonal and size-dependent variations in the phytoplankton growth
and microzooplankton grazing in the southern South China Sea
under the influence of the East Asian monsoon
L. Zhou1,2, Y. Tan1,2, L. Huang1,2, Z. Hu1,2,3, and Z. Ke1,2
1CAS Key Laboratory of Tropical Marine Bio-resources and Ecology, South China Sea Institute of Oceanology, Chinese
Academy of Sciences, Guangzhou 510301, China
2Guangdong Provincial Key Laboratory of Applied Marine Biology, Guangzhou 510301, China 3University of Chinese Academy of Sciences, Beijing 100049, China
Correspondence to:Y. Tan (tanyh@scsio.ac.cn)
Received: 23 March 2015 – Published in Biogeosciences Discuss.: 29 April 2015
Revised: 28 October 2015 – Accepted: 16 November 2015 – Published: 27 November 2015
Abstract. To examine seasonal and size-dependent varia-tions in the phytoplankton growth and microzooplankton grazing in oligotrophic tropical waters under the influence of seasonal reversing monsoon, dilution experiments were conducted during the summer of 2009 (21 May to 9 June) and winter 2010 (9 to 18 November) in the southern South China Sea (SSCS). The results showed that environmen-tal variables, phytoplankton biomass, phytoplankton growth rate (µ), microzooplankton grazing rate (m), and correlation-ship (coupling) between the µ andm, rather than the mi-crozooplankton grazing impact on phytoplankton (m/µ) sig-nificantly varied between the two seasons. Higher relative preference index (RPI) for the larger-sized (>3 µm) phyto-plankton than pico-phytophyto-plankton (<3 µm), indicating sig-nificant size-selective grazing by microzooplankton on the larger-sized phytoplankton, were also observed. Theµandm were significantly correlated with seawater salinity and tem-perature, and phytoplankton biomass, which indicated that salient seasonal variations in the phytoplankton growth and microzooplankton grazing in the SSCS were closely related to the environmental variables under the influence of the East Asian monsoon. We propose that intermittent arrivals of the northeast winter monsoon could lead to the lowµandm, and the decoupling between theµ andmin the SSCS, through influencing nutrient supply to the surface water, and induc-ing surface seawater salinity decrease. The lowm/µ(<50 % on average) indicates low remineralization of organic matter mediated by microzooplankton and mismatch between the µ andm, and thus probably accounts for part of the high
vertical biogenic particle fluxes in the prevailing periods of the monsoons in the SSCS. The size-selective grazing sug-gests that microzooplankton grazing partially contributes to the pico-phytoplankton dominance in the oligotrophic tropi-cal waters such as that of the SSCS.
1 Introduction
Phytoplankton growth and microzooplankton grazing are crucial processes relating to ocean biogeochemistry and en-ergy flow in the pelagic food web. Phytoplankton provides almost all of the primary production in the upper ocean. Microzooplankton (<200 µm) consumes most of the daily primary production in the sea, and regulates phytoplank-ton community composition, and affects the ultimate fate of the phytoplankton-derived primary production (Banse, 2007, 2013; Landry and Calbet, 2004; Schmoker et al., 2013).
sub-polar, and temperate regions, and tropical waters with salient seasonal reversing monsoon. However, there are few stud-ies investigating both the phytoplankton growth and micro-zooplankton grazing in tropical oceans (Caron and Dennett, 1999; Chen et al., 2013; Landry et al., 1995, 1998, 2011), and the seasonality of phytoplankton growth and microzooplank-ton grazing in tropical waters influenced by salient seasonal reversing monsoon is still less known.
Microzooplankton may modify their food preference de-pending on the morphology, abundance and quality of prey, which would cause phytoplankton community shift in species and/or size composition (Teixeira and Figueiras, 2009). Phytoplankton community in oligotrophic subtropi-cal and tropisubtropi-cal waters is usually dominated by small-sized pico-cells (<3 µm); the pico-phytoplankton consists of three major groups including Prochlorococcus,Synechoccus, and diverse types of pico-eukaryotic phytoplankton (Zubkov et al., 2000). Microzooplankton including both autotrophic and heterotrophic nanoflagellates can actively consume pico-sized prey (An-Yi et al., 2009; Christaki et al., 2005; Frias-Lopez et al., 2009). Landry et al. (1998) proposed that the balance between microzooplankton grazing and phyto-plankton growth was consistent with the dominance of pico-plankton in oligotrophic offshore regions in the Arabian Sea. Significantly higher microzooplankton grazing rates on the large-sized phytoplankton (>5 µm) than the smaller one (<5 µm) have been recently reported in the oligotrophic sub-tropical Northeast Atlantic (Cáceres et al., 2013). Our recent results suggest that size-selective grazing by microzooplank-ton on nano-sized (3–20 µm) phytoplankmicrozooplank-ton contributes to the pico-phytoplankton dominance in the oligotrophic trop-ical waters of the South China Sea (SCS) in summer (Zhou et al., 2015a). However, until now, the role played by micro-zooplankton in the pico-phytoplankton dominance in olig-otrophic tropical waters is still less examined.
The southern SCS (SSCS) is characterized with perma-nent water stratification and oligotrophic conditions in the upper layer, and is affected by seasonal reversing monsoon. During the middle of May to September, the SSCS is un-der the influence of the southwest summer monsoon, while this area is influenced by the stronger northeast winter mon-soon during November to the next April (Su, 2004). Seasonal variation of seawater salinity and temperature, vertical nu-trient flux, and mixed-layer depth driven by the East Asian Monsoon have been reported (Fang et al., 2002; Liu et al., 2002; Longhurst, 2007; Ning et al., 2004). Mesoscale ed-dies with obvious seasonal variation (Fang et al., 1998, 2002; Zhang et al., 2014) and seasonal pattern of higher phyto-plankton biomass, primary production, and vertical biogenic particle fluxes during the prevailing periods of the monsoons and wintertime occur in the SSCS (Liu et al., 2002; Ning et al., 2004; Wan et al., 2010). There are hundreds of coral shoals, reefs, and islands called the Nansha Islands located in this area, making the SSCS worthy of a component of the Archipelagic Deep Basins Province (ARCH) defined by
Longhurst (2007) . Many researchers including Qingchao Chen, Liangmin Huang and their co-workers from the South China Sea Institute of Oceanology, Chinese Academy of Sci-ences, have previously investigated the environment vari-ables, marine species diversity, and ecological processes in the coral reef lagoons of the Nansha Islands and its adjacent waters during the 1980s to 1990s (e.g. Chen and Mutidis-ciplinary Expedition to Nansha Islands, 1991, 1989, 1994, 1996, 1998; Huang and Multidisciplinary Expedition to Nan-sha Islands, 1997). Their works provide valuable contribu-tions to the understanding of the taxonomic composition and distribution of phytoplankton, bacteria, zooplankton and fish, and ecological processes such as primary production in the SSCS. However, these results are seldom published in inter-national media, even in scientific journals in Chinese, and are thus less known to the scientific community. So far, there are no data reported on the microzooplankton grazing in this re-gion. We hypothesize that seasonal changes in both the phy-toplankton growth and microzooplankton grazing is expected in the tropical waters influenced by salient seasonal revers-ing monsoon, and microzooplankton contributes to the phy-toplankton size composition through size-selective grazing in the SSCS.
To test the hypotheses, we conducted a series of dilution experiments in adjacent waters of the Nansha Islands in the SSCS during two cruises in May to June 2009 and Novem-ber 2010. Significant seasonal variations in the phytoplank-ton growth and microzooplankphytoplank-ton grazing and apparently size-selective grazing were observed.
2 Material and methods
Dilution experiments (Landry and Hassett, 1982) were con-ducted at 14 stations during 21 May to 9 June 2009 (sum-mer), and at 10 stations during 9 November to 18 Novem-ber 2010 (winter). Stations KJ28 and KJ32 were located at the basin waters northwest to the Nansha Islands; station YS was located at the lagoon of the Yongshu Reef/Island, the other stations were distributed in waters around the Nansha Islands (Fig. 1).
110°E 115°E 120°E 6°N
8°N 10°N 12°N 14°N
KJ28
KJ32
KJ35
KJ39
KJ42 KJ47 KJ50 KJ53
KJ65 KJ73
YS
KJ41 ns25
NS19 Ns16
KJ69 NS12
105°E 110°E 115°E 120°E 125°E 2°N
4°N 6°N 8°N 10°N 12°N 14°N 16°N 18°N 20°N 22°N 24°N
200 m
isobath
South China Sea
NanSha Islands
Figure 1.Stations for dilution experiments in the southern South China Sea during May to June 2009 and November 2010. The open circle indicates experimental stations during May to June 2009; the cross indicates experimental stations during November 2010. The dashed circle shows the schematic area of the Nansha Islands.
79.2, and 100 % unfiltered seawater were prepared for the winter experiments. All the bottles were enriched with ad-ditional nutrients (final concentrations of 0.5 µM NH4Cl,
0.03 µM KH2PO4, 1.0 nM FeSO4and 0.1 nM MnCl2) to
pro-mote constant phytoplankton growth. Two bottles were filled with unfiltered seawater without nutrient enrichment served as no nutrient controls. Another two bottles filled with unfil-tered seawater were sacrificed for initial samples of chloro-phyll a (Chla). All of the bottles were incubated for 24 h in a deck incubator cooled by running surface seawater and covered with neutral-density screens to simulate in situ light regime. These measures have been proved effective to avoid phytoplankton photoacclimation during the incubation (Zhou et al., 2015a)
Seawater was filtered through a sequence of 3-µm pore size polycarbonate filter and GF/F filter for size-fractionated Chlaof the larger-sized (>3 µm) and pico- (<3 µm) phyto-plankton. Total Chla was calculated as the sum of the two size fractions or directly sampled by filtering 0.5 to 1 L sea-water on the GF/F filter. The filters were extracted in 90 % acetone at −20◦C for 24 h. The Chl a concentration was measured by fluorometry using a Turner Designs Model 10 Fluorometer (Parsons et al., 1984).
Seawater temperature, salinity, and silicate concentration were also measured. Temperature and salinity were deter-mined by Conductivity-Temperature-Depth probes. Silicate in seawater was analysed with a flow-injection autoanalyser (Quickchem 8500, Lachat Instruments) following the stan-dard manuals.
Assuming an exponential growth model, the net growth rate (kd) of phytoplankton in a dilution treatment was
cal-culated according to the formula kd=ln (Pt/ dP0), where
d is the dilution factor (the proportion of unfiltered seawa-ter),Pt is the Chlaconcentration after incubation andP0is
the initial Chla concentration. Phytoplankton growth rates with nutrient amendment (µn) and microzooplankton
graz-ing rates (m) were estimated from Model I linear regressions of net growth rate (k) vs. dilution factor (d). In situ phyto-plankton instantaneous growth rates (µ) were calculated as the sum ofmand net growth rate in control bottles without added nutrients.
When saturated or saturated-increasing grazing was ob-served as a departure from the assumed linear model (Gal-legos, 1989; Teixeira and Figueiras, 2009) by visual inspec-tion of the plots,mandµwere calculated on the basis of the method of Chen et al. (2009a).
Size-fractionated (>3 and<3 µm) phytoplankton growth and mortality rates were estimated for experiments at YS and KJ35 during the summer cruise, and all the experiments dur-ing the winter cruise.
Nutrient limitation index indicating nutrient sufficiency for phytoplankton growth was assessed by the ratioµ/µn,
which is expected to vary with system trophic state (Landry et al., 1998). The microzooplankton grazing impact on phy-toplankton was assessed by the ratio of microzooplankton grazing to phytoplankton growth rates (m/µ), and mea-sures the extent to which the daily phytoplankton produc-tion is consumed and balanced by microzooplankton grazing (Landry et al., 1998).
Grazing selectivity for size-fractionated phytoplank-ton was analysed following the relative preference in-dex (RPI) provided by Obayashi and Tanoue (2002) as RPI=[mchlai]/P[mchlai]
[chlai]/P[chlai] , where [mchl a] is the amount of
daily grazed Chla (µg L−1d−1), subscripti refers to each size fraction analysed and [Chl a] is the concentration of Chla(µg L−1). RPI>1 indicates positive selection and vice
versa.
All the statistical analyses were conducted by using the SPSS 17.0. The average value of the ratio variables such as m/µwas presented as the geometric mean, while other aver-age values were presented as the arithmetic mean.
3 Results
3.1 Environmental variables and Chla
sum-Salinity
31 32 33 34 35
summer
winter
Silicate (µmol L-1 )
0 10 20 30
summer
winter Temperature (o
C)
12 16 20 24 28 32
Depth
(m)
-250 -200 -150 -100 -50 0
summer
winter
Figure 2. Vertical profiles of seawater temperature, salinity, and silicate concentration in the southern South China Sea during May to June 2009 (summer) and November 2010 (winter). The error bar indicates standard deviation.
mer cruise (mean±sd: 0.066±0.022 µg L−1) (independent
t test,p <0.01). Pico-phytoplankton (<3 µm) accounted for most (>80 %) of the total Chl a during both the cruises. The proportion of pico-phytoplankton in the winter cruise (mean±sd: 81.9±5.0 %) was similar to that in the sum-mer cruise (mean±sd: 83.0±1.8 %) (independent t test, p >0.1).
3.2 Feeding responses in dilution experiments
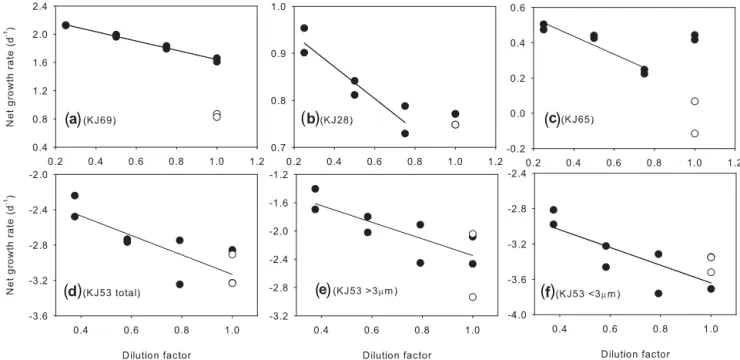
The detailed results of each dilution experiment were listed in Tables 1 and 2. Except for linear feeding responses, both the saturated and saturated-increased feeding responses de-scribed by Teixeira and Figueiras (2009) occurred in the di-lution experiments during both the cruises (Fig. 3a–c). Non-linear feeding responses occurred at 8 of the 14 experiments during the summer cruise, while those occurred at 4 of the 10 experiments during the winter cruise (Tables 1 and 2). Dur-ing the winter cruise, substantially negative phytoplankton growth rates (µ) and high microzooplankton grazing rates (m) were observed at KJ53 (Fig. 3d–f). The negativeµ ob-tained at KJ53 and the derivative parameters (e.g.m/µ) were not included for the comparison between seasons and size fractions.
3.3 Comparison of the phytoplankton growth and microzooplankton grazing between the two seasons The phytoplankton growth and microzooplankton grazing were significantly different between the two cruises. The µ in the winter cruise (mean±sd: 0.54±0.22 d−1) was
signif-icantly lower than those in the summer cruise (mean±sd: 0.92±0.32 d−1) (independentttest,p <0.01). Themin the winter cruise (mean±sd: 0.27±0.13 d−1) was also signif-icantly lower than those in the summer cruise (mean±sd: 0.46±0.20 d−1) (independent t test, p <0.01). However, the m/µ ratio was almost equally low both in the sum-mer (geometric mean±sd: 49±23 %) and winter (geomet-ric mean±sd: 48±33 %) cruises.
3.4 Size-dependent phytoplankton growth and microzooplankton grazing
Theµandmvaried between size fractions. Highermon the larger size fraction was observed at YS (0.65 d−1for the size
fraction>3 µm vs. 0.33 d−1for the size fraction<3 µm) and
KJ35 (0.39 d−1for the size fraction>3 µm vs. 0.30 d−1for
the size fraction<3 µm) during the summer cruise. Theµof the larger-sized (>3 µm) and pico- (<3 µm) phytoplankton were 1.07 and 0.75 d−1at YS, and 0.69 and 0.90 d−1at KJ35, respectively. During the winter cruise, the mon the larger size fraction (mean±sd: 0.50±0.41 d−1) was higher than those on pico-phytoplankton (mean±sd: 0.27±0.27 d−1) at 7 of the 10 experiments, and the µ of the larger size fraction (mean±sd: 0.88±0.38 d−1) were also higher than those of pico-phytoplankton (mean±sd: 0.42±0.31 d−1) at 7 of the 9 experiments (exclude data at KJ53) (Table 3). Them/µwas higher for the larger size fraction (57.3 % at KJ35 and 61.2 % at YS) than pico-phytoplankton (33.3 % at KJ35 and 44.0 % at YS) during the summer cruise, while them/µwas not significantly different between the two size fractions (41.1±82.8 % for the size fraction >3 µm, and 39.4±21.1 % for the size fraction <3 µm) during the win-ter cruise (Table 3).
Higher RPI for the larger-sized phytoplankton than pico-phytoplankton was observed during both cruises (Fig. 4). The RPI for the larger-sized phytoplankton was higher than one (geomean±sd: 1.44±0.31), while the RPI for pico-phytoplankton was lower than one (geomean±sd: 0.90±0.07) during the summer cruise. The RPI was signif-icantly (Mann-Whitney test,p <0.05) higher for the larger-sized phytoplankton (geomean±sd: 1.44±1.57) than pico-phytoplankton (geomean±sd: 0.61±0.35) during the win-ter cruise.
3.5 Nutrient limitation to the phytoplankton growth
Nutrient limitation index (µ/µn) was significantly higher
Table 1.Summary of environmental variables, phytoplankton growth rates with (µn, d−1) and (µ, d−1) without nutrient amendment, and microzooplankton grazing rates (m, d−1) in the southern South China Sea in May–June 2009. SST, surface seawater temperature (◦C); SSS, surface seawater salinity; 25-T (S) seawater temperature (salinity) at 25 m in depth; Si, silicate (µmol L−1); Chla, chlorophylla(µg L−1); n, the number of data points in the linear part;R2, the determination coefficient of the regression of the linear part; se, standard error; the superscript “a” denotes a saturated feeding response; the superscript “b” denotes a saturated-increased feeding response. The significant level (p) of regressions when saturated or saturated-increased feeding responses occurred was in some occasions>0.05 owing to the few points included in the regression.
Station Date Depth SST SSS 25-T 25-S Si Chla µn m±se µ±se R2 n p µ/µ
n m/µ±se
KJ28 21 May 2899 29.90 32.90 28.02 33.07 2.0 0.087 1.01 0.34±0.06 1.09±0.03 0.88 6a 0.006 1.08 0.31±0.02 KJ35 22 May 3243 29.60 32.41 29.05 32.91 1.6 0.086 1.11 0.30±0.19 0.85±0.08 0.83 4a 0.086 0.77 0.35±0.11 YS 23 May 28 29.10 32.77 – – 0.3 0.082 0.74 0.40±0.17 0.82±0.11 0.50 8 0.052 1.12 0.49±0.08 KJ41 25 May 1724 29.93 32.83 28.60 33.25 1.7 0.079 1.04 0.57±0.13 0.84±0.09 0.76 8 0.005 0.80 0.68±0.06 KJ47 26 May 468 31.03 32.60 29.63 32.90 1.8 0.049 1.10 0.61±0.12 0.90±0.06 0.87 6b 0.007 0.82 0.67±0.06
NS25 28 May 2025 30.12 32.72 29.65 32.74 6.8 0.036 1.16 0.71±0.21 1.30±0.14 0.66 8 0.015 1.12 0.55±0.06 NS19 30 May 2057 30.28 32.94 29.18 33.20 1.0 0.050 1.51 0.79±0.45 1.20±0.28 0.61 4b 0.216 0.79 0.66±0.20
KJ39 31 May 2001 29.60 32.89 29.11 33.03 9.0 0.050 1.50 0.49±0.09 0.83±0.06 0.85 8 0.001 0.55 0.59±0.04 NS16 31 May 1589 29.88 32.94 29.77 33.01 5.2 0.044 1.00 0.46±0.17 1.04±0.11 0.56 8 0.033 1.05 0.44±0.06 KJ65 02 Jun 2999 28.95 32.82 28.78 32.90 3.4 0.096 0.64 0.21±0.09 0.19±0.05 0.90 6b 0.004 0.29 1.13±0.22 KJ69 05 Jun 1522 29.02 32.86 28.93 32.93 6.5 0.057 2.30 0.66±0.03 1.50±0.02 0.99 8 <0.001 0.65 0.44±0.01 KJ73 06 Jun 1785 29.50 32.84 29.24 32.90 6.4 0.045 0.78 0.48±0.52 0.87±0.20 0.30 4b 0.450 1.11 0.55±0.30 NS12 07 Jun 920 29.26 33.05 28.90 33.12 4.6 0.062 1.19 0.39±0.09 0.88±0.05 0.82 6b 0.013 0.73 0.45±0.05 KJ32 09 Jun 4229 28.84 32.97 28.85 33.00 3.2 0.105 0.54 0.09±0.02 0.54±0.01 0.99 4a 0.006 0.99 0.16±0.02
Table 2.Summary of environmental variables, phytoplankton growth rates with (µn, d−1) and without (µ, d−1) nutrient amendment, and microzooplankton grazing rates (m, d−1) in the southern South China Sea in November 2010. SST, surface seawater temperature (◦C); SSS, surface seawater salinity; 25-T (S) seawater temperature (salinity) at 25 m in depth; Si, silicate (µmol L−1); Chla, chlorophylla(µg L−1); n, the number of data points in the linear part;R2, the determination coefficient of the regression of the linear part; se, standard error; the superscript “a” denotes a saturated feeding response; the superscript “b” denotes a saturated-increased feeding response. The significant level (p) of regressions when saturated-increased feeding responses occurred was in some occasions>0.05 owing to the few points included in the regression.
Station Date Depth SST SSS 25-T 25-S Si >3 µm Chla <3 µm Chla µn m±se µ±se R2 n p µ/µn m/µ±se
KJ28 09 Nov 2538 28.89 32.35 28.74 33.33 8.4 0.013 0.120 0.66 0.17±0.04 0.45±0.03 0.77 8 0.009 0.69 0.38±0.03
KJ32 09 Nov 4229 29.07 32.20 28.93 33.50 6.5 0.024 0.085 1.30 0.16±0.09 0.74±0.06 0.37 8 0.108 0.57 0.22±0.04
KJ35 10 Nov 2903 28.97 31.86 28.05 32.15 5.9 0.013 0.084 1.28 0.43±0.15 0.96±0.12 0.67 6 0.047 0.75 0.45±0.07
KJ39 11 Nov 1996 29.22 31.70 29.41 33.11 20.2 0.015 0.091 0.77 0.26±0.20 0.28±0.10 0.89 4b 0.059 0.37 0.92±0.39
KJ42 12 Nov 1460 29.62 31.46 29.32 32.66 7.3 0.017 0.088 0.39 0.13±0.11 0.50±0.06 0.38 4b 0.383 1.27 0.25±0.11
KJ47 13 Nov 511 29.45 32.31 29.33 32.36 9.7 0.037 0.121 1.84 0.46±0.62 0.60±0.50 0.12 6 0.497 0.33 0.77±0.50
KJ50 14 Nov 1259 29.22 31.69 29.18 32.98 6.0 0.020 0.069 0.90 0.13±0.08 0.43±0.04 0.94 4b 0.030 0.48 0.30±0.09
KJ53 14 Nov 145 29.62 32.06 28.92 33.20 3.8 0.017 0.050 −2.03 1.01±0.33 −2.06±0.24 0.65 8 0.015 – –
KJ65 16 Nov 2100 29.26 31.83 29.27 32.93 6.6 0.014 0.077 0.97 0.33±0.16 0.28±0.13 0.52 6 0.106 0.29 1.15±0.31
KJ73 18 Nov 1672 29.42 31.72 29.50 32.84 4.4 0.017 0.077 0.87 0.34±0.10 0.57±0.05 0.94 4a 0.030 0.66 0.59±0.09
(geometric mean ±sd: 0.80±0.25) than the winter cruise (geometric mean±sd: 0.54±0.30). Theµ/µnwas
approxi-mate to or larger than 1 at 5 of the 14 experiments in the sum-mer. In contrast, theµ/µnwas apparently lower than one at
8 of the 9 experiments (excluding data at KJ53) in the winter (Tables 1 and 2).
3.6 Correlations between the growth and grazing rates with environmental variables
Taking all the data from the two cruises together, the av-erage µ andm were 0.77±0.34 and 0.39±0.20 d−1. The µwere positively correlated with SST (r=0.43,p <0.05), SSS (r=0.55, p <0.01), µ/µn (r=0.50, p <0.05), net
phytoplankton growth rate (r=0.83,p <0.01), andm(r= 0.76,p <0.01), but were negatively correlated with Chla (r= −0.65,p <0.01) (Table 4). Themwere also positively
correlated with SST (r=0.62,p <0.01) and SSS (r=0.48, p <0.05), but was negatively correlated with Chl a (r= −0.66,p <0.01) (Table 4).
3.7 Correlations between the phytoplankton growth and microzooplankton grazing
( )
( )
( )
( )
( )
( )
Figure 3.Examples of dilution experiment plots of net phytoplankton growth rate as a function of dilution factor.(a)Linear feeding responses in the dilution experiment at KJ69;(b) saturated feeding responses in the dilution experiment at KJ28;(c)saturated-increasing feeding responses in the dilution experiment at KJ65;(d–f)negative phytoplankton growth rates at KJ53,(d)for total phytoplankton,(e)for the size fraction>3 µm and(f)for the size fraction<3 µm; the black circle indicates experimental bottles enriched with addition nutrients; the open circle indicates experimental bottles without nutrient amendment.
Table 3.Comparison of phytoplankton growth and mortality rates between two size fractions in the southern South China Sea in November 2010.µn, phytoplankton growth rates with nutrient amendment (d−1);µ, phytoplankton growth rates without nutrient amendment (d−1); m, microzooplankton grazing rates or phytoplankton mortality rates caused by microzooplankton grazing (d−1); se, standard error; the superscript “a” denotes a saturated feeding response; the superscript “b” denotes a saturated-increased feeding response. The significant level (p) of regressions when saturated or saturated-increased feeding responses occurred was in some occasions>0.05 owing to the few points included in the regression.
Size fraction Station µn m±se µ±se R2 n p µ/µn m/µ
<3 µm KJ28 0.57 0.15±0.06 0.39±0.04 0.57 8 0.050 0.69 0.37±0.05 KJ32 1.29 0.16±0.12 0.78±0.09 0.23 8 0.231 0.60 0.21±0.06 KJ35 1.30 0.50±0.18 1.01±0.15 0.65 6 0.052 0.78 0.50±0.08 KJ39 0.50 0.12±0.15 0.05±0.07 0.89 4a 0.058 0.10 2.42±2.34 KJ42 0.26 0.05±0.18 0.33±0.09 0.04 4b 0.791 1.24 0.16±0.29 KJ47 1.27 0.10±1.67 0.18±1.16 0.00 4a 0.958 0.14 0.55±4.92 KJ50 0.73 0.01±0.05 0.32±0.02 0.96 4b 0.020 0.43 0.03±0.07 KJ53 −2.64 0.89±0.34 −2.55±0.25 0.59 8 0.027 0.96 – KJ65 0.85 0.29±0.17 0.15±0.14 0.42 6 0.167 0.18 1.88±0.83 KJ73 0.80 0.39±0.05 0.58±0.03 0.94 6a 0.001 0.73 0.67±0.04
Table 4.Pearson correlation analyses between dilution experimental parameters and environmental variables.µ, phytoplankton growth rates without nutrient amendment;µn, phytoplankton growth rates with nutrient amendment;m, microzooplankton grazing rates; SST, surface seawater temperature; SSS, surface seawater salinity; Si, silicate; Chla, chlorophylla.
µ m SST SSS Si Chla m/µ µ/µn µ-m
µ 1 0.762∗∗ 0.425∗ 0.547∗∗ −0.348 −0.646∗∗ −0.356 0.496∗ 0.827∗∗ m 1 0.617∗∗ 0.477∗ −0.206 −0.660∗∗ 0.252 0.163 0.266
SST 1 0.225 −0.289 −0.542∗∗ 0.093 0.332 0.098
SSS 1 −0.465∗ −0.519∗ −0.061 0.293 0.396
Si 1 0.304 0.239 −0.406 −0.336
Chla 1 −0.007 −0.404 −0.389
m/µ 1 −0.597∗∗ −0.748∗∗
µ/µn 1 0.596∗∗
µ-m 1
∗∗Significant correlation at the level of 0.01;∗significant correlation at the level of 0.05.
Figure 4.Relative preference index (RPI) for size-fractionated phy-toplankton. >3 µm, size fraction larger than 3 µm; <3 µm, size fraction smaller than 3 µm; the asterisk indicates experiments con-ducted in May 2009, others were concon-ducted in November 2010. RPI >1 indicates positive selection and vice versa.
4 Discussion
4.1 Comparisons with other studies
All the µ (except those obtained at KJ53 during the win-ter cruise) andmwere within the reviewed ranges based on global data collection (Calbet and Landry, 2004; Schmoker et al., 2013). Substantivembut negativeµwere observed at KJ53 (Fig. 3d–f), the only station located on the continental shelf with a bottom depth less than 200 m (Fig. 1).
4.1.1 Negative phytoplankton growth rates
Negative µ have been extensively reported in previous di-lution experiments (e.g. Burkill et al., 1987; Loebl and
Beusekon, 2008; Suzuki et al., 2002; Zhou et al., 2011). Zhou et al. (2013) reviewed that temperature and light regime during incubation, insufficient sampling, contamination of particle-free water and the added nutrients, and decay of phy-toplankton blooms could be the possible reasons for the neg-ativeµin dilution experiments. Our measures to mimic the in situ light and temperature during incubation exclude light and temperature from the factors for the substantially neg-ative µ. Insufficient sampling also unlikely contributed to the negativeµsince sufficient mixing was conducted before Chlasampling. The substantivemcould exclude tion as the reason for the negative rates, because contamina-tion could not only cause phytoplankton death, but also less microzooplankton grazing. We conjecture that phytoplank-ton community decay may occur and lead to the negativeµ at KJ53. The lowest silicate concentration at KJ53 may be related to the phytoplankton community decay and the neg-ativeµ. Why the lowest silicate concentration occurred and to what extent the low nutrient condition was related to the negative phytoplankton growth is a topic that needs further assessment.
4.1.2 Non-linear feeding responses
( )
( )
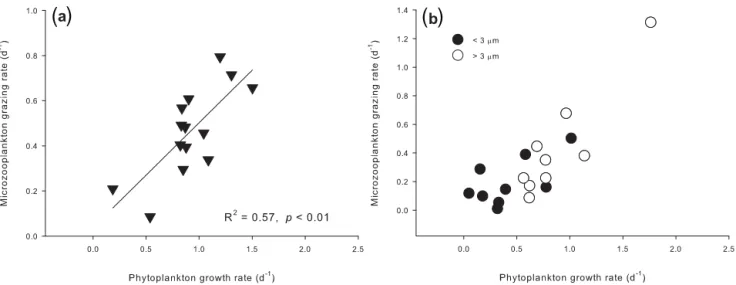
Figure 5.Correlationship between phytoplankton growth and microzooplankton grazing rates.(a)May to June 2009;(b)November 2010; >3 µm, size fraction larger than 3 µm;<3 µm, size fraction smaller than 3 µm.
Table 5.Comparisons of environmental variables, and phytoplankton growth and microzooplankton grazing between May–June 2009 and November 2010 in the southern South China Sea. SST, surface seawater temperature (◦C); SSS, surface seawater salinity; Si, silicate (µmol L−1); Chla, chlorophylla(µg L−1);µn, phytoplankton growth rates with nutrient amendment (d−1); µ, phytoplankton growth rates without nutrient amendment (d−1);m, microzooplankton grazing rates (d−1);p, the significant level. The mean ratio values ofµ/µnand m/µwere compared based on the Mann-Whitney test, while the other mean values were compared based on the independentt test. The ratio values ofµ/µnandm/µwere shown as geometric mean±standard deviation, while other parameters were displayed as arithmetic mean±standard deviation.
Season SST SSS Si Chla µ/µn m µ m/µ
Summer 29.64±0.60 32.82±0.16 3.8±2.6 0.066±0.022 0.80±0.25 0.46±0.20 0.92±0.32 0.49±0.23 Winter 29.27±0.25 31.92±0.30 7.9±4.7 0.104±0.024 0.54±0.30 0.27±0.13 0.54±0.22 0.48±0.33 p 0.055 <0.01 <0.05 <0.01 <0.05 <0.01 <0.01 >0.1
due to varied nutrient limitation in experimental bottles, in the morality rate related to microzooplankton abundance and feeding behaviour and even virus infection could be related to the non-linear responses. As additional nutrients were added in the experiments bottles, we do not think that nutri-ent limitation was the factor causing the non-linear responses in our experiments. Instead, we think that the sufficient nu-trients added in the experimental bottles led to high phy-toplankton abundance in the less-diluted bottles. Microzoo-plankton may reach a maximum ingestion rate at high food concentration, and the maximum ingestion rate may remain constant despite further increase in prey abundance, which is often used to explain the occurrence of saturated feed-ing responses in dilution experiments for eutrophic ecosys-tems (Gallegos, 1989; Moigis, 2006; Teixeira and Figueiras, 2009), and could explain those in our experiments. While the saturated-increased responses observed in the present study imply that decrease in the ingestion rate should occurr along with the further increase in food abundance. There is no concluded explanation for the decrease in the ingestion rate. Teixeira and Figueira (2009) proposed that prey selection by
microzooplankton in waters with high and diverse food abun-dance may account for the decrease. We consider that nutri-ent amendmnutri-ent in the experimnutri-ental bottles may give rise to relatively higher phytoplankton (food) abundance, leading to decrease in the ingestion rate and accounting for the occur-rence of saturated-increased responses in our experiments.
4.1.3 Phytoplankton growth and microzooplankton grazing rates in low-latitude tropical waters
There is no study on microzooplankton grazing in the SSCS, especially in waters around the Nansha Islands. If any, Chen et al. (2009b) reported an averageµof 0.75±0.62 d−1and
an averagemof 0.65±0.51 d−1in the western SCS
north-west to the present study waters in summer. These rates were similar to our results observed during the summer cruise (Ta-ble 5).
in the central equatorial Pacific Ocean. These results are similar to ours observed during the summer cruise. Landry et al. (2011) reported a low average µ of 0.43±0.14 and m of 0.31±0.11 d−1 in the high-nutrient-low-chlorophyll (HNLC) equatorial Pacific Ocean. These rates are similar to the rates observed during the winter cruise in the present study. Yang et al. (2004) investigated the phytoplankton growth and microzooplankton grazing in the western Pacific waters with latitudes similar to those of the SSCS. Their reported µ and m in summer were 0.35 to 0.75 d−1, and 0.51 to 0.67 d−1, which are similar to our results observed during the summer cruise. Landry et al. (1998) showed an average µ of 0.5 and an average mof 0.6 d−1 at the olig-otrophic stations in the subtropical and tropical Arabian Sea. Caron and Denett (1999) reported themof 0.35±0.18 and 0.30±0.17 d−1 during the northeast monsoon season and
spring intermonsoon season in the Arabian Sea, respectively. Themwere similar to the lowm(0.27±0.13 d−1) observed
during the northeast monsoon season in the present study. The growth and grazing rates of pico-phytoplankton esti-mated in the present study fall into the middle range of those rates of the main pico-phytoplankton groups ( Prochlorococ-cus,Synechococcusand eukaryotic pico-phytoplankton) re-ported in previous studies (reviewed data in Table II in Hi-rose et al., 2008). Based on cell cycle analysis, Yang and Jiao (2002) reported the in situProchlorococcusgrowth rate of 0.54 d−1at the chlorophyll maximum layer in the SSCS in May. This rate is lower than the pico-phytoplankton growth rate observed (at YS and KJ35) during the summer cruise, but slightly higher than that (0.42 d−1on average) observed
dur-ing the winter cruise. Lower average growth rate (0.15 d−1)
of Prochlorococcusin the subtropical and tropical Atlantic has been reported by Zubkov et al. (2000).
4.2 Seasonal variations in phytoplankton growth and microzooplankton grazing
Our results showed pronounced seasonal changes in the phy-toplankton growth and microzooplankton grazing, but not the microzooplankton grazing impact on phytoplankton (m/µ), in the SSCS. Many studies have found pronounced seasonal-ity in the phytoplankton growth and microzooplankton graz-ing in temperate and high-latitude waters (e.g. Calbet et al., 2008; Kim et al., 2007; Lawrence and Menden-Deuer, 2012; Loebl and Beusekon, 2008). Nevertheless, there are few stud-ies on the seasonality of the microzooplankton grazing in oligotrophic tropical waters. From the perspective of phyto-plankton growth, Landry et al. (2011) reported that µ was slightly higher in December than September in the HNLC waters of the equatorial Pacific, but the rate was not signif-icantly different between periods of the southwest monsoon and the early northeast monsoon in the Arabian Sea (Landry et al., 1998); while Caron and Denett (1999) demonstrated that µ was approximately twice as high during the north-east monsoon season than the spring intermonsoon period
in the Arabian Sea. Chen et al. (2013) observed thatµ in surface water of the northern SCS was significantly higher in the summer than winter. However, the previous studies showed no seasonal variation in microzooplankton grazing in the HNLC waters of the equatorial Pacific (Landry et al., 1995, 2011), the Arabian Sea (Caron and Dennett, 1999; Landry et al., 1998) and oligotrophic surface waters of the northern SCS (Chen et al., 2013). Significantly lowermin the summer than winter at the chlorophyll maximum layer in the northern SCS has been reported by Chen et al. (2013). From the data published by Quevedo and Anadón (2001), we calculated that the µ and m were higher in the sum-mer (0.61±0.43 and 0.49±0.28 d−1) than in the spring (0.33±0.27 and 0.29±0.18 d−1) in the oligotrophic sub-tropical Northeast Atlantic. Lower averageµandmfor pico-phytoplankton in the winter than summer have been recently reported in the subtropical East China Sea (Guo et al., 2014). These results are consistent with the significant seasonal vari-ations in the phytoplankton growth and microzooplankton grazing in the SSCS in the present study.
4.3 East Asian monsoon influencing seasonal variations in phytoplankton growth and microzooplankton grazing by affecting nutrient supply and salinity decrease in surface water
Seasonal variations in environmental variables, related to the East Asian monsoon, may directly and/or indirectly influence phytoplankton growth and microzooplankton grazing. Sig-nificant seasonal changes in a host of environmental variables including salinity, dissolved inorganic nutrients, and phyto-plankton biomass were indeed observed (Table 5). The corre-lationship betweenµandmwith the environmental variables indicate that seasonal variations in the phytoplankton growth and microzooplankton grazing were related to the contrast-ing environmental conditions under the influence of the East Asian monsoon (Table 4).
Many studies have showed increased m during the warmest seasons and reducedmandµin winter months (e.g. Ara and Hiromi, 2009; Lawrence and Menden-Deuer, 2012). Both theµandmwere positively correlated with tempera-ture in the present study. However, the mean seasonal tem-perature discrepancy was less than 0.4◦C and not significant (independentt test, p=0.055) (Table 5). We do not think this slight temperature variation alone could account for the substantial decrease in theµandmobserved in the northeast monsoon season.
consistent with previous results of relatively higher dissolved nutrients, phytoplankton biomass and primary production in surface waters of the SCS in winter (Liu et al., 2002; Ning et al., 2004). It is easy to understand that the stronger northeast monsoon could increase nutrient supply to the surface layer by enhancing vertical mixing and basin-scale uplift of nutri-cline depth (Liu et al., 2002). However, this kind of nutrient supply in the SSCS could be episodically influenced by inter-mittent arrivals of the strong northeast monsoon in the form of strong cold air. Therefore, we infer that nutrient supply to the surface water under the influence of the northeast mon-soon may stimulate sporadic enhancement in phytoplankton production and biomass.
The arrival of strong northeast monsoon may bring not only nutrient supply to the surface water as a result of en-hanced vertical mixing, but also SSS decrease due to heavy frontal rainfall when the cold air meets the warm and wet local air. A strong rainy season is usually developed from October to January in the SSCS (Wyrtki, 1961). The remote-sensing data from the Tropical Rainfall Measuring Mission indeed showed that apparently larger rainfall occurred during the winter than summer (Fig. 6). The large rainfall could not only bring nutrients such as nitrate in rainwater to the surface water (Kodama et al., 2011), but also dilute and freshen the surface seawater (as those observed during the winter cruise). In addition, after the passage of the strong cold air, the winds over the SSCS are always weak. The low-wind condition could facilitate the less saline surface water overlying on the more saline deep water to form the “freshwater cap” (Zeng et al., 2009). The salinity discrepancy between surface water and that at 25 m in depth was several times higher during the winter cruise (0.99) than the summer cruise (0.17) (Tables 1 and 2), indicating that a freshwater cap formed during the winter cruise in the SSCS (Fig. 2).
The freshwater cap could enhance water stratification and block nutrient supply to the surface layer, thus nutrients in surface water could be depleted by the phytoplankton com-munity, and lead to nutrient limitation to the growth of the phytoplankton community with already increased biomass. The high µ/µn (approximate to or higher than one)
indi-cated that phytoplankton growth was only slightly or even not nutrient-limited during the summer cruise (Table 1). Sim-ilar results in the oligotrophic subtropical Northeast Atlantic have also been reported (Cáceres et al., 2013; Quevedo and Anadón, 2001). In contrast, severe nutrient limitation indi-cated by the lowerµ/µn(0.54±0.30) was observed during
the winter, which may account for part of the lowµ(Table 5). The freshwater cap could also impact the microzooplank-ton grazing indirectly. First, the formation of freshwater cap might inhibit the migration of mesozooplankton (e.g. copepods) into the water with lower salinity and change the mesozooplankton composition in the water column in the studied waters, as similar salinity effects on mesozoo-plankton have been observed in estuarine and inshore waters (Grindley, 1964; Zhou et al., 2015b), which can release the
mesozooplankton grazing pressure on ciliates, then through trophic cascades increase the ciliate grazing on nanoflag-ellates (HNF) (Chen et al., 2012), reducing the abundance of HNF – the main grazer on pico-phytoplankton (Safi and Hall, 1999) – and releasing the grazing pressure on pico-phytoplankton (Klauschies et al., 2012). Second, as dis-cussed above, the impeding effect of freshwater cap on phy-toplankton accesses to nutrients could lead to poor food qual-ity of phytoplankton as prey, and thus reduce the grazing ac-tivity of microzooplankton. Both the arguments suggest that the SSS decrease could result in low microzooplankton graz-ing rate on pico-phytoplankton such as that observed in the winter cruise.
4.4 Decoupling between phytoplankton growth and microzooplankton grazing influenced by the winter monsoon
The different correlationship between µ and m suggested that coupling between phytoplankton and microzooplank-ton also varied between the two seasons. Close coupling be-tween phytoplankton growth and microzooplankton grazing indicated by the positive correlation betweenµandmwere broadly reported in previous studies (discussion in Zhou et al., 2011). Our results also showed that the microzooplankton grazing was closely coupled with the phytoplankton growth in the summer cruise, but was not in the winter cruise. Pre-vious studies suggested that the lower nutrient concentra-tion and phytoplankton biomass may facilitate the higher coupling between phytoplankton growth and microzooplank-ton grazing in summer than in winter (Cáceres et al., 2013; Schmoker et al., 2013). We consider that the influence of the northeast monsoon could break the coupling between phy-toplankton growth and microzooplankton grazing in winter. Firstly, the arrival of strong northeast monsoon supplies nu-trients from deep water to the surface by enhancing ver-tical mixing. This episodic input of nutrients could break the coupling between phytoplankton and microzooplankton by stimulating µ and overwhelming the corresponding m and/or changing the phytoplankton community composition (Irigoien et al., 2005). Secondly, large rainfall and the re-sulted SSS decrease may decouple the phytoplankton (espe-cially the pico-phytoplankton) growth and microzooplank-ton grazing through indirectly influencing the phytoplank-ton growth and microzooplankphytoplank-ton grazing as discussed in Sect. 4.3.
Why the coupling between phytoplankton growth and mi-crozooplankton grazing was still significant for the larger size fraction but not for the pico-phytoplankton in winter is still open to discussion. On the basis of the size-fractionated data from two sites (YS and KJ35) in summer, it is found that both the growth and grazing rates for the larger size frac-tion were comparable between the two seasons, while the growth rates of pico-phytoplankton were apparently lower in winter than in summer. We conjecture that the significant
environmental change (such as salinity decrease) in winter may do harm to the growth of pico-phytoplankton dominated
byProchlorococcus in the SSCS (Wang et al., 2016), and
as a result, the inhibited pico-phytoplankton growth could contribute to the decoupling between the pico-phytoplankton growth and microzooplankton grazing. To confirm this, fur-ther studies on the effects of environmental variables on pico-phytoplankton growth are apparently necessary.
4.5 Implications of the low microzooplankton grazing impact on phytoplankton
As discussed in Sect. 4.1.3, our data of theµandmwere sim-ilar to most of the previous results observed in low-latitude tropical waters, but them/µin the SSCS was relatively lower (<50 % on average) than those reported in the previous stud-ies except that a similar value (49 %) in the Arabian Sea during the northeast monsoon season has been reported by Caron and Denett (1999). Ourm/µ is also lower than the mean values in most of the global sea regions (Schmoker et al., 2013). The lowm/µ, i.e. the high growth differential over grazing indicates low remineralization of organic matter mediated by microzooplankton and mismatch between the primary production and microzooplankton grazing. As a re-sult, potentially high vertical biogenic particle fluxes via the formation of phytoplankton aggregates and consumption of those aggregates by mesozooplankton could occur (Legendre and Rassoulzadegan, 1996; Schmoker et al., 2013). Higher vertical biogenic particle fluxes in the prevailing periods of the monsoons than between the monsoons in the SSCS was indeed observed (Wan et al., 2010). Our results suggest that the high growth differential over microzooplankton grazing may account for part of the high vertical biogenic particle fluxes in the SSCS.
4.6 Size-selective grazing contributes to the
pico-phytoplankton dominance in the oligotrophic waters of the SSCS
(>5 µm) than the smaller one (<5 µm) has also been re-cently reported in the oligotrophic subtropical Northeast At-lantic (Cáceres et al., 2013).
The higher RPI (Fig. 4) and higher m(Tables 1 and 2) on the larger-sized phytoplankton than pico-phytoplankton suggests that microzooplankton selectively grazed on the larger-sized phytoplankton in the SSCS both in the sum-mer and winter. The size-selective grazing balanced part of the relative higher growth rate of the larger-sized phyto-plankton (>3 µm), and led to the nearly equal grazing im-pact (m/µ) on both the larger-sized phytoplankton and pico-phytoplankton in the winter (Table 3). As a result, microzoo-plankton grazing maintained the pico-phytomicrozoo-plankton domi-nance in the study waters during the winter. Therefore, on the basis of the results observed in the present study and those reported by Zhou et al. (2015a) and Cáceres et al. (2013), we propose that microzooplankton grazing contributes to the pico-phytoplankton dominance in oligotrophic subtropical and tropical waters such as that of the SCS.
5 Conclusions
Significant seasonal variations in µandmas well as envi-ronmental variables under the influence of the East Asian monsoon were observed in the SSCS. Nutrient supply to the surface influenced by vertical mixing and SSS decrease re-lated to large rainfall were considered as the main factors ac-counting for the significant lowµandm, and the decoupling between theµandmin the SSCS in the winter.
Them/µdid not significantly vary between the two sea-sons. The lowm/µ(<50 % on average), i.e. the high growth differential over microzooplankton grazing indicates low remineralization of organic matter mediated by microzoo-plankton and mismatch between the µandm, and may ac-count for part of the high vertical biogenic particle fluxes in the prevailing periods of the monsoons in the SSCS.
Significant size-selective grazing on the larger-sized (>3 µm) phytoplankton was observed in the SSCS both in the summer and winter, which indicates that microzooplank-ton grazing contributes to the pico-phytoplankmicrozooplank-ton dominance in the oligotrophic tropical waters of the SCS.
Author contributions. L. Zhou designed the experiments and car-ried them out. Y. Tan and L. Huang supervised the projects. Z. Hu provided the monthly rainfall data and the Fig. 6. Z. Ke provided part of the nutrient data. L. Zhou prepared the manuscript with con-tributions from all authors.
Acknowledgements. We thank the captain and crew of R/V
Shiyan 3 for their assistance, Shengfu Wang and Shuai Xing for providing part of the nutrient data, and three anonymous reviewers for their helpful comments. This worked was supported by the National Natural Science Foundation of China (Grant
No. 41130855; 41276162), the Strategic Priority Research Program of the Chinese Academy of Sciences (Grant No. XDA05030403; XDA11020203), the Natural Science Foundation of Guangdong Province, China (Grant No. 2015A030310169), the Science and Technology Planning Project of Guangdong Province, China (Grant No. 2014B030301064).
Edited by: K. Suzuki
References
An-Yi, T., Chin, W.-M., and Chiang, K.-P.: Diel patterns of graz-ing by pigmented nanoflagellates onSynechococcusspp. in the coastal ecosystem of subtropical western Pacific, Hydrobiologia, 636, 249–256, 2009.
Ara, K. and Hiromi, J.: Seasonal variability in plankton food web structure and trophodynamics in the neritic area of Sagami Bay, Japan, J. Oceanogr., 65, 757–779, 2009.
Banse, K.: Do we live in a largely top-down regulated world?, J. Biosci., 32, 791–796, 2007.
Banse, K.: Reflections about chance in my career, and on the top-down regulated world, Annu. Rev. Mar. Sci., 5, 1–19, 2013. Burkill, P. H., Mantoura, R. F. C., Llewellyn, C. A., and Owens, N.
J. P.: Microzooplankton grazing and selectivity of phytoplankton in coastal waters, Mar. Biol., 93, 581–590, 1987.
Cáceres, C., Taboada, F. G., Höfer, J., and Anadón, R.: Phy-toplankton growth and microzooplankton grazing in the subtropical Northeast Atlantic, PLoS ONE, 8, e69159, doi:10.1371/journal.pone.0069159, 2013.
Calbet, A. and Landry, M. R.: Phytoplankton growth, microzoo-plantkon grazing, and carbon cycling in marine systems, Limnol. Oceanogr., 49, 51–57, 2004.
Calbet, A., Trepat, I., Almeda, R., Salo, V., Saiz, E., Movilla, J. I., Alcaraz, M., Yebra, L., and Simó, R.: Impact of micro-and nanograzers on phytoplankton assessed by standard and size-fractionated dilution grazing experiments, Aquat. Microb. Ecol., 50, 145–156, 2008.
Caron, D. A. and Dennett, M. R.: Phytoplankton growth and mortal-ity during the 1995 Northeast Monsoon and Spring Intermonsoon in the Arabian Sea, Deep-Sea Res. Pt. II, 46, 1665–1690, 1999. Chen, B., Liu, H., Landry, M. R., Chen, M., Sun, J., Shek, L., Chen,
X., and Harrison, P. J.: Estuarine nutrient loading affects phyto-plankton growth and microzoophyto-plankton grazing at two contrast-ing sites in Hong Kong coastal waters, Mar. Ecol.-Prog. Ser., 379, 77–90, 2009a.
Chen, B., Liu, H., Landry, M. R., Dai, M., Huang, B., and Sun, J.: Close coupling between phytoplankton growth and micro-zooplankton grazing in the western South China Sea, Limnol. Oceanogr., 54, 1084–1097, 2009b.
Chen, B., Zheng, L., Huang, B., Song, S., and Liu, H.: Seasonal and spatial comparisons of phytoplankton growth and mortality rates due to microzooplankton grazing in the northern South China Sea, Biogeosciences, 10, 2775–2785, doi:10.5194/bg-10-2775-2013, 2013.
<45 µm) are major consumers of the nanoflagellate community, Zool. Stud., 51, 1308–1318, 2012.
Chen, Q. and Mutidisciplinary Expedition to Nansha Islands, C. A. o. S.: Research Reports on the Nansha Islands and its Adjacent Waters, Beijing, China, 820 pp., 1989.
Chen, Q. and Mutidisciplinary Expedition to Nansha Islands, C. A. o. S. (Eds.): Proceedings of Studies on Marine Organisms in Nansha Islands and Adjacent Waters I, Ocean Press, Beijing, China, 1991.
Chen, Q. and Mutidisciplinary Expedition to Nansha Islands, C. A. o. S. (Eds.): Studies on Marine Fauna and Flora and Biogeog-raphy of the Nansha Islands and Neighboring Waters I, Ocean Press, Beijing, China, 1994.
Chen, Q. and Mutidisciplinary Expedition to Nansha Islands, C. A. o. S. (Eds.): Studies on Marine Fauna and Flora and Biogeog-raphy of the Nansha Islands and Neighboring Waters II, Ocean Press, Beijing, China, 1996.
Chen, Q. and Mutidisciplinary Expedition to Nansha Islands, C. A. o. S. (Eds.): Studies on Marine Fauna and Flora and Biogeog-raphy of the Nansha Islands and Neighboring Waters III, Ocean Press, Beijing, China, 1998.
Christaki, U., Vázquez-Domínguez, E., Courties, C., and Lebaron, P.: Grazing impact of different heterotrophic nanoflagellates on eukaryotic (Ostreococcus tauri ) and prokaryotic picoautotrophs (Prochlorococcus and Synechococcus), Environ. Microbiol., 7, 1200–1210, 2005.
Dolan„ J. R. and McKeon, K.: The reliability of grazing rate esti-mates from dilution experiments: Have we over-estimated rates of organic carbon consumption by microzooplankton?, Ocean Sci., 1, 1–7, doi:10.5194/os-1-1-2005, 2005.
Elser, J. J. and Frees, D. L.: Microconsumer Grazing and Sources of Limiting Nutrients for Phytoplankton Growth – Application and Complications of a Nutrient-Deletion/Dilution-Gradient Tech-nique, Limnol. Oceanogr., 40, 1–16, 1995.
Fang, W. D., Guo, Z. X., and Huang, Y. T.: Observational study of the circulation in the southern South China Sea, Chinese Sci. Bull., 43, 898–905, 1998.
Fang, W. D., Fang, G., Shi, P., Huang, Q., and Xie, Q.: Seasonal structures of upper layer circulation in the southern South China Sea from in situ observations, J. Geophys. Res., 107, 3202, doi:10.1029/2002JC001343, 2002.
Frias-Lopez, J., Thompson, A., Waldbauer, J., and Chisholm, S. W.: Use of stable isotope-labelled cells to identify active grazers of picocyanobacteria in ocean surface waters, Environ. Microbiol., 11, 512–525, 2009.
Froneman, P. W. and Perissinotto, R.: Structure and grazing of the microzooplankton communities of the Subtropical Covergence and a warm-core edyy in the Altantic sector of the Southern Ocean, Mar. Ecol.-Prog. Ser., 135, 237–245, 1996.
Gallegos, C. L.: Microzooplankton grazing on phytoplankton in the Rhode River, Maryland: nonlinear feeding kinetics, Mar. Ecol.-Prog. Ser., 57, 23–33, 1989.
Grindley, J. R.: Effect of low-salinity water on the vertical migration of estuarine plankton, Nature, 203, 781–782, 1964.
Guo, C., Liu, H., Zheng, L., Song, S., Chen, B., and Huang, B.: Seasonal and spatial patterns of picophytoplankton growth, graz-ing and distribution in the East China Sea, Biogeosciences, 11, 1847–1862, doi:10.5194/bg-11-1847-2014, 2014.
Gutiérrez-Rodríguez, A., Latasa, M., Mourre, B., and Laws, E. A.: Coupling between phytoplankton growth and microzooplankton grazing in dilution experiments: potential artefacts, Mar. Ecol.-Prog. Ser., 383, 1–9, 2009.
Hirose, M., Katano, T., and Nakano, S.-I.: Growth and grazing mor-tality rates of Prochlorococcus, Synechococcus and eukaryotic picophytoplankton in a bay of the Uwa Sea, Japan, J. Plankton Res., 30, 241–250, 2008.
Huang, B., Xiang, W., Zeng, X., Chiang, K.-P., Tian, H., Hu, J., Lan, W., and Hong, H.: Phytoplankton growth and microzooplankton grazing in a subtropical coastal upwelling system in the Taiwan Strait, Cont. Shelf Res., 31, S48–S56, 2011.
Huang, L. and Multidisciplinary Expedition to Nansha Islands, C. A. o. S. (Eds.): A Study on Ecological Processes of Nansha Is-lands Sea Area I, Science Press, Beijing, China, 1997.
Irigoien, X., Flynn, K. J., and Harris, R. P.: Phytoplankton blooms: a “loophole” in microzooplankton grazing impact?, J. Plank. Res., 27, 313–321, 2005.
Kim, S., Park, M. G., Moon, C., Shin, K., and Chang, M.: Sea-sonal variations in phytoplankton grwoth and microzooplankton grazing in a temperate coastal embayment, Korea, Estuar. Coast. Shelf Sci., 71, 159–169, 2007.
Klauschies, T., Bauer, B., Aberle-Malzahn, N., Sommer, U., and Gaedke, U.: Climate change effects on phytoplankton depend on cell size and food web structure, Mar. Biol., 159, 2455–2478, 2012.
Kodama, T., Furuya, K., Hashihama, F., Takeda, S., and Kanda, J.: Occurrence of rain-origin nitrate patches at the nutrient-depleted surface in the East China Sea and the Philippine Sea during sum-mer, J. Geophys. Res., 116, C08003, doi:10.1029/2010jc006814, 2011.
Kuipers, B. R. and Witte, H. J.: Grazing impact of microzooplank-ton on different size classes of algae in the North Sea in early spring and mid-summer, Mar. Ecol.-Prog. Ser., 180, 93–104, 1999.
Landry, M. R. and Calbet, A.: Microzooplankton production in the oceans, ICES J. Mar. Sci., 61, 501–507, 2004.
Landry, M. R. and Hassett, R. P.: Estimating the grazing impact of marine micro-zooplankton, Mar. Biol., 67, 283–288, 1982. Landry, M. R., Constantinou, J., and Kirshtein, J.:
Microzooplank-ton grazing in the central equatorial Pacific during February and August, 1992, Deep-Sea Res. Pt. II, 42, 657–671, 1995. Landry, M. R., Brown, S. L., Campbell, L., Constantinou, J., and
Liu, H.: Spatial patterns in phytoplankton growth and microzoo-plankton grazing in the Arabian Sea during monsoon forcing, Deep-Sea Res. Pt. II, 45, 2353–2368, 1998.
Landry, M. R., Selph, K. E., Taylor, A. G., Décima, M., Balch, W. M., and Bidigare, R. R.: Phytoplankton growth, grazing and pro-duction balances in the HNLC equatorial Pacific, Deep-Sea Res. Pt. II, 58, 524–535, 2011.
Lawrence, C. and Menden-Deuer, S.: Drivers of protistan grazing pressure: seasonal signals of plankton community composition and environmental conditions, Mar. Ecol.-Prog. Ser., 459, 39–52, 2012.
Legendre, L. and Rassoulzadegan, F.: Food-web mediated export of biogenic carbon in oceans: hydrodynamic control, Mar. Ecol.-Prog. Ser., 145, 179–193, 1996.
semi-enclosed bays with different chlorophyll concentrations, J. Exp. Mar. Biol. Ecol., 390, 149–159, 2010.
Liu, K. K., Chao, S. Y., Shaw, P. T., Gong, G. C., Chen, C. C., and Tang, T. Y.: Monsoon-forced chlorophyll distribution and primary production in the South China Sea: observations and a numerical study, Deep-Sea Res. Pt. I, 49, 1387–1412, 2002. Loebl, M. and Beusekon, J. E. E. V.: Seasonality of
microzooplank-ton grazing in the northern Wadden Sea, J. Sea Res., 59, 203– 216, 2008.
Longhurst, A. R.: Chapter 11 – The Pacific Ocean, in: Ecological Geography of the Sea (Second Edition), edited by: Longhurst, A. R., Academic Press, Burlington, 2007.
Moigis, A. G.: The clearance rate of microzooplankton as the key el-ement for describing estimated non-linear dilution plots demon-strated by a model, Mar. Biol., 149, 743–762, 2006.
Ning, X., Chai, F., Xue, H., Cai, Y., Liu, C., and Shi, J.: Physical-biological oceanographic coupling influencing phytoplankton and primary production in the South China Sea, J. Geophys. Res., 109, C10005, doi:10.1029/2004jc002365, 2004.
Obayashi, Y. and Tanoue, E.: Growth and mortality rates of phy-toplankton in the northwestern North Pacific estimated by the dilution method and HPLC pigment analysis, J. Exp. Mar. Biol. Ecol., 280, 33–52, 2002.
Parsons, T. R., Maita, Y., and Lalli, C. M.: A Manual of Chemical and Biological Methods for Seawater Analysis, Pergamon Press, Oxford, 1984.
Quevedo, M. and Anadón, R.: Protist control of phytoplankton growth in the subtropical north-east Atlantic, Mar. Ecol.-Prog. Ser., 221, 29–38, 2001.
Safi, K. A. and Hall, J. A.: Mixotrophic and heterotrophic nanoflag-ellate grazing in the convergence zone east of New Zealand, Aquat. Microb. Ecol., 20, 83–93, 1999.
Safi, K. A., Brian Griffiths, F., and Hall, J. A.: Microzooplankton composition, biomass and grazing rates along the WOCE SR3 line between Tasmania and Antarctica, Deep-Sea Res. Pt. I, 54, 1025–1041, 2007.
Schmoker, C., Hernández-León, S., and Calbet, A.: Microzooplank-ton grazing in the oceans: impacts, data variability, knowledge gaps and future directions, J. Plank. Res., 35, 691–706, 2013. Strom, S. L. and Fredrickson, K. A.: Intense stratification leads to
phytoplankton nutrient limitation and reduced microzooplankton grazing in the southeastern Bering Sea, Deep-Sea Res. Pt. II, 55, 1761–1774, 2008.
Strom, S. L., Macri, E. L., and Olson, M. B.: Microzooplankton grazing in the coastal Gulf of Alaska: Variations in top-down control of phytoplankton, Limnol. Oceanogr., 52, 1480–1494, 2007.
Su, J.: Overview of the South China Sea circulation and its influence on the coastal physical oceanography outside the Pearl River Es-tuary, Cont. Shelf Res., 24, 1745–1760, 2004.
Suzuki, K., Tsuda, A., Kiyosawa, H., Takeda, S., Nishioka, J., Saino, T., Takahashi, M., and Wong, C. S.: Grazing impact of microzooplankton on a diatom bloom in a mesocosm as etimated by pigment-specifc dilution technique, J. Exp. Mar. Biol. Ecol., 271, 99–120, 2002.
Teixeira, I. and Figueiras, F.: Feeding behaviour and non-linear re-sponses in dilution experiments in a coastal upwelling system, Aquat. Microb. Ecol., 55, 53–63, 2009.
Wan, S., Jian, Z., Cheng, X., Qiao, P., and Wang, R.: Seasonal varia-tions in planktonic foraminiferal flux and the chemical properties of their shells in the southern South China Sea, Sci. China Earth Sci., 53, 1176–1187, 2010.
Wang, J., Tan, Y., Huang, L., Ke, Z., and Zhou, L.: Wintertime pi-cophytoplankton distribution and its driving factors along the 113◦E meridian in the southern South China Sea, Acta Ecol. Sin., 36, doi:10.5846/stxb201408261697, 2016.
Wyrtki, K.: Physical oceanography of the southeast Asian waters, Scripps Institution of Oceanography, La Jolla, California, 1961. Yang, E., Choi, J., and Hyun, J.-H.: Distribution and structure of
heterotrophic protist communities in the northeast equatorial Pa-cific Ocean, Mar. Biol., 146, 1–15, 2004.
Yang, Y.-h. and Jiao, N.-z.: In situ daily growth rate of Prochloro-coccusat the chlorophyll maximum layer in the southern South China Sea: an estimation from cell cycle analysis, Chin. J. Oceanol. Limnol., 20, 8–14, 2002.
Zeng, L., Du, Y., Xie, S.-P., and Wang, D.: Barrier layer in the South China Sea during summer 2000, Dynam. Atmos. Oc., 47, 38–54, 2009.
Zhang, Z., Qiao, F., and Guo, J.: Subsurface eddies in the southern South China Sea detected from in-situ observation in October 2011, Deep-Sea Res. Pt. I, 87, 30–34, 2014.
Zhou, L., Tan, Y., Huang, L., Huang, J., Liu, H., and Lian, X.: Phy-toplankton growth and microzooplankton grazing in the conti-nental shelf area of northeastern South China Sea after Typhoon Fengshen, Cont. Shelf Res., 31, 1663–1671, 2011.
Zhou, L., Tan, Y., and Huang, L.: Negative phytoplankton growth rates in dilution experiments and the possible causes, J. Trop. Oceanogr., 32, 48–54, 2013.
Zhou, L., Tan, Y., Huang, L., and Li, G.: Does microzooplankton grazing contribute to the pico-phytoplankton dominance in sub-tropical and sub-tropical oligotrophic waters?, Acta Ecol. Sin., 35, 29–38, 2015a.
Zhou, L., Huang, L., Tan, Y., Lian, X., and Li, K.: Size-based anal-ysis of a zooplankton community under the influence of the Pearl River plume and coastal upwelling in the northeastern South China Sea, Mar. Biol. Res., 11, 168–179, 2015b.