* Corresponding author.
E-mail address: [email protected] (K. Mittal) © 2016 Growing Science Ltd. All rights reserved. doi: 10.5267/j.msl.2016.10.001
Management Science Letters 6 (2016) 691–700
Contents lists available at GrowingScience
Management Science Letters
homepage: www.GrowingScience.com/msl
Energy paybacks of six-sigma: A case study of manufacturing industry in India
Prabhakar Kaushika, Kapil Mittalb* and Pardeep Ranac
aAssociate Professor, UIET, Maharshi Dayanand University, Rohtak, Haryana, India, 124001
bAssistant Professor, FET, Gurukul Kangri University, Haridwar, Uttarakhand, India, 249404
cAssistant Professor, Seth Jai Prakash Mukand Lal Institute of Technology, Radaur, Haryana, India, 135133
C H R O N I C L E A B S T R A C T
Article history:
Received September 5, 2016 Received in revised format October 2, 2016
Accepted October 4, 2016 Available online October 5, 2016
Industries, nowadays, are concerned about energy consumption and ever narrowing rules of emissions by the governments. Therefore, a race to clean; green and less energy consuming manufacturing is going on throughout the world. But in authors’ perspective, the major part of energy exploitation lies in the production of a rejected product. Therefore alongside the use of energy saving processes and machinery, industry should primarily look for rejection reduction. This, apart from energy saving and profitability, will add to the moral responsibility of every person toward nature. Here in this paper, authors describe a case study in which the increased rejection rate of a part of cycle chain assembly is controlled by the application of Six Sigma. Six Sigma, from many years has proved to be an ultimate solution when it comes to the application part in manufacturing industries. It’s very generic and easily applicable methodology has drawn tremendous positive results throughout the world. A financial gain of INR 0.267 million was yielded by implying six-sigma approach. In a move toward energy saving, the money saved by the project was used for green manufacturing to promote energy conservation.
© 2016 Growing Science Ltd. All rights reserved.
Keywords: Six sigma
Energy conservation Industrial case study
1. Introduction
692
reports suggest that this affordable mode of transportation if properly absorbed in people’s lifestyle can reduce the total Co2 emission of the world by 11%.
Apart from the direct benefits of cycling, the industries involved in bicycle manufacturing can do their part in global energy saving by reducing the waste/rejection and implementing green manufacturing practices. One such case study of an Indian bicycle manufacturer is described in this paper. The industry was suffering from high rejection rate of one of the components of bicycle. It used the trusted Six-Sigma DMAIC methodology to reduce the high rejection rate up to acceptable level. The literature review of six-sigma has been accomplished by various authors in the past. Some have categorised the papers in order of usage of methodology in different sectors (Srinivasan et al., 2016), type of manufacturing industries (Biswas & Chowdhury, 2016), journal wise distribution and classification (Sreedharan & Raju, 2012), classification of tools (Uluskan, 2012) etc. Apart from these there have been some case studies showing the energy conservation in various forms using six-sigma (Falcon et al., 2012; Kaushik et al., 2008; Kaushik & Khanduja, 2008). By applying Six-Sigma, not only the industry was able to save the energy used in production of rejected items by decreasing the rejection level, but moving forward, the annual amount saved by the project has been used for the work related to implementing green manufacturing practices and reducing the energy consumption by industry. This adds to the total energy saving claimed by the industry.
2. Case Study
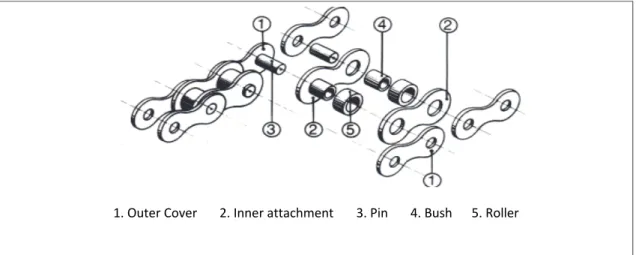
Bicycle consists of limited number of parts as compared with automobiles. Transmission of power in a bicycle is performed with the help of a Chain sprocket assembly. Hence chain can be considered as an important part of bicycle. The main parts of the chain are bush, pin and outer covering. The case study described in this paper was executed in a bicycle chain industry in India. It produces all parts to be assembled in a chain. Pin is the key element of chain and is initially in the form of a rod and is cut in lengths. The tolerance limit of pin length was 9.65±0.5 mm (Fig. 1).
The rejection rate of pin was 8.9 per cent, so there was a huge scope of increasing productivity by eliminating faults innate in manufacturing process. Six Sigma DMAIC approach was used to resolve pin rejection problem to attain the acceptable quality level. At first, project was presented to the management and after their approval official registration was performed. This activity is necessary to win consent from the higher authorities because unless they approve it can never be possible to devolve the available resources.
Fig. 1. Main parts of a Bicycle Chain Assembly
1. Outer Cover 2. Inner attachment 3. Pin 4. Bush 5. Roller
The pin manufacturing process was looked over minutely and Six Sigma DMAIC approach has been effectively applied to improve the standing Cpk from 0.47 to 1.90. These phases are explained as
follows:
a) Define
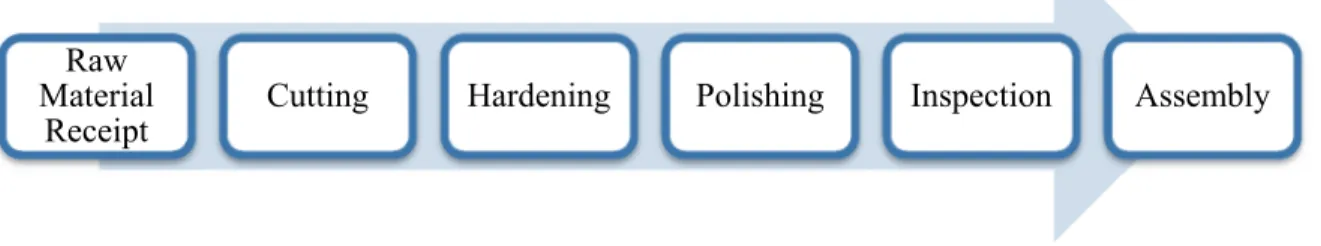
In define phase, Process Flow Diagram was drawn for pin manufacturing process as shown in Fig. 2. This diagram elaborates the different manufacturing steps during the production of pin. By drawing such diagram, it is easier to focus the attention of the project team on the process that is responsible for the faulty parts.
Fig. 2. Process Map for Pin
b) Measure
In this phase a measure of extent of problem is generally made. There are various tools available for that. First of all, a measurement system analysis (MSA) was performed which includes the Gauge R&R (gauge repeatability and reproducibility) study. The experiment can be performed with the help of at least two people. An operator from the production line and one from the inspection line were chosen. Ten pieces of known measurement (pin) were given to them and they were asked to make a measurement using micrometre which was being used to measure the dia of pin during production. Following are the readings that were recorded (Table 1).
Table 1
Measurement System Analysis
Text Seq No.
Op. Seq. No.
Operator Trial Part No.
Measurement (mm)
Text Seq No.
Op. Seq. No.
Operator Trial Part No.
Measurement (mm)
1 1 1 1 5 9.6 21 1 2 1 3 9.6
2 2 1 1 3 9.61 22 2 2 1 5 9.59
3 3 1 1 7 9.65 23 3 2 1 6 9.61
4 4 1 1 9 9.6 24 4 2 1 1 9.65
5 5 1 1 2 9.62 25 5 2 1 8 9.63
6 6 1 1 6 9.62 26 6 2 1 2 9.62
7 7 1 1 1 9.65 27 7 2 1 9 9.61
8 8 1 1 10 9.63 28 8 2 1 10 9.63
9 9 1 1 8 9.63 29 9 2 1 7 9.65
10 10 1 1 4 9.62 30 10 2 1 4 9.62
11 1 1 2 3 9.61 31 1 2 2 8 9.63
12 2 1 2 7 9.65 32 2 2 2 5 9.6
13 3 1 2 6 9.61 33 3 2 2 2 9.63
14 4 1 2 1 9.65 34 4 2 2 4 9.62
15 5 1 2 8 9.63 35 5 2 2 9 9.6
16 6 1 2 4 9.62 36 6 2 2 1 9.65
17 7 1 2 9 9.6 37 7 2 2 6 9.61
18 8 1 2 10 9.63 38 8 2 2 10 9.63
19 9 1 2 2 9.63 39 9 2 2 7 9.66
20 10 1 2 5 9.6 40 10 2 2 3 9.61
Raw Material
Receipt
694
Table 2
Result of Gauge R & R (Pin Length) for Micrometer
Study Var % Study Var
Source Std Dev (6* SD) (%SV)
Total Gage 0.0040365 0.024219 21.27
Repeatability 0.0040365 0.024219 21.27
Reproducibility 0 0 0
Part- to- Part 0.0185411 0.111247 97.71
Total Variation 0.0189754 0.113853 100
Data from Table 1 was entered in the Minitab software for performing the gauge r & r study using ANOVA. Table 2 shows the results of study in which repeatability and reproducibility was noted out to be 21.27 % and 0.00 %. This value is certainly less than 30 %, showing that Micrometer in use was accurate.
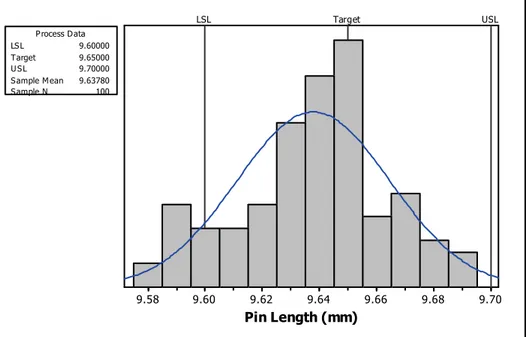
Histogram
The histogram (Fig. 3) was also drawn for checking the trend of the rejected parts (100 samples size). It clearly showed that data was not around the mean line and was away from target (9.65mm) value. Also, most of the parts being produced were undersized.
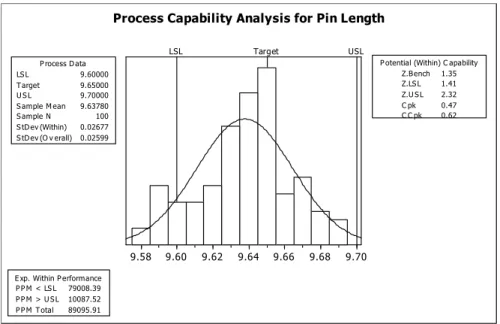
Process Capability Analysis (Cpk)
Minitab software was again used to draw a Cpk curve for pin length as shown in figure 4. Cpk is a
measure of the capability of the process to produce acceptable parts. Value less than 1 show that there is great need to rectify the process and increase the Cpk value. Also, Z-bench σ value was found to be
1.35 (Fig. 4) and present PPM was found at 89095.91, which was bizarre.
9.70 9.68
9.66 9.64
9.62 9.60
9.58
LSL Target USL
P rocess D ata
S ample N 100
LS L 9.60000
Target 9.65000
U S L 9.70000
S ample M ean 9.63780
Pin Length (mm)
9.70 9.68 9.66 9.64 9.62 9.60 9.58
LSL Target USL
P rocess D ata
S ample N 100
S tD ev (Within) 0.02677
S tD ev (O v erall) 0.02599
LS L 9.60000
T arget 9.65000
U S L 9.70000
S ample M ean 9.63780
P otential (Within) C apability
C C pk 0.62
Z.B ench 1.35
Z.LS L 1.41
Z.U S L 2.32
C pk 0.47
E xp. Within P erformance
P P M < LS L 79008.39
P P M > U S L 10087.52
P P M T otal 89095.91
Process Capability Analysis for Pin Length
Fig. 4. Cpk Analysis of Pin Rejection before Implementing DMAIC Methodology
c) Analyse
The main contribution of this phase is to find out the root cause of the rejection. In this phase, suspected causes of rejection were listed by thoughtful study of gathered data. Different statistical tools were tried for the analysis. Their explanation is as follows-
Fish-bone Diagram
Various brainstorming sessions were performed which includes different members from various sections of the industry. Thorough study of the possible causes resulted in a list of causes related to different aspects of 4 M’s. These are depicted in Fig. 5 as fishbone diagram.
Fig. 5. Fishbone Diagram
Hypotheses Testing
After detailed discussions three suspected source of variations were shortlisted for further investigation. Hypotheses were set and its testing was performed with all three suspected source of variations using 2 sample T test. The sample size was kept at 50 for all assessments. In first case, assessment was
S k ill Le ve l o f O p e ra to r
P o s it io n o f C e nt re P u nc h
P in F e e d e r R e gr in d in g
o f C ut te r
Inc o n s is te nc y in se le c t in g t he p o in t o f c h e c k in g
M a c hine M a n
M a te ria l M e tho d
P in R e je c tio n
In str u m e nt C a lib ra t io n Inc o n s is te nt v ie w
696
performed for operator skill (unskilled and skilled). In second case, assessment was performed for re-grinding of cutter (36 hrs & 24 hrs). In third case, assessment was performed for pin feeder device (existing & improved).
First Case: Assessment for Operator Skill
Sample 1: Unskilled operator Sample 2: Skilled operator
Operator skill assessment displayed that p-value for pin length is greater than the 0.05 (confidence level= 95%). Hence this cannot be a prime cause of rejection.
Second Case: Assessment for Re-Grinding of Cutter
Sample 1: Re-grinding after 24 hrs Sample 2: Re-grinding after 36 hrs
Re-grinding assessment displayed that p-value for pin length is less than the 0.05 (confidence level= 95%). Hence this cannot be a prime cause of rejection.
Two-Sample T-Test and CI: Pin Length, Operator
Two-sample T for Pin Length
Operator N Mean StDev SE Mean Operator 1 50 9.62640 0.00802 0.0011 Operator 2 50 9.6276 0.0102 0.0014
Difference = mu (Operator 1) - mu (Operator 2) Estimate for difference: -0.001200
95% CI for difference: (-0.004845, 0.002445)
T-Test of difference = 0 (vs not =): T-Value = -0.65 P-Value = 0.515 DF = 98
Both use Pooled StDev = 0.0092
Two-Sample T-Test and CI: Pin Length, Re-Grinding
Two-sample T for Pin Length
Re-Grinding N Mean StDev SE Mean After 24hr 50 9.6468 0.0113 0.0016 After 36hr 50 9.6182 0.0140 0.0020
Difference = mu Grinding After 24 hr) - mu (Re-Grinding After 36 hr)
Estimate for difference: 0.028600
95% CI for difference: (0.023554, 0.033646)
T-Test of difference = 0 (vs not =): T-Value = 11.25 P-Value = 0.000, DF = 94
Third Case: Assessment for Pin Feeder Mechanism (Existing & Improved)
Sample 1: Improved pin feeder device Sample 2: Existing pin feeder device
Pin feeder device assessment displayed that p-value for pin length is less than the 0.05 (confidence level= 95%). Hence this cannot be a prime cause of rejection
d) Improve
After finding out the root causes associated with the process now it is the time to find out the optimum working parameters. For this, a tool ‘Design of Experiments’ was chosen. This tool helps us to design the nature and combinations of different parameters during experimentation. There were two factors and two levels available so 2×2=4 combinations could be tried to optimize the value of the parameters; regrinding of cutter and pin feed mechanism. Table 3 displays the existing and proposed working parameters of root causes for pin length variation and table 4 depicts readings of pin length at available combinations of working parameters.
Table 3
Vital Causes of Pin Length Variation
Factors Low Level High Level
Re-grinding of Cutter 36 hrs 24 hrs
Pin Feed Device Existing Improved
Table 4
Readings (Pin Length) at Different Combinations
S.No. Re-grinding Pin Feeder Pin Length (mm)
1 After 36 hrs Existing 9.61
2 After 24 hrs Improved 9.65
3 After 36 hrs Improved 9.63
4 After 24 hrs Existing 9.63
Two-Sample T-Test and CI: Pin Length, Pin Feed
Two-sample T for Pin Length
Pin Feed N Mean StDev SE Mean Pin Feed New 50 9.64740 0.00876 0.0012 Pin Feed Old 50 9.6180 0.0114 0.0016
Difference = mu (Pin Feed New) - mu (Pin Feed Old) Estimate for difference: 0.029400
95% CI for difference: (0.025358, 0.033442)
T-Test of difference = 0 (vs not =): T-Value = 14.44 P-Value = 0.000 DF = 98
698
M
e
a
n
o
f
P
in L
e
ngt
h
A fter 24 hr A fter 36 hr
9.640
9.635
9.630
9.625
9.620
9.615
New Old
Re-Grinding Pin Feeder
Main Effect P lot for P in L ength
Fig. 6. Main Effect Graph for Pin Length
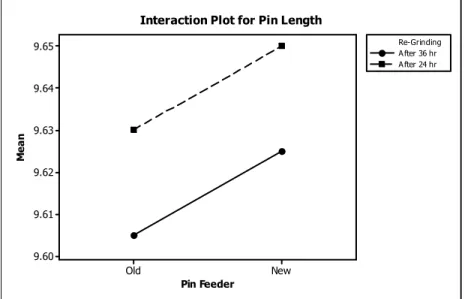
To concrete our findings, Main effect graph and interaction graph were. The Main Effect graph (figure 6) suggested that both regrinding and pin feeder mechanism were the prime factors for high rejection rate of pin. Interactions plot (Fig. 7) shows that there is no interaction present between the factors which mean the value of one factor does not affect the value of another or there is no conflict of interest between the two.
Pin Feeder
Me
a
n
New Old
9.65
9.64
9.63
9.62
9.61
9.60
Re-Grinding A fter 36 hr A fter 24 hr
Interaction Plot for Pin Length
Fig. 7. Interactions Plot for Pin Length e) Control
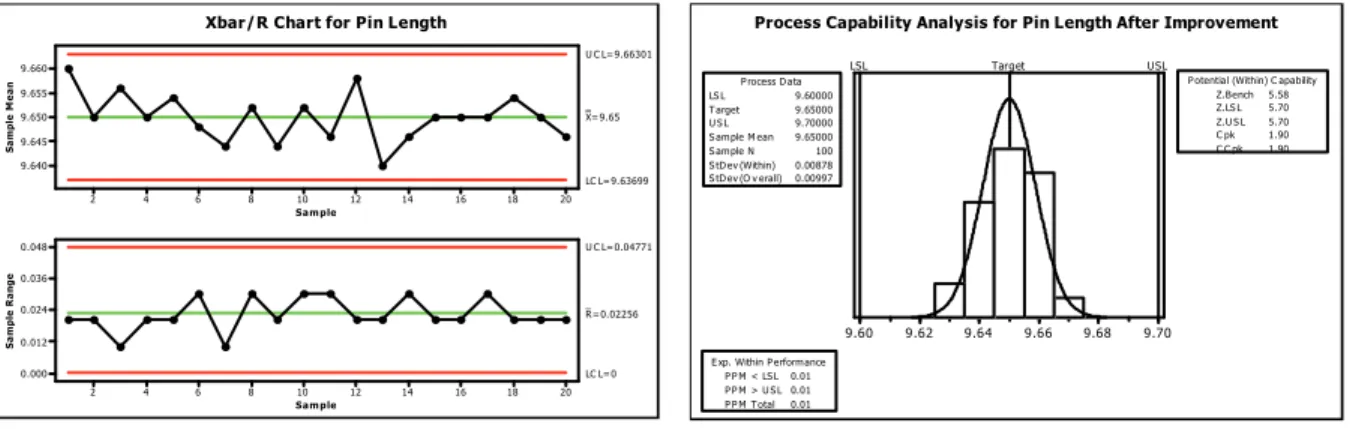
3. Results and Discussions
When different similar industries were consulted, Pin length variation rejection is found to be a prevailing problem. The causes of high rejection rate of pin were found to be pin feed mechanism and regrinding of cutter. After implementing, documenting and freezing all the proposed measure, a great amount of improvement in terms of rejection PPM was observed. The PPM which earlier was recorded to be at 89095.91 now has been improved to 0.01 PPM which is a great achievement. Also, the z bench sigma level is improved to 5.58 (figure 9), corresponding to a monetary gain of INR 2.67 lakhs (Appendix – A) and this is a substantial amount for any organization.
Sa m ple
Sa m p le M e a n 20 18 16 14 12 10 8 6 4 2 9.660 9.655 9.650 9.645 9.640 _ _ X= 9.65 U C L= 9.66301
LC L= 9.63699
Sa m ple
Sa m p le Ra n g e 20 18 16 14 12 10 8 6 4 2 0.048 0.036 0.024 0.012 0.000 _ R= 0.02256 U C L= 0.04771
LC L= 0
Xbar/R Chart for Pin Length
9.70 9.68 9.66 9.64 9.62 9.60
LSL Target USL
P rocess D ata
S am ple N 100
S tD ev (Within) 0.00878
S tD ev (O v erall) 0.00997
LS L 9.60000
T arget 9.65000
U S L 9.70000
S am ple M ean 9.65000
P otential (Within) C apability
C C pk 1.90
Z.Bench 5.58
Z.LS L 5.70
Z.U S L 5.70
C pk 1.90
E xp. Within P erform ance
P P M < LS L 0.01
P P M > U S L 0.01
P P M T otal 0.01
Process Capability Analysis for Pin Length After Improvement
Fig. 8. X bar/R Graph for Pin Length Post Measures Fig. 9. Cpk Analysis for Pin Length Data Post Measures
The money saved by the project was used for bringing more energy conservation in the industry. Following measures were taken some of which have been implemented and some are in process.
Table 5
Description and Status of Various Measures for Energy Conservation
Description of Measure Status
Exclusion of unwanted manufacturing process Completed
Plant layout reorganization Completed
Optimization of refrigerator and oven temperature. Completed
Old machinery exchange In Process
Cycle time optimization Completed
Effluent treatment plant Completed
Overtime reduction Completed
Central air conditioning In Process
Day light savings in summer months Completed
Energy conservation club to motivate and aware the employees Completed
700
4. Conclusion
In this paper a case study of an Indian bicycle chain manufacturing unit is explained with a prime motive of energy conservation. The case study started with the rejection reduction of one of the part of cycle chain. Six-Sigma DMAIC methodology was used for finding out the root causes of the rejection and finally a rejection PPM of 0.1 was achieved after the complete implementation of methodology. The monetary savings made after the project were used for energy conservation purposes in the industry. Various measures were proposed by the team many of which are implemented and some are in process. Successful implementation of the measures brought down the monthly electricity usage of industry by 11% which is a great achievement. This can be treated as a contribution of industry in global energy conservation. In author perspective, such projects should be started more frequently in industries. This not only improves the organizational culture and profitability but also bring the energy saving awareness among the employees.
References
Biswas, S., & Chowdhury, B. (2016). Industrial Applications and Practices of Six Sigma – A Literature Review. International Advanced Research Journal in Science, Engineering and Technology, 3(3), 176–179. http://doi.org/10.17148/IARJSET.2016.3337
Falcon, R. G., Alonso, D. V., Fernandez, L. M. G., & Perez-Lombard, L. (2012). Improving energy efficiency in a naphtha reforming plant using Six Sigma methodology. Fuel Processing Technology, 103, 110–116. http://doi.org/10.1016/j.fuproc.2011.07.010
Kaushik, P., Grewal, C. S., Bilga, P. S., & Khanduja, D. (2008). Utilising Six Sigma for energy conservation: A process industry case study. International Journal of Six Sigma and Competitive Advantage, 4(1), 18. http://doi.org/10.1504/IJSSCA.2008.018418
Kaushik, P., & Khanduja, D. (2008). DM make up water reduction in thermal power plants using Six Sigma DMAIC methodology. Journal of Scientific and Industrial Research, 67(1), 36–42.
Oja, P., Titze, S., Bauman, A., de Geus, B., Krenn, P., Reger-Nash, B., & Kohlberger, T. (2011). Health benefits of cycling: A systematic review. Scandinavian Journal of Medicine and Science in Sports, 21(4), 496–509. http://doi.org/10.1111/j.1600-0838.2011.01299.x
Sreedharan, V. R., & Raju, R. (2012). A systematic literature review of Lean Six Sigma in different industries. International Journal of Lean Six Sigma, 7(4).
Srinivasan, K., Muthu, S., Devadasan, S. R., & Sugumaran, C. (2016). Six Sigma through DMAIC phases : a literature review. International Journal of Productivity and Quality Management, 17(2), 236–257. http://doi.org/10.1504/IJPQM.2016.074462
Uluskan, M. (2012). A comprehensive insight into the Six Sigma DMAIC toolbox. International Journal of Lean Six Sigma, 7(4).
Appendix A
PPM before project initiation : 89095.91 PPM after project completion : 0.01
Cost of one pin : Rs. 0.05
PPM reduction achieved : 89095.90 PPM Monthly production : 5,000,000 pcs
Saving/month : 89095.90*5,000,000/106 = 445479.5 pcs
Cost saving/annum : 445479.5*0.05*12 = INR 267287.7 = 0.267 million
© 2016 by the authors; licensee Growing Science, Canada. This is an open access article distributed under the terms and conditions of the Creative Commons Attribution (CC-BY) license (http://creativecommons.org/licenses/by/4.0/).