Composition and assemblage structure of demersal fish from
São Cristóvão beach, Areia Branca, RN
Natália Carla Fernandes de Medeiros Dantas1,4, Caroline Vieira Feitosa1,3 & Maria Elisabeth de Araújo2,3
1Laboratório de Biologia e Dinâmica Populacional de Peixes Marinhos, Departamento de Ciências Animais, Universidade Federal Rural do Semiárido – UFERSA, Av. Francisco Mota, 572,Costa e Silva,
CEP 59625-900, Mossoró, RN, Brasil
2Laboratório de Nécton e Aquicultura, Departamento de Oceanografia, Universidade Federal de Pernambuco – UFPE, Av. Prof. Moraes Rego, 1235, Cidade Universitária,
CEP 50670-901, Recife, PE, Brasil
3Grupo de Ictiologia Marinha Tropical – IMAT, Departamento de Oceanografia,
Universidade Federal de Pernambuco – UFPE, Av. Prof. Moraes Rego, 1235, Cidade Universitária, CEP 50670-901, Recife, PE, Brasil
4Corresponding author: Natália Carla Fernandes de Medeiros Dantas, e-mail: [email protected]
DANTAS, N.C.F.M., FEITOSA, C.V. & ARAÚJO, M.E. Composition and assemblage structure of demersal fish from São Cristóvão beach, Areia Branca, RN. Biota Neotrop. 12(3): http://www.biotaneotropica.org.br/ v12n3/en/abstract?article+bn02512032012
Abstract: Fish assemblages are an important element of sandy beaches, as they are fundamental for these
ecosystems’ balance of energy. Descriptions of the structure of fish assemblages in the sandy beaches of
northeastern Brazil are scarce; this is especially true for the state of Rio Grande do Norte, which northern coast
is poorly studied. This study aimed to identify the fish fauna of São Cristóvão Beach and to determine their
assemblage structure. Three trawlings, considered as replicates, were undertaken monthly, in the same day, during 10 minutes each time, parallel to the coastal line, and in the direction of current, from February 2010
to January 2011. To describe the general pattern of the fish assemblage, the abundance, frequency and trophic categories of each species were estimated. On São Cristóvão Beach, 8894 individuals were captured, belonging to 58 species, 48 genera and 28 families. The most abundant and frequent species were Pomadasys corvinaeformis (Steindachner, 1868), Cathorops spixii (Agassiz, 1829), Stellifer rastrifer (Jordan, 1889), Pellona harroweri (Fowler, 1917),Stellifer stellifer (Bloch, 1790), Chirocentrodon bleekerianus (Poey, 1867), Larimus breviceps Cuvier, 1830, Menticirrhus americanus (Linnaeus, 1758) and Conodon nobilis (Linnaeus, 1758). The most
abundant trophic category was first order carnivores. The ichthyofauna of São Cristóvão Beach is diversified and
the most representative families match those observed in sandy beach ecosystems from other Brazilian regions.
The results presented here reflect the basic knowledge necessary to conduct further research in the region. Keywords: sandy beaches, bottow otter trawl, ichthyofauna.
DANTAS, N.C.F.M., FEITOSA, C.V. & ARAÚJO, M.E. Composição e estrutura da assembléia de peixes demersais da praia de São Cristóvão, Areia Branca, RN. Biota Neotrop. 12(3): http://www.biotaneotropica. org.br/v12n3/pt/abstract?article+bn02512032012
Resumo: As assembléias íctias são um elemento importante das praias arenosas, pois são fundamentais no
balanço energético desses ecossistemas. Descrições da estrutura da assembléia de peixes de praias arenosas do
nordeste brasileiro são escassas, em especial no estado do Rio Grande do Norte, cujo litoral norte é pobremente estudado. A presente pesquisa teve como objetivo inventariar a ictiofauna da praia de São Cristóvão, bem como
conhecer a estrutura desta assembléia. Foram realizados três arrastos mensais com portas, com 10 minutos de
duração cada (considerados como réplicas), paralelos à linha da costa, na direção da corrente, no período de fevereiro de 2010 a janeiro de 2011. Para descrever o padrão geral da comunidade de peixes, foram calculadas as abundâncias, frequências e os hábitos alimentares das espécies. Na praia de São Cristóvão foram capturados 8.894 indivíduos, pertencentes a 58 espécies, 48 gêneros e 28 famílias. As espécies mais abundantes e frequentes
foram Pomadasys corvinaeformis (Steindachner, 1868), Cathorops spixii (Agassiz, 1829), Stellifer rastrifer
(Jordan, 1889), Pellona harroweri (Fowler, 1917),Stellifer stellifer (Bloch, 1790), Chirocentrodon bleekerianus (Poey, 1867), Larimus breviceps Cuvier, 1830,Menticirrhus americanus (Linnaeus, 1758) e Conodon nobilis (Linnaeus, 1758). Quanto às proporções das categorias tróficas das espécies, a predominante é carnívora de primeira ordem. A ictiofauna da praia de São Cristóvão pode ser considerada diversificada e as famílias mais representativas coincidem com aquelas observadas nos ecossistemas praiais de outras regiões brasileiras. Os resultados aqui apresentados refletem o conhecimento básico necessário para a realização de pesquisas futuras na região.
assemblage structure of the fish of São Cristóvão Beach, state of Rio
Grande do Norte, Brazil.
Materials and Methods
1. Study area
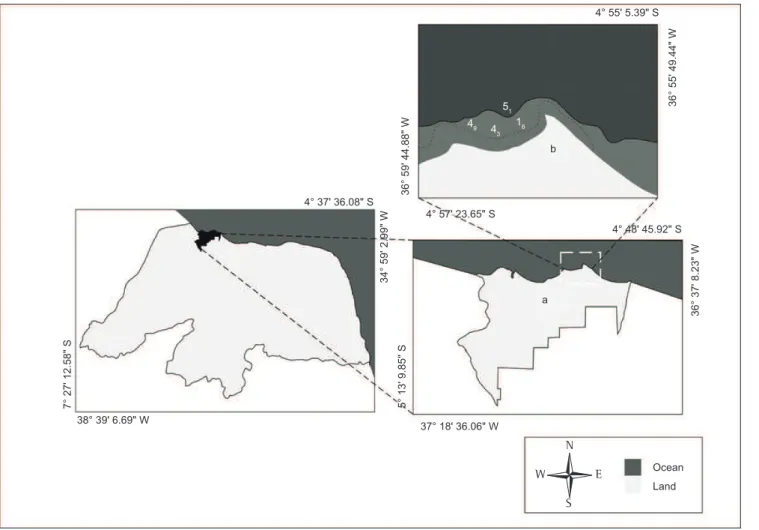
São Cristóvão Beach, which is part of the Areia Branca municipality (4° 55’ 29.83” S and 36° 57’ 2.91” W), is located on
the northern coast of the state of Rio Grande do Norte, 330 km from the state capital, Natal (Figure 1). This region’s climate is
semi-arid and hot (700 mm precipitation), with a rainy season (February
through May) with rainfall peaks in March and April, and a dry
season (June-January) (Instituto... 2008). The region’s tides are
semi-diurnal; average sealevel is 133.1 cm, the amplitude of the neap tide
is of 127.79 cm and the amplitude of the spring tide is of 284.55 cm (Instituto... 2008).
2. Sampling
Sampling was carried out from February 2010 through January
2011 at São Cristóvão Beach. Three trawlings, considered as
replicates, were undertaken monthly, in the same day, during
10 minutes each time, parallel to the coastal line, totalling 36 trawls, a 15 m long and 8.6 m wide otter trawl net (4 cm mesh) was used, pulled by a shrimp boat with a 46 Hp, six cylinder motor, at a speed of 2.5 knots. The captured fish were stored in a Styrofoam box, identified and photographed at the Marine Fish Biology and
Population Dynamics Laboratory. Specialized literature was used to
identify the species (Figueiredo 1977, Figueiredo & Menezes 1978, 1980, 2000, Menezes & Figueiredo 1980, 1985, Carvalho-Filho 1999, Marceniuk 2005). The samples are deposited at the Marine
Fish Biology and Population Dynamics Laboratory Collection under the numbers 1-50.
3. Characterizing the assemblage structure
Species were analyzed in relation to abundance and frequency and classified based on the criteria adopted by Paiva et al. (2008) and
Garcia & Vieira (2001). Species were considered abundant (A) and not very abundant (NA) when the capture percentage (CP%) was higher or lower than 100/S, respectively, where S is the number of species.
Similarly, in order to classify species according to their frequency
of occurrence (FO%), the following intervals were designated:
infrequent (IF), for values lower than 50%; frequent (F), for values within the interval 50% ≤ FO% < 85%; and very frequent (VF), for values equal to or greater than 85%. After this analysis, species were classified according to their CP% and FO% (Table 1).
Species were classified according to the trophic levels determined by Bouchon-Navaro et al. (1992), which place fish into the following
categories: planktivores (P) – food is composed mainly of plankton; omnivores (O) – species that feed on invertebrates and algae;
herbivores (H) – from algae to marine phanerogams; first order
carnivores (IC) – small benthic invertebrates; second order carnivores
(IIC) – invertebrates and fish; third order carnivores (IIIC) – fish makes up 80% of the food ingested. The species that were not evaluated by Bouchon-Navaro et al. (1992) were classified based
on their feeding habit, as available in the following website: www.
fishbase.org. (Fishbase 2011).
In order to characterize the assemblage, two diversity measurements were used: Margalef’s richness index (R1), according
to the formula R1 = (S – 1)/ln N, where “S” is the total number of species and “N” is the total number of individuals in the sample (Magurran 1988); and Shannon’s diversity index (H’), as expressed in the formula H’= – Σ (pi) (log2 pi), where “pi” is equal to the
Introduction
Fish assemblages are an important element of sandy beach ecosystems, and carry out one of the most important roles in energy
balance (Lowe-McConnell 1999). The common capture of juvenile
individuals may affect the ecosystem’s entire trophic structure,
compromising the efficiency of energy transfer, since they act as
primary and secondary consumers within the trophic chain (Veloso
& Neves 2009). Besides, this catch interferes in prey availability (Alverson et al. 1994) and hinders fishstocks’ regeneration, once
captures mainly juvenile individuals (Kaiser et al. 2001). The great presence of juvenile fish in sandy beach environments draws attention
to the role of this ecosystem in the life cycle and maintenance of
several fish species’ population stocks (Vasconcellos et al. 2007, Santana & Severi 2009) – both resident and migrant. It also reinforces the concept of connectivity between sandy beaches, adjacent
ecosystems and regions that are more distant from the continental
shelf to more protected coastal areas (Félix et al. 2006).
The beach environments are used both by resident species (as nurseries, as well as for feeding, spawning, shelter and protection against predators due to the high turbidity levels and low depths)
(Lasiak 1986, Giannini & Paiva Filho 1995) and by visiting
species, which include sandy beaches in their migration routes
(Vasconcellos et al. 2007, Veloso & Neves 2009). Consequently, great seasonal variability in the fish assemblage can be observed in these areas throughout entire year (Brown & McLachlan 1990, Veloso & Neves 2009).
Considering the size of the Brazilian coast, there are relatively
few studies that focus on the fish fauna of beach environments – most
research available focuses on describing assemblage structure and its spatial and temporal variations. For the southern and southeastern regions of the country, we can highlight the work of Giannini &
Paiva Filho (1995), Araújo et al. (1998), Godefroid et al. (2003) and Araújo et al. (2008), while the work of Teixeira & Almeida (1998), Oliveira-Silva et al. (2008) and Santana & Severi (2009) can be
highlighted for the northeastern region.
Approximately three quarters of the world’s coasts are made up of sandy beaches (Bascom 1980). Most of the artisanal fishing carried
out by local communities in the country occurs within the coastal line
(Instituto... 2007). Among the most common fishing techniques used
along the Brazilian coast, bottom otter trawling stands out as one of
the most damaging to natural resources for being multiespecific and due to its low selectivity (Franco et al. 2009, Vianna & Almeida 2005).
This result in a great capture of bycatch, which encompass
small-sized species, juvenile individuals and benthic invertebrates (Kumar & Deepthi 2006, Davies et al. 2009). Besides, great damage is caused to the substrate (Kaiser et al. 2001). The long term use of this type of fishing technique may affect the local ichthyofauna assemblage (Kaiser et al. 2001, Vianna & Almeida 2005).
The rapid expansion of human populations has been causing severe impacts throughout the world, especially due to the degradation of ecosystems and the consumption of natural resources (Defeo et al.
2009). Most of these impacts occur along the coastal line, which
is composed mainly of sandy beaches (McLachlan & Brown
2006). Thus, there is a need to know the dynamics of sandy beach ecosystems and to emphasize their importance for the fish species
quotient of the number of individuals of species “i” divided by the total number of individuals (Magurran 1988); Primer 5.0 software
was used (Primer-E 2000).
4. Data analysis
Trawlings perfomed per month were grouped for the purpose of analysis and treated as one (month). The variable’s mean values were used. As the data were not well modeled by a normal distribution
(Kolmogorov-Smirnov test) and the variances were homoscedastic
(Bartlett test), nonparametric tests were used.
Kruskall-Wallis’ nonparametric test was applied to check for significant differences between the ecological indexes throughout the
months studied. To compare the richness index between dry (June
until January) and rainy (February until May) season, Mann Whitney’s
nonparametric test was applied. BioEstat 5.0 software was used for
this purpose (Ayres et al. 2007). To test the differences in Shannon diversity index between seasons, the t- test of Hutcheson (Diversity
t-test) procedures was applied and the software PAST was used for this
(Hammer et al. 2001). A Bray-Curtis similarity matrix was calculated
using log-transformed species abundance data (X + 1). In order to express the association between species abundance and the dry and rainy seasons (factors), non-metric multidimensional scaling analysis (NMDS) was used. Analyses of similarity (ANOSIM) were used to
test the significance of groups formed with the above-mentioned data.
Additionally, an analysis of similarity percentages (SIMPER) was conducted to examine the main species contributing for differences
in fish assemblage structure between seasons. Primer 5.0 was the
software used in both cases (Primer-E 2000).
Spearman’s correlation was used to verify for possible correlations between the richness and diversity indexes and monthly
rainfall (BioEstat 5.0 software) (Ayres et al. 2007). Rainfall data for
the Areia Branca municipality (2010-2011) was obtained from the
Figure 1. Location map of the São Cristóvão beach (b), Areia Branca (a) (RN). Figura 1. Mapa de localização da praia de São Cristóvão (b), Areia Branca (a) (RN).
Table 1. Classification of fish species captured at São Cristóvão Beach (Rio Grande do Norte, Brazil) according to abundance and frequency of occurence, based on the criteria proposed by Paiva et al. (2008) and Garcia
& Vieira (2001).
Tabela 1. Classificação das espécies de peixes capturadas na praia de São Cristóvão (Rio Grande do Norte, Brasil) de acordo com a abundância e frequência de ocorrência, baseado no critério proposto por Paiva et al. (2008)
e Garcia & Vieira (2001).
NA-IF CP% < 100/S and FO% < 50%
NA-F CP% < 100/S and 50% ≤ FO% < 85%
NA-VF CP% < 100/S and FO% ≥ 85%
company Salina Morro Branco, F. Souto – Indústria, Comércio e Navegação S/A .
Results
Fifty-eight species of 48 genera and 28 families were captured – a total of 8.894 individuals sampled. The most representative families
regarding the number of species and individuals were Sciaenidae
(nine species and 3195 individuals), Ariidae (five species and 1493 individuals), Carangidae (five species and 186 individuals), Engraulidae (four species and 271 individuals), Haemulidae (four species and 1794 individuals) and Pristigasteridae (three species and
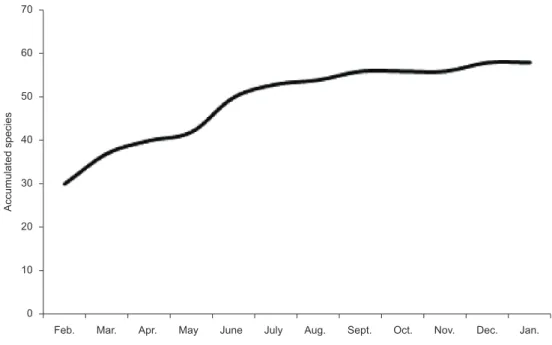
1552 individuals). The data collected show sample stability from the 5th survey on, when almost all of the species identified (50) had already been captured (Figure 2).
Of the 58 species sampled, 35 were classified as not very abundant and infrequent IF); 11 as not very abundant and frequent (NA-F); three as abundant and frequent (A-(NA-F); and six as abundant and very frequent (A-VF). No species fit into the category “abundant and infrequent” (A-IF) (Table 2). The nine species that were dominant in terms of quantity (A-VF and A-F) in the samplesfrom São Cristovão Beach contributed with 87.2% of the total fish captured (Figure 3).
The greatest abundance values for individuals were recorded
during the months of February (1.497) and May (1.262), while the lowest values occurred in October (167) and November (250). The
multidimensional scaling analysis showed that two distinct groups were formed, which suggests a separation between the two seasons
(rainy and dry) (Figure 4). The analysis of similarity (ANOSIM) used to test the significance of these groups showed a significant distinction between them (R = 0.392; p = 0.001). However, the last
months (January and May) of each season overlapped. Abundance
change of species between seasons was confirmed considering the
species contributing for the dissimilarity between samples (Table 3).
The average richness (R1) and diversity values (H’) were of 2.79 ± 0.13 (S.E) and 1.73 ± 0.12 (S.E), respectively. Figure 5
shows the variation of the ecological indexes throughout the year,
in addition to the mean precipitation data for the period studied. The
month with the greatest richness was April (3.43), while November had the lowest (2.01) – although the Kruskall-Wallis test did not show significant differences throughout the year for the indexes that were analyzed (H = 13.2557 and p = 0.2769). For the Shannon-Wiener index, variations in diversity could be observed throughout
the months, and the highest values were recorded during the rainy
season (March = 2.210 and April = 2.357). Significant differences
were recorded between April and June and April and October
(H = 23.979 and p = 0.0128, Dunn test pos-hoc, p < 0.005). June
and October were the months with the lowest diversity. Comparing
the richness (z(u) = 0.5095 and p = 0.6104) and diversity (t = 0.0447 and p = 0.9643) indexes between dry and rainy seasons, significant
differences were not detected. According to Spearman’s correlation test, there was no correlation between the monthly rainfall and
richness (p = 0.38) and diversity indexes (p = 0.46).
The most abundant trophic categories were first order carnivore (IC) (435 ± 84.08) and second order carnivore (IIC) (228 ± 38.08). The other categories third order carnivore (26 ± 16.36), herbivore (0.08 ± 0.04) omnivore (22.08 ± 5.75) and planktivore (0.16 ± 0.08)
were unrepresentative.
Discussion
The data indicates that the size of the sample was adequate to survey the species that occurred at São Cristóvão Beach, as 86%
of the total species known for the region was sampled during the period studied. Ninety-six species have been recorded for the region
(J. Garcia Júnior 2006). The great disparity of species surveyed in this study when compared to that of J. Garcia Júnior (2006) can be explained by the several types of fishing apparatus used (gill nets,
purse seine nets, hand lines, dip nets, cast nets and trammel net) in the different environments sampled (estuary and sandy beach) by the author mentioned above.
The results presented here are similar to those of Santana & Severi
(2009), where species Polydactylus virginicus (Linnaeus, 1758),
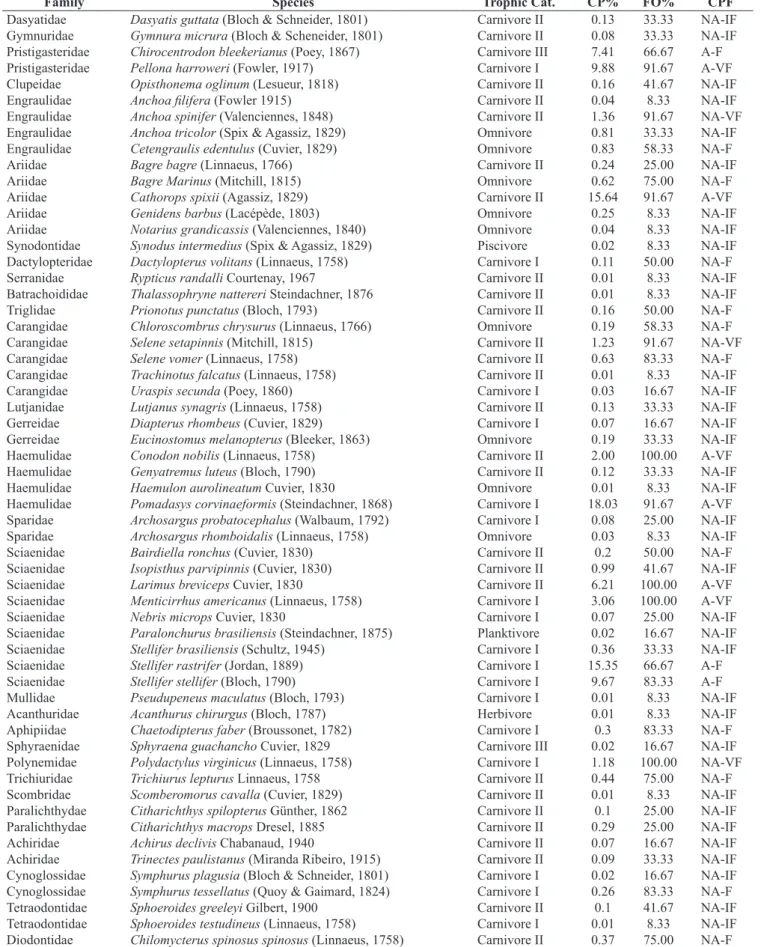
Table 2. List of species and families recorded at São Cristovão Beach (Rio Grande do Norte, Brazil) with their respective trophic categories, capture percentage (CP%), frequency of occurrence (FO%) and the classification that assorts the capture percentage and the frequency of occurrence (CPF).
Tabela 2. Lista das espécies e famílias registradas na praia de São Cristóvão (Rio Grande do Norte, Brasil) com suas respectivas categorias tróficas, percentual de captura (CP%), frequência de ocorrência (FO%) e classificação que associa o percentual de captura e frequência de ocorrência (CPF).
Family Species Trophic Cat. CP% FO% CPF
Dasyatidae Dasyatis guttata (Bloch & Schneider, 1801) Carnivore II 0.13 33.33 NA-IF
Gymnuridae Gymnura micrura (Bloch & Scheneider, 1801) Carnivore II 0.08 33.33 NA-IF
Pristigasteridae Chirocentrodon bleekerianus (Poey, 1867) Carnivore III 7.41 66.67 A-F
Pristigasteridae Pellona harroweri (Fowler, 1917) Carnivore I 9.88 91.67 A-VF
Clupeidae Opisthonema oglinum (Lesueur, 1818) Carnivore II 0.16 41.67 NA-IF
Engraulidae Anchoa filifera (Fowler 1915) Carnivore II 0.04 8.33 NA-IF
Engraulidae Anchoa spinifer (Valenciennes, 1848) Carnivore II 1.36 91.67 NA-VF
Engraulidae Anchoa tricolor (Spix & Agassiz, 1829) Omnivore 0.81 33.33 NA-IF
Engraulidae Cetengraulis edentulus (Cuvier, 1829) Omnivore 0.83 58.33 NA-F
Ariidae Bagre bagre (Linnaeus, 1766) Carnivore II 0.24 25.00 NA-IF
Ariidae Bagre Marinus (Mitchill, 1815) Omnivore 0.62 75.00 NA-F
Ariidae Cathorops spixii (Agassiz, 1829) Carnivore II 15.64 91.67 A-VF
Ariidae Genidens barbus (Lacépède, 1803) Omnivore 0.25 8.33 NA-IF
Ariidae Notarius grandicassis (Valenciennes, 1840) Omnivore 0.04 8.33 NA-IF
Synodontidae Synodus intermedius (Spix & Agassiz, 1829) Piscivore 0.02 8.33 NA-IF
Dactylopteridae Dactylopterus volitans (Linnaeus, 1758) Carnivore I 0.11 50.00 NA-F
Serranidae Rypticus randalli Courtenay, 1967 Carnivore II 0.01 8.33 NA-IF
Batrachoididae Thalassophryne nattereri Steindachner, 1876 Carnivore II 0.01 8.33 NA-IF
Triglidae Prionotus punctatus (Bloch, 1793) Carnivore II 0.16 50.00 NA-F
Carangidae Chloroscombrus chrysurus (Linnaeus, 1766) Omnivore 0.19 58.33 NA-F
Carangidae Selene setapinnis (Mitchill, 1815) Carnivore II 1.23 91.67 NA-VF
Carangidae Selene vomer (Linnaeus, 1758) Carnivore II 0.63 83.33 NA-F
Carangidae Trachinotus falcatus (Linnaeus, 1758) Carnivore II 0.01 8.33 NA-IF
Carangidae Uraspis secunda (Poey, 1860) Carnivore I 0.03 16.67 NA-IF
Lutjanidae Lutjanus synagris (Linnaeus, 1758) Carnivore II 0.13 33.33 NA-IF
Gerreidae Diapterus rhombeus (Cuvier, 1829) Carnivore I 0.07 16.67 NA-IF
Gerreidae Eucinostomus melanopterus (Bleeker, 1863) Omnivore 0.19 33.33 NA-IF
Haemulidae Conodon nobilis (Linnaeus, 1758) Carnivore II 2.00 100.00 A-VF
Haemulidae Genyatremus luteus (Bloch, 1790) Carnivore II 0.12 33.33 NA-IF
Haemulidae Haemulon aurolineatum Cuvier, 1830 Omnivore 0.01 8.33 NA-IF
Haemulidae Pomadasys corvinaeformis (Steindachner, 1868) Carnivore I 18.03 91.67 A-VF
Sparidae Archosargus probatocephalus (Walbaum, 1792) Carnivore I 0.08 25.00 NA-IF
Sparidae Archosargus rhomboidalis (Linnaeus, 1758) Omnivore 0.03 8.33 NA-IF
Sciaenidae Bairdiella ronchus (Cuvier, 1830) Carnivore II 0.2 50.00 NA-F
Sciaenidae Isopisthus parvipinnis (Cuvier, 1830) Carnivore II 0.99 41.67 NA-IF
Sciaenidae Larimus breviceps Cuvier, 1830 Carnivore II 6.21 100.00 A-VF
Sciaenidae Menticirrhus americanus (Linnaeus, 1758) Carnivore I 3.06 100.00 A-VF
Sciaenidae Nebris microps Cuvier, 1830 Carnivore I 0.07 25.00 NA-IF
Sciaenidae Paralonchurus brasiliensis (Steindachner, 1875) Planktivore 0.02 16.67 NA-IF
Sciaenidae Stellifer brasiliensis (Schultz, 1945) Carnivore I 0.36 33.33 NA-IF
Sciaenidae Stellifer rastrifer (Jordan, 1889) Carnivore I 15.35 66.67 A-F
Sciaenidae Stellifer stellifer (Bloch, 1790) Carnivore I 9.67 83.33 A-F
Mullidae Pseudupeneus maculatus (Bloch, 1793) Carnivore I 0.01 8.33 NA-IF
Acanthuridae Acanthurus chirurgus (Bloch, 1787) Herbivore 0.01 8.33 NA-IF
Aphipiidae Chaetodipterus faber (Broussonet, 1782) Carnivore I 0.3 83.33 NA-F
Sphyraenidae Sphyraena guachancho Cuvier, 1829 Carnivore III 0.02 16.67 NA-IF
Polynemidae Polydactylus virginicus (Linnaeus, 1758) Carnivore I 1.18 100.00 NA-VF
Trichiuridae Trichiurus lepturus Linnaeus, 1758 Carnivore II 0.44 75.00 NA-F
Scombridae Scomberomorus cavalla (Cuvier, 1829) Carnivore II 0.01 8.33 NA-IF
Paralichthydae Citharichthys spilopterus Günther, 1862 Carnivore II 0.1 25.00 NA-IF
Paralichthydae Citharichthys macrops Dresel, 1885 Carnivore II 0.29 25.00 NA-IF
Achiridae Achirus declivis Chabanaud, 1940 Carnivore II 0.07 16.67 NA-IF
Achiridae Trinectes paulistanus (Miranda Ribeiro, 1915) Carnivore II 0.09 33.33 NA-IF
Cynoglossidae Symphurus plagusia (Bloch & Schneider, 1801) Carnivore I 0.02 16.67 NA-IF
Cynoglossidae Symphurus tessellatus (Quoy & Gaimard, 1824) Carnivore I 0.26 83.33 NA-F
Tetraodontidae Sphoeroides greeleyi Gilbert, 1900 Carnivore II 0.1 41.67 NA-IF
Tetraodontidae Sphoeroides testudineus (Linnaeus, 1758) Carnivore I 0.01 8.33 NA-IF
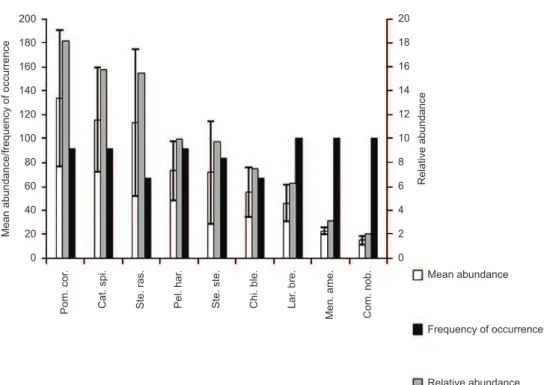
Figure 3. Frequency of occurrence, relative and mean abundance of the most representative fish species from São Cristovão beach, with their respective standard
error. Legend: EP = standard error, Pom cor = Pomadasys corvinaeformis (Steindachner, 1868), Cat spi = Cathorops spixii (Agassiz, 1829), Ste ras = Stellifer rastrifer (Jordan, 1889), Pel har = Pellona harroweri (Fowler, 1917), Ste ste = Stellifer stellifer (Bloch, 1790), Chi ble = Chirocentrodon bleekerianus (Poey,
1867), Lar bre = Larimus breviceps Cuvier, 1830, Men ame = Menticirrhus americanus (Linnaeus, 1758), Con nob = Conodon nobilis (Linnaeus, 1758).
Figura 3. Frequência de ocorrência, abundâncias numérica relativa e média das espécies de peixe mais representativas da praia de São Cristovão, com seus respectivos erro padrão. Legenda: EP = Erro Padrão, Pom cor = Pomadasys corvinaeformis (Steindachner, 1868), Cat spi = Cathorops spixii (Agassiz, 1829), Ste ras = Stellifer rastrifer (Jordan, 1889), Pel har = Pellona harroweri (Fowler, 1917), Ste ste = Stellifer stellifer (Bloch, 1790), Chi ble = Chirocentrodon bleekerianus
(Poey, 1867), Lar bre = Larimus breviceps Cuvier, 1830, Men ame = Menticirrhus americanus (Linnaeus, 1758), Con nob = Conodon nobilis (Linnaeus, 1758).
Figure 4. Non-metric multidimensional scaling (NMDS) of monthly samplings carried out on São Cristovão beach-RN. The symbols represent the two groups
formed in relation to the abundance and the dry and rainy season.
Larimus breviceps Cuvier, 1830, Chirocentrodon bleekerianus (Poey,
1867), Pomadasys corvinaeformis (Steindachner, 1868), Stellifer stellifer (Bloch, 1790), Stellifer rastrifer (Jordan, 1889), Conodon nobilis (Linnaeus, 1758) and Pellona harroweri (Fowler, 1917)are among the most abundant at Jaguaribe Beach (state of Pernambuco).
According to Oliveira-Silva et al. (2008), P. virginicus (Linnaeus,
1758), L. breviceps Cuvier, 1830 and S. rastrifer (Jordan, 1889)
are among the most representative species at Cabuçu Beach (state of Bahia), while C. nobilis (Linnaeus, 1758)and P. corvinaeformis (Steindachner, 1868) were very expressive at Berlinque Beach (Bahia). At Pajuçara Beach (Maceió, state of Alagoas), Teixeira &
Almeida (1998) reported that P. virginicus (Linnaeus, 1758) and L. breviceps Cuvier, 1830 were the most representative species among
those captured. It is possible that these eight species represent the sandy beaches of northeastern Brazil’s oriental region and form an ichthyological unit that is typical of this ecosystem.
The information provided above agrees with the data of
Guedes et al. (2005) regarding the fish fauna’s uniformity along the
Brazilian coast in terms of families. The number of species per family is only different from study to study, mainly due to distinctions in sampling and variations between years. Nevertheless, the dominant families are usually the same, and are especially represented by Sciaenidae.
The great abundance and frequency of P. corvinaeformis (Steindachner, 1868), C. spixii (Agassiz, 1829), S. rastrifer (Jordan,
1889), P. harroweri (Fowler, 1917), S. stellifer (Bloch, 1790), C. bleekerianus (Poey, 1867), L. breviceps Cuvier, 1830, Menticirrhus americanus (Linnaeus, 1758) and C. nobilis (Linnaeus, 1758) in this
study suggests that these species’ life cycle is connected to sandy beach ecosystems, as they were dominant during the entire sampled period. The same pattern was observed for the species Anchoa tricolor (Spix & Agassiz, 1829), Anchoviella lepidentostole (Fowler,
1911), Bairdiella ronchus (Cuvier, 1830), L. breviceps Cuvier, 1830, Lycengraulis grossidens (Agassiz, 1829) and P. virginicus (Linnaeus,
1758) at Jaguaribe Beach (F. M. S. Santana 2009).
The fact that no species fit into the “abundant and infrequent” category (A-IF) shows that visiting, schooling fish species were not
sampled, such as Albula vulpes (Linnaeus, 1758), Caranx hippos (Linnaeus, 1766), Caranx latus Agassiz, 1831, Harengula clupeola (Cuvier, 1829) and Hemiramphus brasiliensis (Linnaeus, 1758) (Carvalho-Filho 1999). These are considered visitingmarine species in northeastern Brazilian estuaries and based on literature records
(Carvalho-Filho 1999, Barros et al. 2000, Araújo et al. 2004) it was
expected that the species cited above should be more representative. Juvenile individuals of Acanthurus chirurgus (Bloch, 1787)
and Scomberomorus cavalla (Cuvier, 1829) were each represented Table 3. Main species contributing for differences in fish assemblages structure
among samples.
Tabela 3. Principais espécies que contribuem para as diferenças na estrutura
da assembléia de peixes entre as amostras.
Species Av. Dissim. Dissim/SD Contrib% Cum.%
Ste. ras. 5.82 1.92 9.08 9.08
Pel. har. 5.41 1.62 8.43 17.51
Pom cor. 5.14 1.57 8.01 25.52
Cat. spi. 4.83 1.45 7.52 33.04
Ste. ste. 4.71 1.55 7.34 40.38
Chi. ble 4.13 1.35 6.43 46.81
Ste. ras – Stellifer rastrifer, Pel. har – Pellona harroweri, Pom. cor – Pomadasys corvinaeformis, Cat. spi – Cathrops spixii, Ste. ste. – Stellifer stellifer, Chi. ble – Chirocentrodon bleekerianus, Av. Dissim. – average dissimilarity, Dissim/SD – dissimilarity, Contrib% - % Contribution, Cum.% - % Cumulative.
Ste. ras – Stellifer rastrifer, Pel. har – Pellona harroweri, Pom. cor – Pomadasys corvinaeformis, Cat. spi – Cathrops spixii, Ste. ste. – Stellifer stellifer, Chi. ble – Chirocentrodon bleekerianus, Av. Dissim. – dissimilaridade média, Dissim/SD – dissimilaridade,
Contrib% - % Contribuição, Cum.% - % Cumulativo.
Figure 5. Representation of ecological indices throughout the samplings carried out in São Cristóvão beach in the years 2010 to 2011. The bars indicate the
standard error and the curve represents mean rainfall in the months of sampling.
by a single individual, captured in only one trawling event, and are
characteristic of other environments (Carvalho-Filho 1999). The surgeonfish species are typical of reef environments (Smith 1997), while adult horse-mackerels live in pelagic zones (Smith 1997). However, the fact that these species were present in a sandy beach
ecosystem substantiate these areas as migration routes, and are
possibly regions where juvenile individuals of several fish species can find shelter and food (Araújo et al. 2008, Veloso & Neves 2009). These individuals’ occurrence strengthens the hypothesis of
connectivity between more distant regions of the continental shelf
and more protected coastal areas (Félix et al. 2006).
In this study, the increase in fish abundance during the rainy months was favored by the great amount of schooling fish species.
During the rainy season the concentration of nutrients increases and salinity decreases, which favors primary productivity and,
consequently, the higher trophic levels (Trujillo & Thurman 2008, Frédou et al. 2009). This is the case of Pellona harroweri (Fowler, 1917), Stelliferrastrifer (Bloch, 1790), Stellifer stellifer (Bloch, 1790), Pomadasys corvinaeformis (Steindachner, 1868)
and Chirocentrodon bleekerianus (Poey, 1867) which form dense schools (Carvalho-Filho 1999) and also Cathorops spixii (Agassiz,
1829) which is the most common species of catfish in the brazilian littoral (Figueiredo & Menezes 1978) being thus privileged at this
time of the year. This explains the high values of abundance found for these species.
P. harroweri, S. rastrifer, S. stellifer, P. corvinaeformis, C. spixii
and C. bleekerianus individuals, as well as other species, also feed on benthic invertebrates and several different crustaceans (Figueiredo &
Menezes 1978, Menezes & Figueiredo 1980, Carvalho-Filho 1999, Sazima et al. 2004) and are benefitted during the rainy season. For
this reason, these species’ abundance peaks match with the shrimp,
whose peaks also occur during the rainy season (Frédou et al. 2009). A similar pattern was found by Teixeira & Almeida (1998) in three beaches along the coast of Alagoas and by Araújo et al. (2008) at
Frade Island (state of Espírito Santo), which associated the increase
in the number of fish to the high primary productivity promoted by
the rainy season.
Species richness was greater than that found in other studies carried out along the Brazilian coast, such as Avenida and Sobral
beaches (Maceió, Alagoas), Berlinque beach (Vera Cruz, Bahia) and Frade Island (Espírito Santo) (Teixeira & Almeida 1998, Araújo et al. 2008, Oliveira-Silva et al. 2008). The greatest richnes’s value (3.43)
observed in this research was recorded in April, the month with
rainfall peak. This value was below to that registered (6.17) in Cabuçu beach (Bahia state) Oliveira-Silva et al. 2008. As pointed out in the
present research, this greatest richness was observed during the rainy
season. However, no difference was detected among months for
this index. The data presented are in accordance with other authors
(Godefroid et al. 2004, Santana & Severi 2009), which recorded a lack of seasonality for richness index. It is very difficult to compare
this index between different studies, since such a variation may be due to differences in sampling procedures, greater coverage of the sampled area, long period of sampling, number of trawlings and period of trawling (day/night). Besides, the studies cited above undertook manual beach trawling, while this study was based on otter trawling – which captures more species and individuals. The use of doors increases the weight of the net and results in direct contact with the soil, digging up the substrate and disturbing the species that live there (Jennings et al. 2001).
In relation to the Shannon-Wiener index, the results presented here showed significant differences only between the months April
and June and April and October, however these differences were not recorded when the index values were compared between dry and
rainy seasons. Similar results were reported by Araújo et al. (2008) and Santana & Severi (2009) for Frade Island (state of Espírito Santo)
and Jaguaribe beach (state of Pernambuco), respectively. In these
studies, the diversity throughout seasons did not differ significantly.
It is believed that the occurrence of only two seasons (rainy and dry)
in tropical regions influences the local fish community diversity,
providing a homogeneous pattern among areas, once a great similarity
between seasons are observed during the entire year. However, the
rainy season tends to present higher values of diversity due to the
increase in primary productivity (Araújo et al. 2008, Frédou et al. 2009)
In relation to feeding habits, the most abundant trophic category was first order carnivores, which were represented mainly by
P. corvinaeformis (Steindachner, 1868). This category is usually observed in different ecosystems, as its species present varied ecomorphologies with diverse oral and sensorial apparatus that allow them to explore different kinds of food from a variety of environments
(Ferreira et al. 2004).
The benthic invertebrate assemblages of sandy beaches include different species; however crustaceans, mollusks and polychaetas are generally dominant and may attain high abundance and biomass. It is possible that most invertebrates typical of sandy beaches do not
occur in any other environment (Schlacher et al. 2008). These species present unique adaptations to survive in a dynamic environment,
such as protective exoskeletons, mobility and burrowing ability, endogenous rhythms and behavioural plasticity (Veloso & Neves
2009). Zooplankton and shrimp of different sizes are quite abundant in sandy beaches, and fish are usually classified as top-level predators of this kind of ecosystem (Defeo et al. 2009). Such information strengthens the results of this study, where the category of the first
order carnivores was favored by the great availability of these organisms.
This study confirmed what several other Brazilian authors have highlighted (Giannini & Paiva Filho 1995, Teixeira & Almeida 1998, Godefroid et al. 2003, Godefroid et al. 2004, Araújo et al. 2008, Monteiro-Neto et al. 2008, Oliveira-Silva et al. 2008) about the fish fauna of sandy beaches – an ecosystem with great species richness, yet with few dominant species. São Cristóvão Beach’s fish
assemblage is characterized by the great richness and abundance of Sciaenidae, which is similar to what has been observed in other studies. Individuals from Sciaenidae are commonly captured by trawler boats, and are one of the most important resources for coastal
demersal fishing (Giannini & Paiva Filho 1990, Souza et al. 2008).
Due to this family’s great representativity – as in the case of Stellifer rastrifer (Jordan, 1889), Stellifer stellifer (Bloch, 1790) and Larimus breviceps Cuvier, 1830 – the category of the first order carnivores
was the most abundant.
Conclusions
This study presents new data and is one of the first of its kind
to focus on the northern coast of the Brazilian state of Rio Grande do Norte. Such research is important because few studies have
been carried out on this state’s coast and it is imperative to acquire
knowledge on its biodiversity due to the anthropic actions that have been increasingly affecting beach ecosystems.
São Cristóvão Beach is characterized by the great abundance and richness of fish species, especially that of Family Sciaenidae. The occurrence of reef and pelagic fishes strengthens the connectivity
concept among the most distant regions of the continental shelf and the more protected coastal areas. This suggests that this ecosystem
in the monthly and seasonal abundance patterns of this region was
observed – some species were significantly more abundant during
the rainy season. The great availability of mobile invertebrates that is recorded in sandy beach ecosystems favored the most representative
trophic categories: first and second order carnivores. The results
presented here show the importance of sandy beaches for the
development of the several fish species that use this environment
for different purposes.
References
ALVERSON, D.L., FREEBERG, M.H., MURAWSKI, S.A. & POPE, J. 1994. A global assessment of fisheries bycatch and discards. FAO, Rome. FAO Fisheries Technical Paper, n.339.
ARAÚJO, F.G., CRUZ-FILHO, A.G., AZEVÊDO, M.C.C. & SANTOS, A.C.A. 1998. Estrutura da comunidade de peixes demersais da baía de Sepetiba, RJ. Rev. Bras. Biol. 58(3):417-430. http://dx.doi.org/10.1590/ S0034-71081998000300007
ARAÚJO, M.E., TEIXEIRA, J.M.C. & OLIVEIRA, A.M.E. 2004. Peixes estuarinos marinhos do nordeste brasileiro. Editora Universidade Federal do Ceará, Universidade Federal de Pernambuco, Fortaleza.
ARAÚJO, C.C.V., ROSA, D.M., FERNANDES, J.M., RIPOLI, L.V. &
KROHLING, V. 2008. Composição e estrutura da comunidade de peixes de uma praia arenosa da Ilha do Frade, Vitória, Espírito Santo. Iheringia, Sér. Zool. 98(1):129-135. http://dx.doi.org/10.1590/S0073-47212008000100016
AYRES, M., AYRES JÚNIOR, M. & SANTOS, A.A.S. 2007. BioEstat - Aplicações estatísticas nas áreas das ciências biomédicas. Sociedade Civil Mamirauá, Belém.
BARROS, H.M., ESKINAZI-LEÇA, E., MACEDO, S.J. & LIMA. T. 2000. Gerenciamento participativo de estuários e manguezais. Editora Universitária da UFPE, Recife.
BASCOM, W. 1980. Waves and Beaches: the dynamics of the ocean surface.
Anchor Press, New York.
BROWN, A.C. & McLACHLAN, A. 1990. Ecology of sandy shores. Elsevier,
New York.
BOUCHON-NAVARRO, Y., BOUCHON, C. & LOUIS, M. 1992.
L’ichtyofaune des herbiers de phanérogames marines de la baie de
Fort-de-France (Martinique, Antilles Françcaises). Cybium 16(4):307-330. CARVALHO-FILHO, A. 1999. Peixes da Costa Brasileira. 3. ed. Editora
Melro, São Paulo.
DAVIES, R.W.D., CRIPPS, S.J., NICKSON, A. & PORTER, G. 2009.
Defining and estimating global marine fisheries bycatch. Mar.
Policy 33(4):661-672.
DEFEO, O., MCLACHLAN, A., SCHOEMAN, D.S., SCHLACHER, T.A., DUGAM, J., JONES, A., LASTRA, M. & SCAPINI, F. 2009. Threats to sandy beach ecosystems: A review. Estuar. Coast. Shelf S. 81:1-12. http://dx.doi.org/10.1016/j.ecss.2008.09.022
FÉLIX, F.C., SPACH, H.L., HACKRADT, C.W., MORO, P.S. & ROCHA, D.C. 2006. Abundância sazonal e a composição da assembléia de peixes em duas praias estuarinas da Baía de Paranaguá, Paraná. Rev. Bras. Zool. 8(1):35-47.
FERREIRA, C.E.L., FLOETER, S.R., GASPARINI, J.L., FERREIRA, B.P. &
JOYEUX, J.C. 2004. Trophic structure patterns of Brazilian reef fishes: a latitudinal comparison. J. Biogeogr. 31:1093-1106.
FIGUEIREDO, J.L. 1977. Manual de Peixes marinhos do sudeste do Brasil: I Introdução, Cações, raias e quimeras. Museu de Zoologia da Universidade de São Paulo, São Paulo.
FIGUEIREDO, J.L. & MENEZES, N.A. 1978. Manual de Peixes marinhos do sudeste do Brasil: II Teleostei (1). Museu de Zoologia da Universidade de São Paulo, São Paulo.
FIGUEIREDO, J.L. & MENEZES, N.A. 1980. Manual de Peixes marinhos do sudeste do Brasil: III Teleostei (2). Museu de Zoologia da Universidade de São Paulo, São Paulo.
FIGUEIREDO, J.L. & MENEZES, N.A. 2000. Manual de Peixes marinhos do sudeste do Brasil: VI Teleostei (5). Museu de Zoologia da Universidade de São Paulo, São Paulo.
FISHBASE. http://www.fishbase.org (último acesso em 20/10/2011). FRANCO, A.C.N.P., SCHWARZ JUNIOR, R., PIERRI, N. & SANTOS,
G.C. 2009. Levantamento, sistematização e análise da legislação aplicada
ao defeso da pesca de camarões para as regiões sudeste e sul do Brasil.
Bol. Inst. Pesca, 35(4):687-699.
FRÉDOU, F.L., MOURÃO, K., BARBOSA, C., ALMEIDA, O., RIVERO, S. & THOMPSON, R. 2009. Caracterização das pescarias industriais da costa norte do Brasil. Paper NAEA, v. 237.
GARCIA, M.A. & VIEIRA, J.P. 2001. O aumento da diversidade de
peixes no estuário da Lagoa dos Patos durante o episódio El niño. Atlântica, 23:85-96.
GARCIA JUNIOR, J. 2006. Inventário das espécies de peixes da costa do estado do Rio Grande do Norte e Aspectos zoogeográficos da ictiofauna recifal do oceano Atlântico. Dissertação de mestrado, Universidade
Federal do rio Grande do Norte, Natal.
GIANNINI, R. & PAIVA FILHO, A.M. 1990. Os Sciaenidae
(Teleosti: Perciformes) da Baía de Santos (SP), Brasil. Bol. Inst.
Oceanogr. 38(1):69-86.
GIANNINI, R. & PAIVA FILHO, A.M. 1995. Análise comparativa da ictiofauna da zona de arrebentação de praias arenosas do estado de São Paulo, Brasil. Bol. Inst. Oceanogr. 43(2):141-152.
GODEFROID, R.S., SPACH, H.L., SCHWARZ-JÚNIOR, R. & QUEIROZ, G.M.L. 2003. A fauna de peixes da praia do Balneário Atami, Paraná, Brasil. Atlântica 25(2):147-161.
GODEFROID, R.S., SPACH, H.L., SANTOS, C., MACLAREN, G. & SCHWARZ-JÚNIOR, R. 2004. Mudanças temporais na abundância e
diversidade da fauna de peixes do infralitoral raso de uma praia, sul do
Brasil. Iheringia, Sér. Zool. 94(1):95-104. http://dx.doi.org/10.1590/ S0073-47212004000100017
GUEDES, D.S., VASCONCELOS FILHO, A.L. & MACEDO, R.M. 2005. Ictiofauna do infralitoral adjacente às margens do canal de Santa Cruz - Itapisuma, Pernambuco. Bol. Téc. Cient. CEPENE 13(2):65-75. HAMMER, Ø., HARPER, D.A.T. & RYAN, P.D. 2001. Past: paleontological
statistics software package for education and data analysis. Palaeontol.
Electron. 4(1).
INSTITUTO DE DESENVOLVIMENTO SUSTENTÁVEL E MEIO
AMBIENTE DO RIO GRANDE DO NORTE – IDEMA. Governo do Estado do Rio Grande do Norte. www.idema.rn.gov.br (último acesso
em 25/08/2010).
INSTITUTO DE DESENVOLVIMENTO SUSTENTÁVEL E MEIO AMBIENTE DO RIO GRANDE DO NORTE – IDEMA. 2008. Perfil
do seu município - Areia Branca. Natal.
INSTITUTO BRASILEIRO DO MEIO AMBIENTE E DOS RECURSOS NATURAIS RENOVÁVEIS - IBAMA. 2007. Estatística da pesca 2005 - Brasil, grandes regiões e unidades da federação. Diretoria da Fauna e Recursos Pesqueiros - Difap, Brasília.
JENNINGS, S., KAISER, M.J. & REYNOLDS, J.D. 2001. Marine fisheries
Ecology. Blackwell Publishing Company, Oxford.
KAISER, M.J., COLLIE, J.S., HALL, S.J., JENNINGS, S. & POINER, I.R. 2001. Impacts of fishing gear on marine benthic habitats. In Reykjavik Conference on Responsible Fisheries in the Marine Ecosystem (University Cinema and Conference Center). Reykjavik, Iceland.
KUMAR, A.B. & DEEPTHI, G.R. 2006. Trawling and by-catch: Implications on marine ecosystem. Curr. Sci. India, 90(7).
LASIAK, T.A. 1986. Juveniles, food, and the surf zone habitat: implications for the teleost nursery areas. S. Afr. J. Zool. 21:51-55.
LOWE-McCONNEL, R.H. 1999. Estudos Ecológicos de Comunidades de Peixes Tropicais. EdUSP, São Paulo.
MARCENIUK, A.P. 2005. Chave para identificação das espécies de
bagres marinhos (Siluriformes, ariidae) da costa brasileira. Bol. Inst.
Pesca. 31(2):89-101.
MCLACHLAN, A. & BROWN, A.C. 2006. The Ecology of Sandy Shores.
Academic Press. Burlington, Massachusetts.
MENEZES, N.A. & FIGUEIREDO, J.L. 1980. Manual de Peixes marinhos do sudeste do Brasil: IV Teleostei (3). Museu de Zoologia da Universidade de São Paulo, São Paulo.
MENEZES, N.A. & FIGUEIREDO, J.L. 1985. Manual de Peixes marinhos do sudeste do Brasil: V Teleostei (4). Museu de Zoologia da Universidade de São Paulo, São Paulo.
MONTEIRO-NETO, C., TUBINO, R.A., MORAES, L.E.S., MENDONÇA NETO, J.P., ESTEVES, G.V. & FORTES, W.L. 2008. Associações de peixes na região costeira de Itaipu, Niterói, RJ. Iheringia, Sér. Zool. 98(1):50-59.
OLIVEIRA-SILVA, J.T., PESO-AGUIAR, M.C. & LOPES, P.R. 2008. Ictiofauna das praias de Cabuçu e Berlinque: Uma contribuição ao
conhecimento das comunidades de peixes na Baía de Todos os Santos,
Bahia, Brasil. Biotemas, 21(4):105-115.
PAIVA, A.C.G., CHAVES, P.T.C. & ARAÚJO, M.E. 2008. Estrutura e organização trófica da ictiofauna de águas rasas em um estuário tropical. Rev. Bras. Zool. 25(4):647-661. http://dx.doi.org/10.1590/S0101-81752008000400010
PRIMER-E. 2000. Plymouth Routines In Multivariate Ecological Research. Plymouth, Plymouth Marine Laboratory.
SANTANA, F.M.S. 2009. Ictiofauna da zona de arrebentação da praia de Jaguaribe, Itamaracá, Pernambuco: composição, abundância e distribuição mensal. Dissertação de mestrado, Universidade Federal do
Rural de Pernambuco, Recife.
SANTANA, F.M.S. & SEVERI, W. 2009. Composição e estrutura da assembléia de peixes da zona de arrebentação da praia de Jaguaribe, Itamaracá, Pernambuco. Bioikos, 23(1):3-17.
SAZIMA, C., MOURA, R.L. & SAZIMA, I. 2004. Chirocentrodon bleekerianus (Teleostei: Clupleiformes: Pristigasteridae), a small predaceous herring with folded and distinctively oriented prey in stomach. Braz. J.
Biol. 64(1):165-68.
SCHLACHER, T.A., SCHOEMAN, D.S, DUGAN, J., LASTRA, M., JONES, A., SCAPINI, F. & MCLACHLAN, A. 2008. Sandy beach ecosystems:
key features, sampling issues, management challenges and climate
change impacts. Mar. Ecol. 29(1):70-90. http://dx.doi.org/10.1111/j.1439-0485.2007.00204.x
SOUZA, U.P., COSTA, R.C., MARTINS, I.A. & FRANSOZO, A. 2008. Associação entre as biomassas de peixes Sciaenidae (Teleostei:
Perciformes) e de camarões Penaeoidea (Decapoda: Dendrobranchiata)
no litoral norte do Estado de São Paulo. Biota Neotrop. 8(1): http://www.
biotaneotropica.org.br/v8n1/pt/abstract?article+bn02108012008 (último
acesso em 23/10/2011).
SMITH, C.L. 1997. Tropical Marine Fishes of the Caribbean, the Gulf of Mexico, Florida, the Bahamas, and Bermudas. Alfred A. Knopf, New
York.
TEIXEIRA, R.L. & ALMEIDA, G.I. 1998. Composição da ictiofauna de três praias arenosas de Maceió, Al, Brasil. Bol. Mus. Biol. Mello Leitão. 8:21-38.
TRUJILLO, A.P. & THURMAN, H.V. 2008. Essentials of Oceanography. 9th ed. Pearson Prentice Hall & Pearson Education, United States of America.
VASCONCELLOS, R.M., SANTOS, J.N.S., SILVA, M.A. & ARAÚJO,
F.G. 2007. Efeito do grau de exposição às ondas sobre a comunidade de peixes juvenis em praias arenosas do Município do Rio de Janeiro, Brasil. Biota Neotrop. 7(1): http://www.biotaneotropica.org.br/v7n1/pt/ abstract?article+bn01907012007 (último acesso em 15/09/2011). VELOSO, V.G. & NEVES, G. 2009. Praias Arenosas. In Biologia Marinha
(R. C. PEREIRA & A. S. GOMES eds). 2. ed. Editora Interciência, Rio
de Janeiro, p.339-359.
VIANNA, M. & ALMEIDA. T. 2005. Bony Fish Bycatch in the Southern Brazil Pink Shrimp (Farfantepenaeus brasiliensis and F. paulensis)
Fishery. Braz. Arch. Biol. Techn. 48(4):611-623. http://dx.doi.
org/10.1590/S1516-89132005000500014