LIME APPLICATION METHODS, WATER AND BOTTOM
SOIL ACIDITY IN FRESH WATER FISH PONDS
Julio Ferraz de Queiroz1*; Gilberto Nicolella1; Charles Wesley Wood2; Claude Elson Boyd3
1
Embrapa Meio Ambiente - Rod. SP 340 km 127,5, C.P. 69 - 13820-000 - Bairro Tanquinho Velho - Jaguariúna, SP - Brasil.
2
AU - Department of Agronomy and Soils, Auburn University, Alabama 36849, USA. 3
AU - Department of Fisheries and Allied Aquacultures, Auburn University. *Corresponding author<jqueiroz@cnpma.embrapa.br>
ABSTRACT: Although some methods for determining lime requirement of pond soils are available and commonly used, there is still no consensus on whether it is more effective to apply liming materials to the bottoms of empty ponds or to wait and apply them over the water surface after ponds are filled. There is also little information on how deep lime reacts in pond sediment over time, and whether the depth of reaction is different when liming materials are applied to the water or to the soil. Therefore, three techniques for treating fish ponds with agricultural limestone were evaluated in ponds with clayey soils at a commercial fish farm. Amounts of agricultural limestone equal to the lime requirement of bottom soils were applied to each of three ponds by: direct application over the pond water surface; spread uniformly over the bottom of the empty pond; spread uniformly over the bottom of the empty pond followed by tilling of the bottom. Effectiveness of agricultural limestone applications did not differ among treatment methods. Agricultural limestone also reacted quickly to increase total alkalinity and total hardness of pond water to acceptable concentrations within 2 weeks after application. The reaction of lime to increase soil pH was essentially complete after one to two months, and lime had no effect below a soil depth of 8 cm. Tilling of pond bottoms to incorporate liming materials is unnecessary, and tilling consumes time and is an expensive practice; filled ponds can be limed effectively.
Key words: liming, total alkalinity, total hardness, sediments
MÉTODOS DE CALAGEM, ACIDEZ DA ÁGUA E DO SEDIMENTO
DO FUNDO DE VIVEIROS DE PISCICULTURA
RESUMO: Alguns métodos para determinar a quantidade de calcário necessária para corrigir a acidez do fundo dos viveiros de piscicultura estão disponíveis e rotineiramente em uso, mas ainda não existe um consenso se é mais eficiente fazer a aplicação diretamente no fundo ou sobre a superfície da água após o abastecimento dos viveiros. Além disso, existem poucas informações disponíveis sobre até que profundidade o calcário reage com o sedimento do fundo ao longo do tempo, e se a profundidade na qual ocorrem as reações é diferente quando o calcário é aplicado sobre a superfície da água ou sobre o solo. Dessa forma, três técnicas para calagem foram avaliadas em viveiros com solo argiloso em uma piscicultura comercial de acordo com os seguintes métodos: aplicação direta sobre a superfície da água do viveiro, distribuição uniforme sobre o fundo do viveiro vazio, distribuição uniforme sobre o fundo do viveiro vazio seguida da aragem. A eficácia da aplicação do calcário agrícola não diferiu entre os métodos de tratamento. O calcário agrícola reagiu rapidamente para aumentar a alcalinidade e a dureza total da água dos viveiros para concentrações aceitáveis após duas semanas. O aumento do pH do sedimento se completou essencialmente após um a dois meses, e o calcário agrícola não teve efeito sobre as camadas de sedimento abaixo de 8 cm. A aração do fundo dos viveiros para incorporação de materiais é desnecessária, consome tempo e é dispendiosa; a calagem pode ser feita de forma eficaz em viveiros cheios.
Palavras-chave: calcário, alcalinidade total, dureza total, sedimentos
INTRODUCTION
Acidic bottom soil is a common problem in pond aquaculture, and fish farmers often apply agricultural limestone to ponds as a remedy. Aquaculture ponds are usually limed after draining for harvest and before refill-ing for the next crop (Boyd & Tucker, 1998). However,
sportfish ponds are usually not drained for liming, and agricultural limestone is spread over the water surface from a boat (Boyd, 1982).
positive responses in phytoplankton productivity and fish production following liming of acidic ponds, and meth-ods for determining the lime requirements of bottom soils have been developed (Boyd, 1995). Nevertheless, liming often is applied to ponds indiscriminately, with no con-cern for bottom soil pH or total alkalinity and total hard-ness concentrations. It is doubtful that liming has a large influence where soil pH is above 7 or total alkalinity is above 50 mg L-1 (Boyd, 1995).
Aquaculture ponds are ordinarilly drained for harvest, bottoms are allowed to dry, and liming materi-als are applied. Lime is frequently blended with the bot-tom soil by tilling. In spite of the widespread use of lime, studies to compare the effectiveness of differ-ent methods of application have not been made. This study, conducted at a commercial fish farm, compares three methods of applying agricultural limestone to ponds, including: application over the pond water sur-face, application to the bottom of the dry pond, and ap-plication to the bottom of the dry pond followed by till-ing.
MATERIAL AND METHODS
Experimental Design
The experiment was conducted in Itupeva Dis-trict, São Paulo State (23o
11' S and 47o
02' W). Soils in the area usually are of sandy clay or clayey texture of Ultisol and Oxisol orders. Pond bottoms had 300 - 400 g kg-1 clay, 400 - 500 g kg-1 silt, and 100 - 200 g kg-1 sand. Water is supplied from a small, natural stream and all ponds are located on the stream's flood plain.
Trial was set up in 1,000-m2, 1.0-m deep, rect-angular ponds, stocked with 320,000 to 450,000 finger-ling Nile tilapia. Feeds and fertilizers were applied ac-cording to the recommendations of the farm manager. The commercial fish feed contained 32% crude protein, and each pond received 170 to 200 kg feed per month. The farmer did not keep records of fertilizer additions nor provided data on fish production. However, based on an assumed feed input of 2% body weight per day, standing crops of fish were estimated to be 2,800 to 3,200 kg ha-1
.
Nine ponds were made available, but it was not possible to initiate the entire experiment at once. One replication of each of the three treatments was installed in groups of three ponds on December 24, 2001, March 7, 2002, and May 18, 2002. Each group of ponds was managed for about 4 months before fish were har-vested. The agricultural limestone dose was based on the lime requirement of the pond bottom soil and ranged from 4,000 and 5,000 kg ha-1. The treatments were as follows: agricultural limestone applied over the wa-ter surface at the beginning of the crop; agricultural limestone spread uniformly over the bottom soil before
filling ponds with water; agricultural limestone spread uniformly over the bottom soil and soil tilled to a depth of 10 cm with hand tools before filling ponds with wa-ter.
Water and Soil Analyses
Water samples were collected from ponds weekly and analyzed for total alkalinity and total hardness by acidimetry and EDTA (ethylenediami-netetraacetic acid) titration, respectively (Clesceri et al., 1998). Soil cores of 20-cm length were collected from ten locations in each pond with a 5-cm diameter core tube before ponds were treated with agricultural limestone and at 1-month intervals for four months. The cores were cut into 2-cm long segments as described by (Munsiri et al., 1995). Soil samples were oven dried at 60oC in a mechanical convection oven and pulverized through a 40-mesh screen (0.425-mm openings). Soil pH was measured in 1:1 mixtures of dry soil and distilled water (Thunjai et al., 2001). The exchangeable acidity was measured by the change in pH caused by adding 5 g soil to 10 mL of a p-nitrophenol buffer solution (Adams & Evans, 1962).
Data Analysis
The experiment was arranged as a split-split plot with lime application method (4) as main plots, soil depths (10) as sub-plots, and time (number of sampling dates: 10 for soil pH and exchangeable acidity, 10 for water alkalinity and hardness, and 2 for soil free calcium carbonate) as sub-sub-plots. Each plot/sub-plot/sub-sub-plot combination was replicated three times. A total of 12 ponds (four main plots and three replications) were used to conduct the experiment at each location. The com-bined analyses of data was realized to determine the av-erage responses of treatment for all considered months, and also if these results were consistent for each month. The statistical model described by Steel & Torrie (1980) was used.
RESULTS AND DISCUSSION
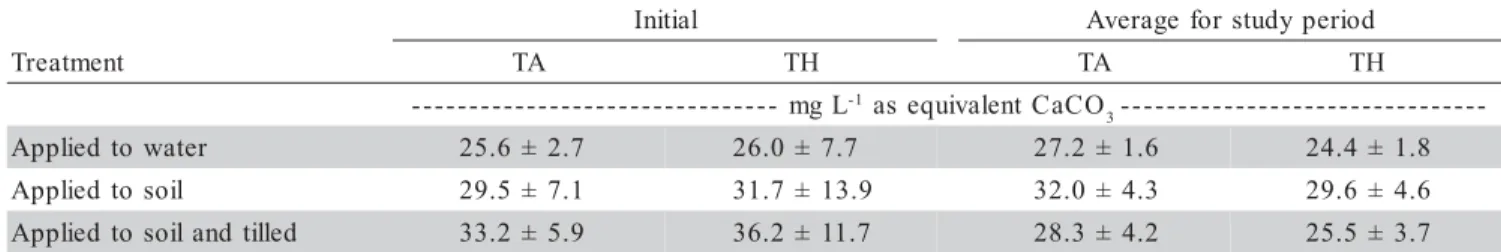
Immediately after filling with water, total alka-linity concentrations averaged from 25.6 to 33.2 mg L-1
in ponds of the three treatments. Total alkalinity remained above 25 mg L-1
Total alkalinity and total hardness presented simi-lar variation in the three liming treatments. No differences were found between the treatments for total alkalinity (P > 0.35) and total hardness (P > 0.47). There were no interactions between liming treatments and time after lime application for total alkalinity (P > 0.71) and total hard-ness (P > 0.78).
The effects of five time intervals were studied and they showed differences only for total alkalinity (P > 0.001). The time intervals started one month after lime application corresponding to the first interval, and every three weeks corresponded to the subsequent in-tervals until the end of the experiment. The data showed a significant increase in total alkalinity after 10 weeks of lime application, and this was not affected by the lime application method (Duncan test, α = 0.05, SEM =
20.81) (Table 2). Treatment with agricultural limestone increased concentrations of total alkalinity and total hardness (P < 0.05) over the experimental period, but the method of applying agricultural limestone did not influence the average concentrations of the two vari-ables.
The exchangeable acidity of the soil samples was quite low and often no more than 1 or 2 meq 100 g-1. Such low exchangeable acidity values for soils with low pH reveals that the soil had low cation exchange capacity (Boyd, 1995). The low exchangeable acidity concentra-tions also were difficult to measure, because an expanded-scale pH meter capable of 0.01 pH accuracy was not available.
The coefficient of variation related to exchange-able acidity of pond bottom soils, after square root trans-formation was 21.99%, and no differences were ob-served among treatments (P > 0.65). However, differ-ences in exchangeable acidity between depths were ob-served (P < 0.0001), mostly occurring within 0 - 10 cm. There were no two-way and three-way interactions, with exception of the interaction between treatment and time (P < 0.0005). Therefore, the effects of each treatment were evaluated over time, and were highly significant (0.0001< P < 0.0021). For the treatment where agricul-tural lime was applied over pond water surface, ex-changeable acidity was higher three months after appli-cation with differences in relation to remaining months
Table 1 - Average concentrations of total alkalinity (TA) and total hardness (TH) in ponds that were treated with agricultural limestone by three methods.
l a i t i n
I Averagefor studyperiod
t n e m t a e r
T TA TH TA TH
L g m
-- -1as equivalentCaCO
3--- -r e t a w o t d e i l p p
A 25.6± 2.7 26.0 ± 7.7 27.2± 1.6 24.4± 1.8
l i o s o t d e i l p p
A 29.5± 7.1 31.7 ± 13.9 32.0± 4.3 29.6± 4.6
d e l l i t d n a l i o s o t d e i l p p
A 33.2± 5.9 36.2 ± 11.7 28.3± 4.2 25.5± 3.7
Table 2 - Average concentrations of total alkalinity over all the experimental period in ponds that were treated with agricultural limestone by three methods (N = 12).
Means with the same letter are not different by Duncan’s test (P < 0.05).
e m i
T Average
s k e e
w mgL-1as equivalentCaCO
3 7
1 27.01bc
3
1 24.10c
0
1 32.47a
7 30.40ab
4 27.52bc
(Duncan test, α = 0.05). This could be related to a
re-duction on the action of agricultural lime over pond bot-tom soil. There were also differences in exchangeable acidity one month after application of agricultural lime over the soil surface in comparison to the other months (Duncan test, α = 0.05). For the treatment where
agri-cultural lime was incorporated into the soil by tilling, the same trend was observed.
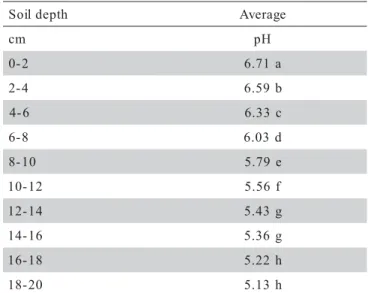
Data regarding mud pH of pond bottom soil pre-sented a coefficient of variation of 4.75% among samples and indicates that the soils at the fish farm did not present a large variation in composition. No differences were ob-served among treatments during the experiment (P > 0.12), but differences in mud pH were observed among soil depths (P < 0.0001) (Table 3). The mud pH of the superficial layer (0-2 cm) was higher in compari-son to the deeper layers. Thus, liming effects were most effective in the first layer and effectiveness decreased with depth. There were also differences on mud pH val-ues during the experimental period (P < 0.0014) (Table 4).
signifi-cant (P < 0.0001). Regarding the treatment where lim-ing material was applied directly over the pond water sur-face (Table 5), dry pH on the first layer (0-2 cm) differed in relation to the other treatments (Duncan test, α = 0.05).
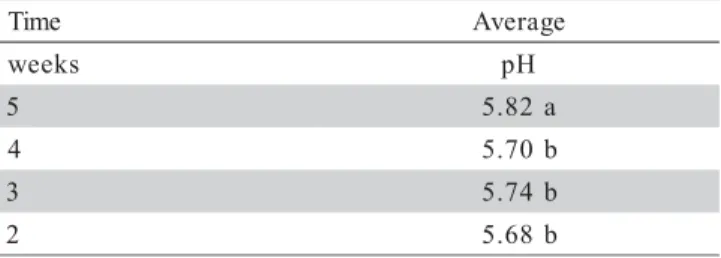
There also was a trend of decreasing pH with increasing depth (Table 5). There was also difference in pH related to time (P < 0.0005) and four months after lime applica-tion, a higher average of dry pH was observed in com-parison to the other times (Table 6).
Several features of the data are listed below:
1. All ponds initially had soil pH below 6.
2. Treatment with agricultural limestone increased soil pH above 6 in the 0-6 cm layer for all samples of all treat ments, and in most samples from the 6-8 cm layer. 3. Treatment with agricultural limestone did not increase
pH above 6 in soil below 8 cm depth.
4. Soil pH in samples taken before agricultural limestone was applied tended to decrease with increasing soil depth. The same trend existed after agricultural lime stone was applied.
Agricultural limestone caused an increase in soil pH within the upper 8-cm layer of soil, with the greatest increase being in the 0-4 cm layer (P < 0.05) (Figure 1). Considering all data, there were no differences among treatments on any dates (P > 0.05) for pH values when comparisons were made among the same depth layers. The reaction of agricultural limestone occurred quickly, and there was no difference in pH after the first month among treatments when a single soil layer was consid-ered (Figure 2). The increase in pH over initial pH was greatest in the 0-2 cm layer and became progressively less with greater soil depth.
Agricultural limestone reacts quickly to increase the total alkalinity and total hardness of pond water. The total alkalinity and total hardness concentrations after lim-Table 3 - Average soil mud pH in pond bottoms at different
depths following application of agricultural limestone during all the experimental period (N = 48).
Means with the same letter are not different by Duncan’s test (P < 0.05).
h t p e d l i o
S Average
m
c pH
2
-0 6.71a
4
-2 6.59b
6
-4 6.33c
8
-6 6.03d
0 1
-8 5.79e
2 1 -0
1 5.56f
4 1 -2
1 5.43g
6 1 -4
1 5.36g
8 1 -6
1 5.22h
0 2 -8
1 5.13h
Table 4 - Average soil mud pH in pond bottoms at different times following application of agricultural limestone during all the experimental period (N = 120).
Means with the same letter are not different by Duncan’s test (P < 0.05).
e m i
T Average
s h t n o
M pH
5 5.75b
4 5.87a
3 5.86a
2 5.78b
Table 5 - Average soil dry pH of pond bottoms at different depths, after agricultural limestone application (N = 12).
Means followed by the same letter do not differ by Duncan’s test (α = 0.05).
n o i t a c i l p p a e n o t s e m i L h t p e d l i o
S Over pondwater surface Noliming Pondbottomsoil Tilled pondbottomsoil
m
c --- pH---
-2
-0 6.63a 6.31a 7.07a 6.60a
4
-2 6.15b 6.13a 6.60 b 6.59a
6
-4 5.89c 5.81b 6.08c 6.04b
8
-6 5.78cd 5.66bc 5.77d 5.81c
0 1
-8 5.69cde 5.52cd 5.51e 5.70cd
2 1 -0
1 5.58def 5.46cde 5.47e 5.61cde
4 1 -2
1 5.58def 5.37de 5.41e 5.54def
6 1 -4
1 5.45ef 5.37de 5.38e 5.41ef
8 1 -6
1 5.43ef 5.29de 5.34e 5.35fg
0 2 -8
ing averaged 24.4 and 32.0 mg L-1. Agricultural limestone is sparingly soluble, and the equilibrium con-centration between solid calcium carbonate, water, and the normal atmospheric carbon dioxide level is about 57 mg L-1 (Stumm & Morgan, 1996). The Table 6 - Average soil dry pH in pond bottoms at different times during all the experimental period (N = 120).
Means with the same letter are not different by Duncan’s test (P < 0.05).
e m i
T Average
s k e e
w pH
5 5.82a
4 5.70b
3 5.74b
2 5.68b
solubility of agricultural limestone increases in waters where the dissolved carbon dioxide concentration is higher than that expected from equilibrium with normal atmospheric carbon dioxide (Hutchinson, 1957). In ponds, decomposition of soil organic matter by microorganisms and respiration of other aquatic organ-isms increases carbon dioxide concentration, and the to-tal alkalinity and toto-tal hardness may become quite high.
The depth of reaction of liming material into bot-tom soil is small in clayey soils in comparison to sandy soils. The upper 5 cm of pond soil has the greatest influ-ence on pond water quality and shrimp and fish produc-tion (Boyd, 1995). All three methods of applicaproduc-tion re-sulted in an increase in pH in this layer. These results and the increases in total alkalinity and total hardness con-centrations confirm that all three methods of application were effective. The rate and the depth of reaction were not related to the method of application. The maximum benefit of agricultural limestone was achieved in one to two months.
Ponds can be effectively limed by spreading agricultural limestone over water surfaces. Of course, if ponds are drained after each crop, it is easier to spread agricultural limestone over the pond bottom than to spread it over the water surface. Tilling pond bottom after applying agricultural limestone did not promote the reaction of the liming material with soil. Although tilling is beneficial for improving dry out and decomposition of organic residues in clayey soils (Boyd, 1995), ponds with sandy or loamy soils usu-ally dry out easily and tilling to lessen soil organic matter concentration is only necessary after several crops.
CONCLUSIONS
Liming is a common practice in pond aquacul-ture, and greater efficiency in the use of liming materials will benefit fish and shrimp producers. Ponds can be ef-fectively limed by applying liming materials over the wa-ter surface. It is not necessary to drain ponds and lime the bottoms. Pond effluents can pollute receiving waters, so aquaculture methods that allow ponds to be operated for several years without draining are highly desirable. Evidence was provided that undrained ponds can be pre-vented from becoming acidic through applying agricul-tural limestone over the water surface. Agriculagricul-tural lime-stone reacts quickly and can increase concentrations of total alkalinity and total hardness within two weeks and soil pH within one or two months. Thus, liming does not have to be done several months before benefits are achieved. Finally, agricultural limestone does not have to be tilled into the soil. This can lead to savings in labor costs.
Figure 1 - Average soil pH at different depths in the bottoms of fish ponds before treatment (initial) and 4 months after treatment (final) with agricultural limestone. The agricultural limestone application methods were as follows: water – applied over water surface; soil – applied on the bottom of empty pond; soil and till – applied over the bottom of empty pond after which the bottom was tilled.
Initial
pH
5 6 7
De
p
th
(c
m
)
0
2
4
6
8
10
12
14
16
18
20
Water Soil Soil & till
5 6 7
0
2
4
6
8
10
12
14
16
18
20
Water Soil
Soil & till
De
p
th
(c
m
Figure 2 - Average soil pH in different depth layers in the bottoms of fish ponds before treatment and at monthly intervals after treatment with agricultural limestone. The agricultural limestone application methods were as follows: water – applied over water surface; soil – applied on the bottom of empty pond; soil and till – applied over the bottom of empty pond after which the bottom was tilled.
0-2 cm
0 1 2 3 4
pH
5 6 7
Water Soil Soil & till
0 1 2 3 4
5 6 7
Water Soil Soil & till
2-4 cm
0 1 2 3 4
5 6 7
Water Soil Soil & till
pH
4-6 cm
0 1 2 3 4
5 6 7
Water Soil Soil & till
6-8 cm
0 1 2 3 4
pH
5 6 7
Water Soil Soil & till
8-10 cm
0 1 2 3 4
pH
5 6 7
Water Soil Soil & till
12-14 cm
0 1 2 3 4
5 6 7
Water Soil Soil & till
10-12 cm
0 1 2 3 4
5 6 7
Water Soil Soil & till
14-16 cm
Months after liming
0 1 2 3 4
pH
5 6 7
Water Soil
Soil & till 16-18 cm
0 1 2 3 4
5 6 7
Water Soil Soil & till
ACKNOWLEDGMENTS
To Mr. Valdir Donizete Betelli, owner of the Santa Barbara Fish Farm in Itupeva, SP, for allowing us to use his ponds and providing valuable assistance. To PD/A CRSP – Pond Dynamics Aquaculture – Collabo-rative Research Support Program, for providing the nec-essary financial support through the Work Plan No. 10, Grant No. 1282 to allow the development of this study.
REFERENCES
ADAMS, F.; EVANS, C.E. A rapid method for measuring lime requirement of red-yellow podzolic soils. Soil Science Society of America Proceedings, v.26, p.355-357, 1962.
BOYD, C.E. Liming fish ponds. Journal of Soil and Water Conservation, v.37, p.86-88, 1982.
BOYD, C.E. Bottom soils, sediment, and pond aquaculture. New York: Chapman and Hall, 1995. 348p.
BOYD, C.E.; TUCKER, C.S. Pond aquaculture water quality management. Boston: Kluwer Academic Publishers, 1998. 700p.
CLESCERI, L.S.; GREENBERG, A.E.; EATON, A.D. Standard methods for the examination of water and wastewater. 20.ed. Washington: APHA, 1998.
HUTCHINSON, G.E. A treatise on limnology. New York: John Wiley and Sons, 1957. v.1: Geography, physics, and chemistry.
MUNSIRI, P.; BOYD, C.E.; HAJEK, B.J. Physical and chemical characteristics of bottom soil profiles on ponds at Auburn, Alabama, USA, and a proposed method for describing pond soil horizons. Journal of the World Aquaculture Society, v.26, p.346-377, 1995.
STEEL, R.G.D.; TORRIE, J.H. Principles and procedures of statistics. 2.ed. New York: Mc Graw Hill, 1980. 633p.
STUMM, W.; MORGAN, J.J. Aquatic chemistry. New York: John Wiley and Sons, 1996. 1022p.
THOMASTON, W.W.; ZELLER, H.D. Results of a six-year investigation of chemical soil and water analysis and lime treatment in Georgia fish ponds. In: Annual Conference of the South Eastern Association of Game and Fish Commissioners, 1961. v.15, p.236-245.
THUNJAI, T.; BOYD, C.E.; DUBE, K. Pond soil pH measurement. Journal of the World Aquaculture Society, v.32, p.141-152, 2001.