R E S E A R C H
Open Access
An application of the Rasch model to
reading comprehension measurement
Sandra Santos, Irene Cadime, Fernanda Leopoldina Viana, Gerardo Prieto, Séli Chaves-Sousa,
Alina Galvão Spinillo and Iolanda Ribeiro
*Abstract
An effective reading comprehension measurement demands robust psychometric tools that allow teachers and researchers to evaluate the educational practices and track changes in students’performance. In this study, we illustrate how Rasch model can be used to attend such demands and improve reading comprehension measurement. We discuss the construction of two reading comprehension tests: TRC-n, with narrative texts, and TRC-e, with expository texts. Three vertically scaled forms were generated for each test (TRC-n-2, TRC-n-3, TRC-n-4; TRC-e-2, TRC-e-3 and TRC-e-4), each meant to assess Portuguese students in second, third and fourth grade of elementary school. The tests were constructed according to a nonequivalent groups with anchor test design and data were analyzed using the Rasch model. The results provided evidence for good psychometric qualities for each test form, including unidimensionality and local independence and adequate reliability. A critical view of this study and future researches are discussed.
Keywords: Rasch model, Vertical scaling, Reading comprehension, Assessment
Background
When developing robust reading comprehension tests, researchers must consider the specific challenges con-cerning the assessment of a skill that is expected to de-velop over the course of schooling (Taylor et al. 2005; Taylor & Pearson, 2005) and that is directly related to the development of other skills, including listening com-prehension, word reading, vocabulary knowledge and general cognitive abilities (Cain, 2010). For those rea-sons, to improve reading assessment quality, it is recom-mended that reading assessment should allow for the monitoring of the students’progress across grade levels and the diagnosis of reading difficulties (Cain, 2010).
Several reading comprehension tests have been con-structed to assess comprehension as a function of age or academic grade, so it is possible to compare a student’s performance with his/her normative group (e.g., Stanford Diagnostic Reading Test, 4th Ed., Karlsen & Gardner, 1996; Woodcock et al. 2004). However, when students take different tests across academic grades, intra-individual differences in developmental profiles cannot be compared because test performance estimates are on
different metrics and there is no functional relationship between scales. Using the same test across a wide range of grades raises a problem; depending on test difficulty, the results can be affected by severe ceiling effects in higher grades or extreme floor effects in lower grades. To address challenges associated with constructing tests that are sen-sitive to intra-individual changes, items from different tests must be placed in a single metric. This can be achieved using vertical scaling, i.e., the construction process of a scale meant to allow growth in a determined ability across developmental phases to be measured (de Ayala, 2009).
This paper presents two original tests that address the aforementioned constraints: the Test of Reading Com-prehension of Narrative Texts (TRC-n) and the Test of Reading Comprehension of Expository Texts (TRC-e). Three vertically scaled forms of each test were developed to assess reading comprehension of elementary Portu-guese students, respectively, in second, third and fourth grade of elementary school. The TRC-n is composed of test forms TRC-n-2, TRC-n-3 and TRC-n-4 and the TRC-e comprises the test forms TRC-e-2, TRC-e-3 and TRC-e-4. These two reading comprehension tests were constructed taking into account the recommendations of * Correspondence:[email protected]
Escola de Psicologia, Universidade do Minho, Braga, Portugal
several authors (e.g., Afflerbach, 2004; Eason et al. 2012; Hess, 2007; Sweet, 2005) to allow comparisons of results across grades (intraindividual level), as well as within each grade (interindividual level).
Issues in reading comprehension measurement
Reading comprehension is defined as the process of simultaneously extracting and constructing meaning through the involvement with written text (RAND Read-ing Study Group, 2002). The reader activates multiple cognitive processes at the word, sentence and text levels to integrate the information from the text with his previ-ous knowledge and, therefore, to construct a mental rep-resentation of the text message (Chen & Vellutino, 1997; Kintsch, 1998; Perfetti et al. 2005).
Research has shown that factors within the reader, fac-tors associated with the text being read and the tasks presented affect the nature of reading comprehension. Reader’s variables include linguistic knowledge, cognitive abilities, motivational aspects and world knowledge (cultural, social, affective). Text variables comprise text content, text type, text organization, and text readabil-ity. Reading tasks vary in their level of complexity ac-cording to the text, the test-tasks (e.g., multiple choice items, true/false questions), the reader, and the inter-action among them (Alderson, 2000; RAND Reading Study Group, 2002). Also, the nature of the task pre-sented to the reader must be considered since different tasks (e.g., text reproduction, question-answer, cloze task) access different facets of reading comprehension (Spinillo et al. 2016).
Regarding the text types, the literature indicates that differences in achievement can, to some extent, be traced to the use of narrative or expository text in read-ing comprehension tests (Eason et al., 2012; Mullis et al. 2012; RAND Reading Study Group, 2002). One way of dealing with this issue is to include different types of texts in the same test as it can be observed in some tests like the TCL, a Portuguese reading comprehension test (Cadime et al., 2013) and the ACL, a Spanish reading comprehension test (Català et al. 2001). Another alterna-tive is to construct independent tests, one for each type of text, as in the Progress in International Reading Liter-acy Study (Mullis et al., 2012). According to some re-searchers (Hess, 2007; Sweet, 2005), this alternative allows to obtain differentiated results for narrative and expository texts. Different scores may contribute to characterize indi-vidual achievement in reading comprehension, and guide instruction to specific text types.
Whether the texts are narrative or expository, tests must assess different comprehension levels, which in-volve the abilities to: (a) identify literal information; (b) make inferences; (c) reorganize information and; (d) make critical judgments (Alderson, 2000). Literal
comprehension (LC), inferential comprehension (IC), reorganization (R) and critical comprehension (CC) are terms used to differentiate these levels, respectively (Barrett, 1976; Català et al., 2001).
Reading comprehension assessment has focused mainly on literal and inferential comprehension (e.g. Andreassen & Braten, 2010; Best et al. 2008; Goff et al. 2005; Hess, 2007), whereas reorganization and critical comprehension levels are considered as sub-levels of inferential compre-hension. As guideline for test item development, it is useful to consider separate levels understanding in order to gauge the spectrum of skills associated with reading comprehension (Eason et al., 2012).
Although different reading comprehension levels can be identified in different taxonomies, they all characterize the demands of the tasks where reading comprehension is the underlying latent factor (Basaraba et al. 2013; Ozuru et al. 2008). A study conducted by Cadime and colleagues (2013) assessed the construct validity of a reading compre-hension test for Portuguese students in the second to fourth grades also validated this hypothesis. In this test the four levels of comprehension (LC, IC, R and CC) were considered and the results from the confirmatory factorial analysis revealed a one-factor structure for the reading comprehension construct in every school grade.
Thus, as guidelines, the construction of reading com-prehension tests should include scores related to differ-ent text types (mainly narrative or expository), consider the different comprehension levels and allow analyzing inter- and intra-individual changes over time.
The Rasch model
Item response theory models have been widely used in measurement applications in social areas such as lan-guage and educational testing (Boone & Scantlebury, 2006; Boone et al. 2011; Wilson & Moore, 2011). One of the models associated to Item Response Theory is the Rasch model, according to which the probability of a person responding correctly to an item depends on the difficulty of the item and on the person’s ability regard-ing the latent trait (Rasch, 1980).
items that are located approximately at the same level of the person ability along the continuum (for details, see Bond & Fox, 2007).
The process of aligning metrics by placing all the items parameters on the same scale is known as linking (de Ayala, 2009). When the item parameters are used to es-timate the persons’ability (θ), the person parameter esti-mations are also placed on the same metric. The process of measuring person estimations on the same scale is called equating. The construction process of a scale meant to allow growth in a determined ability across de-velopmental phases to be measured is known as vertical scaling or vertical equating. Vertical scaling is only pos-sible if the test forms support similar score inferences, assess the same construct for the same target population and are designed to be as similar as possible in content and statistical characteristics, except difficulty, which is expected to increase with academic grade levels (Kolen & Brennan, 2010).
This paper aimed to illustrate how Rasch model can contribute on reading comprehension measurement through multiple-choice tests. Three specific purposes were defined: (a) to examine the psychometric properties of the items; (b) to assess the test forms dimensionality, local independence and reliability, and; (c) to perform vertical scaling of the test forms of the TRC-n and the TRC-e.
Method Participants
All participants were native speakers of European Portuguese attending primary schools located in urban and rural areas in Portugal. One sample of 702 students took part in the study of the TRC-n. They were divided into three groups: 230 s graders (52.2 % were male, 57.8 % attending urban schools), 239 third graders (50.6 % were male, 63.2 % attending urban schools) and 233 fourth graders (56.7 % were males, 52.8 % attending urban schools). Another sample of 742 students took part in the study of the TRC-e. They were also divided into three groups: 252 were second graders (46.6 % were male, 77.3 % attending rural schools), 222 third graders (50.7 % were males, 74.9 % attending rural schools) and 268 fourth graders (51.5 % were males, 76.1 % attending rural schools).
Materials
Each test form of the TRC-n comprised a booklet of texts and a worksheet with items. The booklet contained four narrative texts that were common to the three test forms, however, their length increased along with grade level: for the second graders the texts ranged from 138 to 289 words, for the third graders from 363 to 544 words and for the fourth graders the texts ranged from
495 to 915 words (Appendix B). All texts were original and authored by Portuguese writers of literature for chil-dren. The authors were asked to write texts that would be a complete and coherent text and also be part of the text presented in the following grade. Thus, the texts given to the second graders were part of the texts pre-sented to the third graders, which, in turn, were both contained in the texts presented to the fourth graders. This model enabled the construction of common items that were necessary to perform vertical scaling of the test forms. This was also the underlying reason for the need of multiple texts. For instance, in the second grade, each textper se was not sufficient to build an adequate number of items to accurately assess comprehension; however, the summation of multiple texts enabled such an assessment (see Appendix A and Appendix B).
Items were multiple-choice questions with three op-tions. They were developed to assess LC, IC, R or CC and underwent an analysis of the content by linguistics and reading comprehension experts. Each test form in-cluded unique items and items that were common be-tween the test forms for the adjacent grades (see “Initial pool of items”column in Table 1).
Test material in the TRC-e was similar to the material in the TRC-n, except for the fact that the booklets con-tained four original expository texts. The length of these texts increased along with grade level: for the second graders the texts ranged from 173 to 196 words, for the third graders from 351 to 502 words and for the fourth graders the texts ranged from 701 to 940 words. Each test form contained an increasing number of items in subsequent grades, including unique and common items (see“Initial pool of items”column in Table 1).
The syntactic complexity in the TRC-n and TRC-e texts also increased along with grade level, taking into account grammatical structures: simple or complex sentences, coordination or subordination, word order, and anaphoric chains. The specifications of the texts’ ex-tension and complexity followed the recommendations of the report prepared by Sim-Sim and Viana (2007), supported by the National Reading Plan (Ministry of Education and Science), and the guidelines of the cur-ricular benchmarks for Portuguese language, a reference document for teaching and learning and for internal and external evaluation (Buesco et al. 2015).
Design and procedures
different reading abilities. As mentioned, the test forms included a set of items that were common between forms for adjacent grades, and a set of items unique to each form. Common items were interspersed among the other items in each test form (Fig. 1). The values of the common items, also known as anchor items, are crucial to align the metrics from different test forms, in order to compare scores.
Students of the first sample completed the TRC-n-2, TRC-n-3 or TRC-n-4, and students of the second sample completed the TRC-e-2, TRC-e-3 or TRC-e-4, according to their grade. Tests were administered collectively, in the classroom, by trained psychologists. Legal authorization for data collection was solicited from the Portuguese Ministry of Education and school boards and informed consent for test administration was previously collected from students and their parents or legal guardians.
Data analyses
Data were analyzed using the Rasch measurement soft-ware Winsteps 3.72.0 (Linacre, 2011) and The Statistical Package for the Social Sciences 20.0 (IBM Corporation) was also used to compute statistics and evaluate between-grade differences in the scaled scores obtained on each form.
The psychometric properties of the items were ana-lyzed considering the following criteria: (1) adequacy of the difficulty of the items to the group being assessed; (2) fit of the data to the model; (3) association between the score in one item and the latent trait assessed; and (4) adequacy of the options in each item. Person (θ) and item parameters (bi) were computed and compared and a visual representation of these parameters was displayed in the form of person-item maps. This analysis allowed to detect items that were of inadequate difficulty (too easy or too difficult) for each grade for the latent trait assessment or if there was any region of the latent trait that was not measured by any item (Boone & Scantlebury, 2006). Two fit statistics were calculated for each per-son and each item to evaluate the degree of fit of the model to the data: (i) infit mean square statistic fo-cuses on unexpected responses near a person or item measure, and (ii) outfit mean square statistic places more emphasis on unexpected responses far from a person or item measure, being more sensitive to out-liers. Infit and outfit values should not be higher than 1.5 (Linacre, 2002). Point-measure correlations were computed for each item within each test form to evalu-ate the degree of association between the score in one item and the latent trait assessed by the test form. A mean ability value for persons who chose each option relative to each item was also calculated. For each item, the highest mean value is expected to be ob-served for the group of persons who select the correct answer option (Linacre, 2011).
Given that a nonequivalent groups with anchor test design was used, the item selection was performed at the same time that test forms were linked. The fixed item parameter method was used to link the test forms. This procedure calibrates each test form separately and sequentially. A test form is selected as the reference test and the measure values of the anchor items obtained by its calibration are used to perform the calibration of a
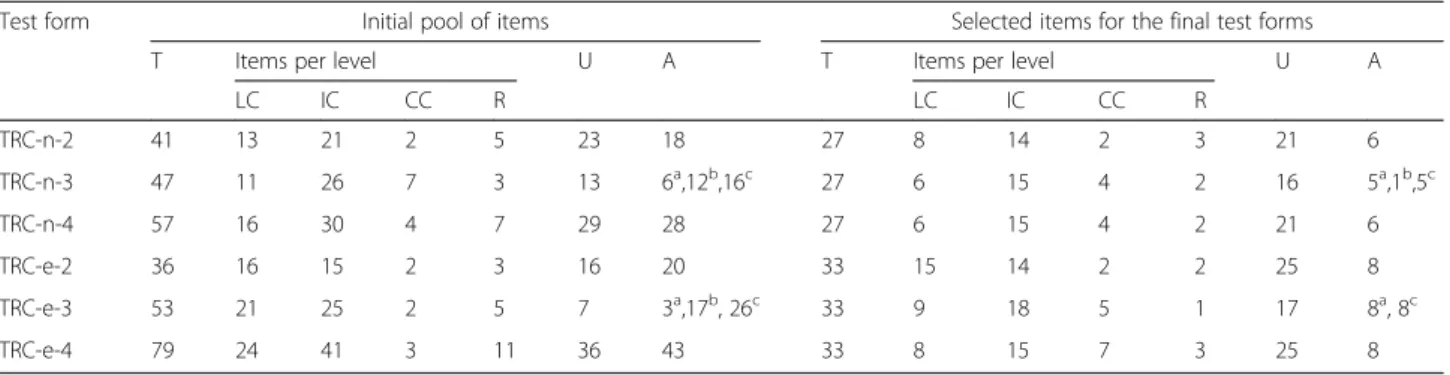
Table 1Items in each test form of the TRC-n and TRC-e
Test form Initial pool of items Selected items for the final test forms
T Items per level U A T Items per level U A
LC IC CC R LC IC CC R
TRC-n-2 41 13 21 2 5 23 18 27 8 14 2 3 21 6
TRC-n-3 47 11 26 7 3 13 6a,12b,16c 27 6 15 4 2 16 5a,1b,5c
TRC-n-4 57 16 30 4 7 29 28 27 6 15 4 2 21 6
TRC-e-2 36 16 15 2 3 16 20 33 15 14 2 2 25 8
TRC-e-3 53 21 25 2 5 7 3a,17b, 26c 33 9 18 5 1 17 8a, 8c
TRC-e-4 79 24 41 3 11 36 43 33 8 15 7 3 25 8
Note. Ttotal number of items,LCliteral comprehension,ICinferential comprehension,CCcritical comprehension,Rreorganization,Unumber of unique items,A number of anchor items
aThe number of common items shared by the second and third grade test forms bThe number of common items shared by the second, third and fourth grade test forms cThe number of common items shared by the third and fourth grade test forms
target test form (de Ayala, 2009). According to this pro-cedure, the values of the common items are fixed to the values obtained by the calibration of the reference test and are not re-estimated in the target test calibration, thus placing the target test form on the measurement scale of the reference test form (Kolen & Brennan, 2010). Anchor items that are used in test scaling or link-ing should ideally be distributed along the difficulty range of the test, be representative of the test content and of reasonably stable difficulty across test forms (Dorans et al. 2011; Huynh & Meyer, 2010). To evaluate the stability of the common items’ difficulty between adjacent grades, displacement measures should be esti-mated for each anchor item to check discrepancies be-tween the anchor value and the parameter that would have been estimated for the target test form if this par-ameter was unanchored (Linacre, 2011). The values of the anchor items’displacement should be less than 0.50 logits, but they can assume values as large as 1.0 logits without causing much impact on measurement, as mentioned by Linacre (2011).
In this study, the reference test forms were the TRC-n-2 and the TRC-e-2 to link the second and third grade forms of each test and the reference tests to link the third and fourth grade forms of each test were the TRC-n-3 and the TRC-e-3. The TRC-n forms were linked according to the following steps: (a) calibration of the TRC-n-2; (b) elimination from the TRC-n-2 of the items with inappropriate psychometric characteristics and re-estimation of the parameters in a new calibration; (c) calibration of the TRC-n-3 fixing the parameters of the common items in the values obtained in the last calibra-tion of the TRC-n-2; (d) eliminacalibra-tion from the TRC-n-3 of the items with inappropriate psychometric character-istics and re-estimation of the parameters in a new cali-bration; (e) analysis and selection of the anchor items to link the TRC-n-2 and the TRC-n-3 and reduction of the number of unique items in each test form considering the values obtained in the last calibration of each one. Unique items were selected according to three criteria: (a) the spread of difficulty–items that were distributed spread along the continuum of ability of each grade sample were selected; (b) redundancy – the number of items of similar difficulty levels was reduced by discard-ing some redundant items; and (c) the comprehension level that was assessed–the proportion of items of each type that was present in the initial pool of items was maintained in the final pool of items. When two or more items were of similar difficulty levels and they measured the same comprehension level, the item with a higher point-measure correlation was retained.
The same steps were adopted in the calibration and anchor item selection of the TRC-n-4. The whole process was replicated to link the TRC-e test forms.
A final set of calibrations was performed, using the fixed item parameter method, so that the test forms were again linked. Only the unique and anchor items se-lected in the previous phases were considered in this calibration. One-way analyses of variance (ANOVAs) and post hoc comparisons tested the between-grade dif-ferences in the scaled scores obtained on each form.
Unidimensionality and local independence of the items of the TRC-n and TRC-e final forms were tested. Unidi-mensionality assumes that the performance of one per-son in the observed variables is dependent of one specific single latent variable of the person (de Ayala, 2009). Local independence indicates that the perform-ance of one person on any item is determined solely by his or her level on the latent variable and does not de-pend on external variables (Bond & Fox, 2007). Unidi-mensionality of each TRC-n and TRC-e form was tested using principal component analysis (PCA) of the linear-ized Rasch residuals. This analysis enables the identifica-tion of clusters of residuals that share a large amount of common variance. These clusters are referred to as secondary dimensions, which should have at least the strength of two items to be considered a possible separ-ate dimension from the dimension tapped by the other items. Therefore, eigenvalues less than 2.0 for secondary dimensions support the unidimensionality assumption.
Correlations between the items’linearized Rasch resid-uals within each test form were computed to examine the requisite of local independence of the items. Residuals that are highly correlated indicate that performance on an item does not depend only on the individuals’ability level (θ), but may be “contaminated” by the response to another item. Correlations higher than .70 may indicate that items are locally dependent (Linacre, 2011).
Reliability of each final form of the TRC-n and TRC-e was examined by computing Rasch coefficients for the Person Separation Reliability (PSR) and Item Separation Reliability (ISR), and the Kuder-Richardson formula 20 (KR20). All three coefficients are expressed on a scale ranging from 0 to 1. High reliability coefficients indicate low levels of measurement error; therefore, values closest to 1 are desirable (Bond & Fox, 2007; de Ayala, 2009).
Results
The description of the results is organized by reading comprehension test.
grades. On the TRC-n-2, items RB2.7LC, RB2.8LC, RB2.12LC and AN2.1LC exhibited difficulty values lower than the minimum value for person ability (minimum = −1.16), meaning that they were very easy for second graders. Infit and outfit statistics for the items of the TRC-n-2 did not exceed the reference value of 1.5. Regarding the fit statistics for the person results in TRC-n-2, none of the students presented an infit value greater than 1.5 and only six sec-ond graders (2.6 % of the secsec-ond grade sample) obtained outfit values greater than 1.5. Point-measure correlations in the TRC-n-2 ranged from -.03 for item LB2.7Rto .52 for item RB2.10LC. Negative point-measure correlation coefficients were found for items RB3IC and LB2.7Ron the TRC-n-2. For these items and items LB2.5R, the highest mean ability value was not obtained by students who chose the correct answer option, suggesting that the students with greater reading comprehension abilities chose an incorrect alternative.
Items of inadequate difficulty, fit statistics greater than 1.5, negative point-measure correlations and/or prob-lems in the answer options (seven items) were removed from TRC-n-2 and the test form with 34 selected items was recalibrated. Table 2 shows the psychometric prop-erties of the items of the TRC-n-2. None of the items re-vealed inappropriate psychometric characteristics in this new analysis. Regarding the fit statistics for the person results in TRC-n-2, no changes were observed.
The TRC-n-3 initial pool of items was then linked to the TRC-n-2 (34 items). The calibration results show that item difficulty ranged from −1.31 to 2.67 and per-son ability ranged from−1.34 to 3.30. None of the items was identified as too easy or too difficult for the third grade. Infit statistics for the items of the TRC-n-3 did not exceed the reference value of 1.5 and only item AN12CC had outfit values higher than 1.50. Regarding the fit statistics for the person results, none of the stu-dents presented an infit value greater than 1.5; only two third graders (0.8 % of the third grade sample) obtained outfit values greater than 1.5. Point-measure correlations in the TRC-n-3 ranged from -.28 for item AN12CC to .55 for item TT8R. Negative point-measure correlation coefficients were found for items RB3ICand AN12CCon the TRC-n-3. For these items and items AN3.15IC and LB3.8R, the highest mean ability value was not ob-tained by the group of students who chose the correct answer option.
Items of inadequate difficulty for third graders, fit statis-tics greater than 1.5, negative point-measure correlations and/or problems in the answer options (four items) were removed from TRC-n-3 and the test form, with 43 items, was recalibrated and linked to the TRC-n-2 (34 items). Table 3 shows the psychometric properties of the TRC-n-3 items. All the items revealed adequate psychometric characteristics in this new analysis. Fit statistics for the
person results indicated that none of the students pre-sented an infit value greater than 1.5 and only three third graders (1.3 % of the third grade sample) obtained outfit values greater than 1.5. Based on this recalibration of the TRC-n-3, displacement estimates were analyzed to evalu-ate the stability of the common items’ difficulty between
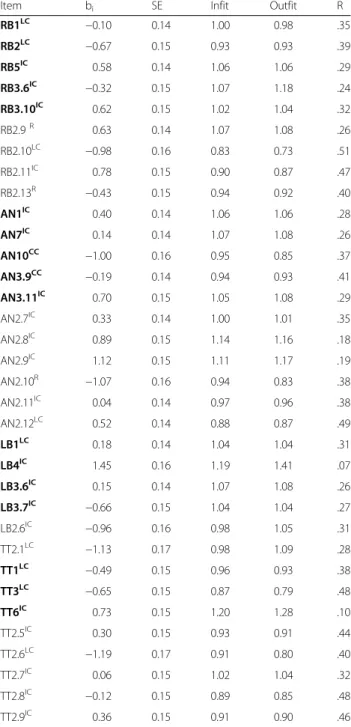
Table 2Psychometric properties of the items of the TRC-n-2 (34 items)
Item bi SE Infit Outfit R
RB1LC −0.10 0.14 1.00 0.98 .35
RB2LC −0.67 0.15 0.93 0.93 .39
RB5IC 0.58 0.14 1.06 1.06 .29
RB3.6IC −0.32 0.15 1.07 1.18 .24
RB3.10IC 0.62 0.15 1.02 1.04 .32
RB2.9R 0.63 0.14 1.07 1.08 .26
RB2.10LC −0.98 0.16 0.83 0.73 .51
RB2.11IC 0.78 0.15 0.90 0.87 .47
RB2.13R −0.43 0.15 0.94 0.92 .40
AN1IC 0.40 0.14 1.06 1.06 .28
AN7IC 0.14 0.14 1.07 1.08 .26
AN10CC
−1.00 0.16 0.95 0.85 .37
AN3.9CC
−0.19 0.14 0.94 0.93 .41
AN3.11IC 0.70 0.15 1.05 1.08 .29
AN2.7IC 0.33 0.14 1.00 1.01 .35
AN2.8IC 0.89 0.15 1.14 1.16 .18
AN2.9IC 1.12 0.15 1.11 1.17 .19
AN2.10R −1.07 0.16 0.94 0.83 .38
AN2.11IC 0.04 0.14 0.97 0.96 .38
AN2.12LC 0.52 0.14 0.88 0.87 .49
LB1LC 0.18 0.14 1.04 1.04 .31
LB4IC 1.45 0.16 1.19 1.41 .07
LB3.6IC 0.15 0.14 1.07 1.08 .26
LB3.7IC −0.66 0.15 1.04 1.04 .27
LB2.6IC −0.96 0.16 0.98 1.05 .31
TT2.1LC −1.13 0.17 0.98 1.09 .28
TT1LC −0.49 0.15 0.96 0.93 .38
TT3LC −0.65 0.15 0.87 0.79 .48
TT6IC 0.73 0.15 1.20 1.28 .10
TT2.5IC 0.30 0.15 0.93 0.91 .44
TT2.6LC
−1.19 0.17 0.91 0.80 .40
TT2.7IC 0.06 0.15 1.02 1.04 .32
TT2.8IC
−0.12 0.15 0.89 0.85 .48
TT2.9IC 0.36 0.15 0.91 0.90 .46
Note. biitem difficulty,SEstandard error. Items are identified by the text
the second and the third grade test forms. From the 17 common items between the TRC-n-2 and TRC-n-3, two items presented displacement values far from the refer-ence value of 0.5: AN10CC (−1.07) and LB3.6
IC
(−0.73). These items did not meet the criteria of maintaining rea-sonably stable difficulty across test forms so they were not suitable to work as anchor items between the TRC-n-2 and TRC-n-3. Displacement results of the remaining common items varied between −0.44, in the item AN1IC, and 0.58, in the item RB3.6IC (Table 3). After considering this analysis and evaluating the distribution of the remaining common items along the difficulty range of the test and the items’ representativeness of the test content, six items were selected to equate the TRC-n-2 and TRC-n-3 test forms: RB1LC, RB2LC, RB3.6IC, RB3.10IC, AN3.9CCand TT6IC.
After this procedure, new computer runs were per-formed to calibrate and link the TRC-n-4 initial pool of items to the TRC-n-3 with 43 items. Item analysis of the TRC-n-4 showed that item difficulty ranged from −1.00 to 3.25 and person ability ranged from −1.31 to 3.69. None of the items was identified as too easy or too diffi-cult for the fourth grade. Item AN16R exceeded the ref-erence value of 1.5 for infit. This item, along with items LB9R and LB10IC, had outfit values higher than 1.5. Re-garding the fit statistics for the person results in the TRC-n-4, none of the students presented an infit value greater than 1.5 and only nine fourth graders (3.9 % of the fourth grade sample) obtained outfit values greater than 1.5. Point-measure correlations in the TRC-n-4 ranged between -.12 for item AN12CC and .56 for item TT11LC. Negative point-measure correlation coefficients were found for items RB3IC, AN12CC and LB10IC. For these items and items LB2ICand LB9R, the highest mean ability value was not obtained by the group of students who chose the correct answer option.
Items of inadequate difficulty, fit statistics greater than 1.5, negative point-measure correlations and/or prob-lems in the answer options (six items) were removed from TRC-n-4 and this test form with 51 items was recalibrated and again linked to the TRC-n-3. Table 4 shows the psychometric properties of the items of the TRC-n-4. None of the items revealed inappropriate
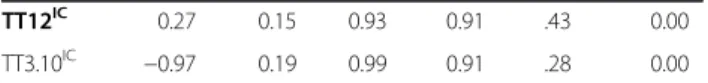
Table 3Psychometric properties of the items of the TRC-n-3 (43 items)
Item bi SE Infit Outfit r Displace
RB1LC −0.10A 0.15 0.92 0.83 .49 0.14
RB2LC −0.67A 0.17 1.14 1.33 .21 0.14
RB4IC 1.07 0.14 1.15 1.19 .20 0.00
RB5IC 0.58A 0.14 1.20 1.35 .15 0.19
RB3.6IC −0.32A 0.16 1.27 1.23 .37 0.58
RB3.7IC −1.26 0.21 0.95 0.79 .32 0.00
RB3.8IC −1.10 0.19 0.91 0.67 .40 0.00
RB3.9LC −1.35 0.21 0.97 0.77 .29 0.00
RB3.10IC 0.62A 0.14 1.03 1.05 .40 0.42
AN1IC 0.40A 0.14 0.80 0.73 .50 −0.44
AN6IC 1.86 0.15 1.16 1.26 .18 0.00
AN7IC 0.14A 0.15 0.86 0.78 .46
−0.15
AN9LC 0.48 0.14 0.96 0.93 .41 0.00
AN10CC
−1.00A 0.19 0.58 0.45 .19 −1.07
AN11IC 1.09 0.14 1.11 1.12 .25 0.00
AN16R 2.76 0.18 1.02 1.12 .28 0.00
AN3.9CC
−0.19A 0.16 1.26 1.29 .34 0.56
AN3.10IC 0.24 0.15 1.08 1.13 .25 0.00
AN3.11IC 0.70A 0.14 0.88 0.85 .49 −0.07
AN3.12IC 0.24 0.15 1.02 0.97 .34 0.00
AN3.13IC −0.54 0.17 1.05 1.07 .24 0.00
AN3.14IC 1.11 0.14 1.19 1.24 .16 0.00
AN3.16CC 0.40 0.14 1.18 1.25 .15 0.00
AN3.17IC 0.16 0.15 1.00 1.07 .33 0.00
LB1LC 0.18A 0.15 0.96 0.89 .39 −0.04
LB3CC −0.69 0.18 0.95 0.88 .35 0.00
LB4IC 1.45A 0.14 1.13 1.16 .32 −0.37
LB6IC 0.43 0.14 1.03 1.02 .34 0.00
LB3.5CC 1.50 0.14 1.06 1.05 .32 0.00
LB3.6IC 0.15A 0.15 0.79 0.73 .39
−0.73 LB3.7IC
−0.66A 0.17 1.26 1.40 .18 0.27
LB13IC 0.88 0.14 1.03 1.04 .34 0.00
LB15CC 0.99 0.14 1.13 1.18 .22 0.00
TT1LC
−0.49A 0.17 0.92 0.93 .40 0.04 TT3LC
−0.65A 0.17 0.69 0.51 .52 −0.25
TT6IC 0.73A 0.14 1.00 1.03 .38 0.14
TT7LC −0.14 0.15 0.94 0.85 .41 0.00
TT8R 0.55 0.14 0.83 0.77 .56 0.00
TT9LC −0.03 0.15 0.85 0.77 .51 0.00
TT10LC 0.04 0.15 0.93 0.88 .42 0.00
TT11LC 0.21 0.15 0.94 0.93 .42 0.00
Table 3Psychometric properties of the items of the TRC-n-3 (43 items)(Continued)
TT12IC 0.27 0.15 0.93 0.91 .43 0.00
TT3.10IC
−0.97 0.19 0.99 0.91 .28 0.00 Note. biitem difficulty,SEstandard error. Items are identified by the text to
which they are related (RBRita and Bruno,ANthe animals,LBlost bread,TT two twins almost alike), followed by a number. The comprehension level assessed by each item is presented in superscript (LCliteral comprehension, ICinferential comprehension,Rreorganization,CCcritical comprehension). Common items to the TRC-n-2 and TRC-n-4 appear in bold.A= Anchor item
psychometric characteristics in this new analysis. Fit sta-tistics for the person results improved since none of the students presented an infit value greater than 1.5 and only three fourth graders (1.3 % of the sample) obtaining outfit values greater than 1.5.
The following step was the analysis of the displace-ment values of the common items between the third and fourth grade test forms. From the remaining 25 common items, five items presented displacement values far from 0.5: RB1LC(−0.64), AN6
IC
(−0.78), AN9 LC
(0.69), AN10CC (−0.71) and G6
IC
(0.63). Therefore, these items were not acceptable for use to equate the TRC-n-3 and TRC-n-4. Displacements values of the other items ranged from to
−0.47, in AN1 IC
, to 0.38 in G7LC(see Table 4). Based on this analysis and on the remaining items’ difficulty and comprehension level, six items were selected to equate the TRC-n-3 and TRC-n-4 test forms: RB2LC, AN11IC, LB13IC, LB15CC, TT8Rand TT10LC.
After selecting the anchor items for each test form, unique items were selected to streamline the tests ac-cording to the criteria previously mentioned: the spread of difficulty, redundancy and the comprehension level that was assessed. When two or more items were of similar difficulty levels and they measured the same level of comprehension, the item with a higher point-measure correlation was retained. The number of items retained in each final version of the TRC-n forms is presented in Table 1 (“Selected items for the final test forms” column). The final test forms of the TRC-n were composed of 27 items each, six of which were anchor items between adjacent test forms (22.2 % of the total number of items).
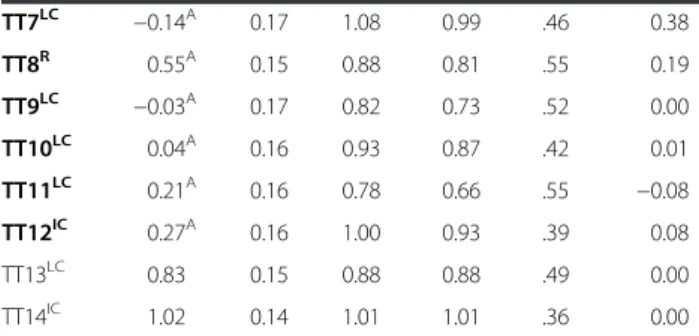
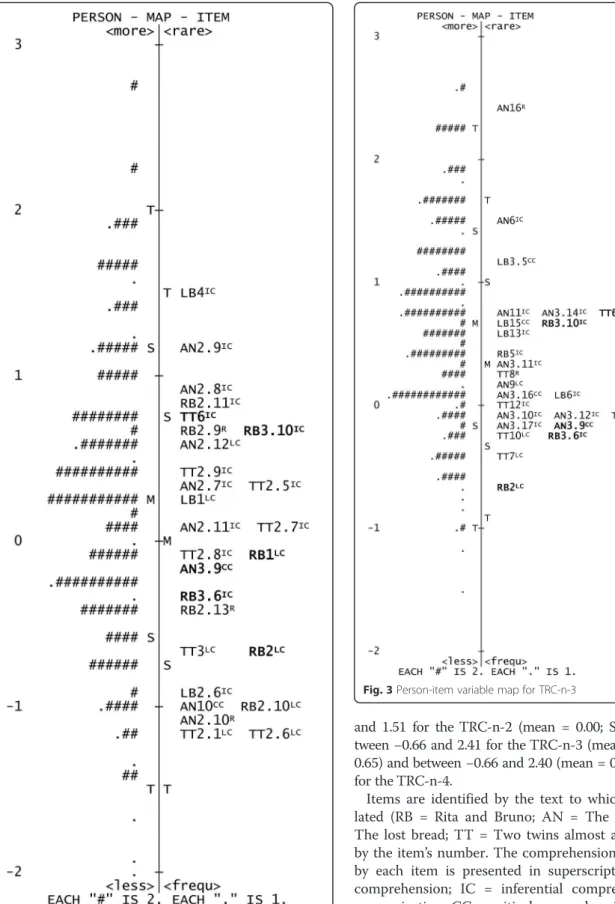
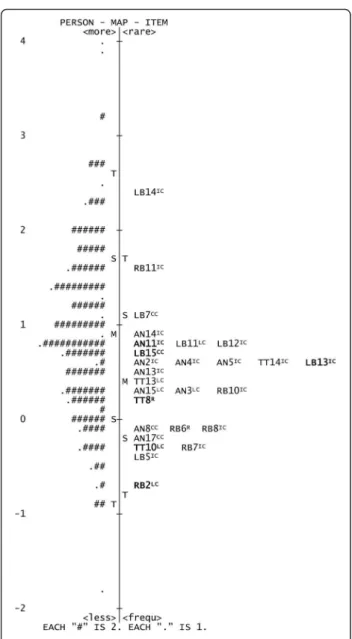
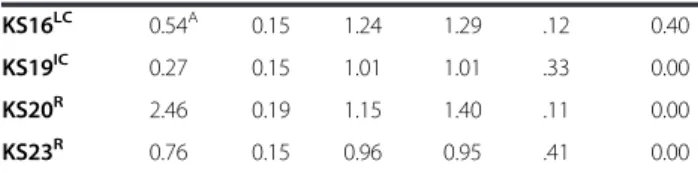
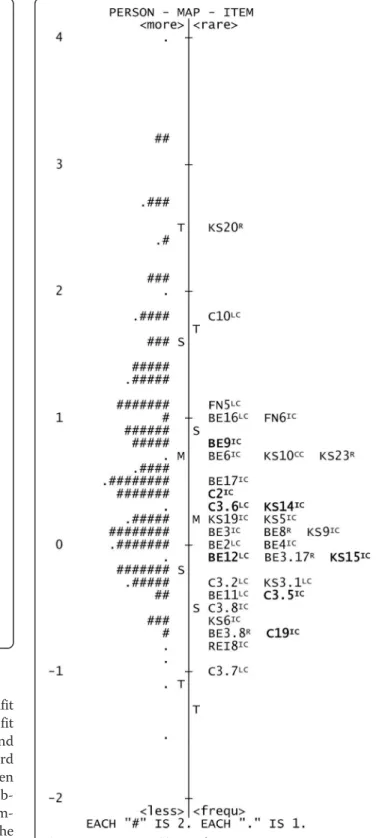
A new set of calibrations was performed to link the final forms of each test. The item parameter locations on the TRC-n vertical scale are presented in Figs. 2, 3 and 4. The difficulty of the items ranged between −1.19 Table 4Psychometric properties of the items of the TRC-n-4
(51 items)
Item bi SE Infit Outfit r Displace
RB1LC −0.10A 0.16 0.68 0.58 .39 −0.64
RB2LC −0.67A 0.19 1.25 1.18 .30 0.36
RB4IC 1.07A 0.14 1.08 1.09 .28 0.02
RB5IC 0.58A 0.15 1.11 1.14 .28 0.18
RB6R 0.27 0.15 0.93 0.95 .40 0.00
RB7IC 0.07 0.16 0.92 0.81 .43 0.00
RB8IC 0.32 0.15 1.01 0.97 .34 0.00
RB9IC 1.87 0.15 1.28 1.44 .04 0.00
RB10IC 0.72 0.15 1.13 1.18 .21 0.00
RB11IC 1.98 0.15 1.04 1.10 .31 0.00
AN1IC 0.40A 0.15 0.84 0.80 .37 −0.47
AN2IC 0.97 0.14 0.97 0.94 .40 0.00
AN3LC 0.71 0.15 1.00 0.96 .37 0.00
AN4IC 1.04 0.14 0.93 0.90 .44 0.00
AN5IC 0.99 0.14 0.91 0.87 .47 0.00
AN6IC 1.86A 0.15 1.32 1.39 .24
−0.78
AN7IC 0.14A 0.16 0.80 0.75 .41
−0.36
AN8CC 0.33 0.15 0.95 0.93 .40 0.00
AN9LC 0.48A 0.15 1.22 1.27 .37 0.69
AN10CC −1.00A 0.21 0.60 0.51 .26 −0.71
AN11IC 1.09A 0.14 1.14 1.14 .24 0.09
AN13IC 0.94 0.14 1.07 1.11 .28 0.00
AN14IC 1.31 0.14 1.07 1.07 .30 0.00
AN15LC 0.74 0.15 1.14 1.26 .19 0.00
AN17CC 0.19 0.16 1.06 1.18 .25 0.00
LB1LC 0.18A 0.16 0.98 1.01 .32 −0.06
LB3CC −0.69A 0.19 1.10 1.06 .35 0.24
LB4IC 1.45A 0.14 0.99 1.00 .41 −0.42
LB5IC −0.01 0.16 0.96 0.90 .38 0.00
LB6IC 0.43A 0.15 0.93 0.92 .35
−0.22
LB7CC 1.56 0.14 1.09 1.12 .27 0.00
LB8IC 1.19 0.14 0.99 0.98 .39 0.00
LB11LC 1.21 0.14 0.99 0.96 .39 0.00
LB12IC 1.26 0.14 1.11 1.11 .25 0.00
LB13IC 0.88A 0.14 1.04 1.01 .34 0.06
LB14IC 2.78 0.17 1.07 1.22 .23 0.00
LB15CC 0.99A 0.14 1.23 1.27 .14 0.17
TT1LC −0.49A 0.18 0.99 0.83 .45 0.20
TT2LC 1.24 0.14 1.18 1.25 .16 0.00
TT3LC −0.65A 0.19 0.71 0.51 .44 −0.29
TT4LC −0.90 0.21 0.93 0.70 .37 0.00
TT5IC −0.06 0.17 0.86 0.74 .48 0.00
TT6IC 0.73A 0.15 1.20 1.23 .31 0.63
Table 4Psychometric properties of the items of the TRC-n-4 (51 items)(Continued)
TT7LC
−0.14A 0.17 1.08 0.99 .46 0.38
TT8R 0.55A 0.15 0.88 0.81 .55 0.19
TT9LC
−0.03A 0.17 0.82 0.73 .52 0.00
TT10LC 0.04A 0.16 0.93 0.87 .42 0.01
TT11LC 0.21A 0.16 0.78 0.66 .55
−0.08
TT12IC 0.27A 0.16 1.00 0.93 .39 0.08
TT13LC 0.83 0.15 0.88 0.88 .49 0.00
TT14IC 1.02 0.14 1.01 1.01 .36 0.00
Note. biitem difficulty,SEstandard error. Items are identified by the text to
which they are related (RBRita and Bruno,ANthe animals,LBlost bread,TT Two twins almost alike), followed by a number. The comprehension level assessed by each item is presented in superscript (LCliteral comprehension,
ICinferential comprehension,Rreorganization,CCcritical comprehension). Common items to the TRC-n-3 appear in bold.A= Anchor item with a
and 1.51 for the TRC-n-2 (mean = 0.00; SD = 0.75), be-tween−0.66 and 2.41 for the TRC-n-3 (mean = 0.34; SD = 0.65) and between−0.66 and 2.40 (mean = 0.44; SD = 0.64) for the TRC-n-4.
Items are identified by the text to which they are re-lated (RB = Rita and Bruno; AN = The animals; LB = The lost bread; TT = Two twins almost alike), followed by the item’s number. The comprehension level assessed by each item is presented in superscript (LC = literal comprehension; IC = inferential comprehension; R = reorganization; CC = critical comprehension). Common items appear in bold (Figs. 2 and 3–common items be-tween grades 2 and 3; Fig. 4 – common items between grades 3 and 4).
Fig. 2Person-item variable map for TRC-n-2
None of the items yielded infit or outfit values that were greater than 1.5. After producing these final ver-sions of the test forms, the person fit statistics were al-tered: 11 s graders (4.8 % of the second grade sample), three third graders (1.3 % of the third grade sample) and two fourth graders (0.9 % of the fourth grade sample) obtained outfit values higher than 1.5. Compared to the percentage of misfit students in the calibration of the ini-tial pool of items, this calibration yielded increased per-centages of second and third grade misfit students and a decreased percentage of misfit fourth grade students.
This final set of items yielded item difficulty levels that were more appropriate to each sample group. The lowest item difficulty value was higher than the lowest person ability value for all three test forms (−1.92,−1.54, and −1.78 for second, third and fourth graders,
respectively). Additionally, the highest item difficulty value was lower than the highest person ability value (2.76, 2.59 and 3.91 for second, third, and fourth graders, respectively). Mean values of the person abil-ity scaled scores for the TRC-n were 0.26 (SD = .87) for the TRC-n-2, 0.65 (SD = .81) for the TRC-n-3 and 0.87 (SD = .87) for the TRC-n-4. As grades increased, person ability values were significantly greater, F(2, 690) = 33.019, p < .001. Bonferroni post-hoc tests yielded statistically significant differences (p< .05) be-tween the mean results of each grade.
Results of the PCA of the residuals of the TRC-n final test forms revealed that all the secondary dimensions had eigenvalues less than 2.0. The correlations of the re-siduals of the items ranged from zero to .27. Regarding the reliability of the TRC-n, the PSR and KR20 coeffi-cients were moderate (PSR: TRC-n-2 = .70, TRC-n-3 = .69, TRC-n-4 = .72; KR20: TRC-n-2 = .77, TRC-n-3 = .72, TRC-n-4 = .76) and the ISR coefficients were very high (TRC-n-2 = .96, TRC-n-3 = .95, TRC-n-4 = .94).
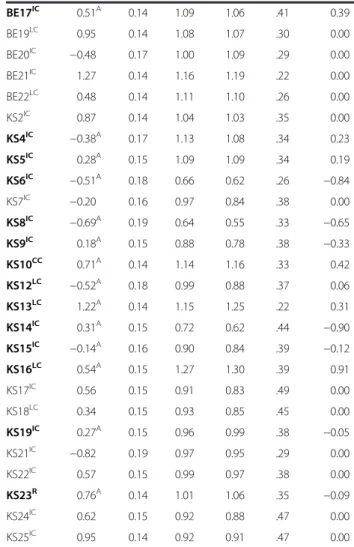
Test of reading comprehension of expository texts (TRC-e) On the TRC-e-2 initial pool of items, item difficulty ranged from−1.95 to 2.70 and person ability ranged from
−1.80 to 2.67. The minimum value for person ability exceeded the minimum value for item difficulty, indicating the presence of items excessively easy for this grade. This was the case of item FN1LC. The maximum item difficulty value was greater than the maximum person ability value since item KS20Rwas excessively difficult for the second graders. None of the items had an infit value greater than 1.5 and only item KS20Rhad an outfit value greater than 1.5. Regarding the fit statistics for the person results on the TRC-e forms, none of the students presented an infit value greater than 1.5 and only nine second graders (3.6 % of the sample), exhibited outfit values that exceeded the reference value. Point-measure correlations ranged from -.05 for item KS20Rto .48 for items C3.6LCand BE2.2IC. Item KS20Rwas the only item exhibiting a negative point-measure correlation coefficient. This item, along with item BE2.6IC, also presented problems with the quality of an-swer options, suggesting that the greatest mean ability value was not observed for the participants who chose the correct option for each of these items.
In the TRC-e-2, three items were removed as a result of the item analysis. The test form with 33 selected items was recalibrated. Table 5 shows the psychometric prop-erties of the items of the TRC-e-2. None of the items revealed inappropriate psychometric characteristics in this new analysis and, regarding the fit statistics for the person results, none of the students presented an outfit value that exceeded 1.5 and only one student (0.4 % of the sample) presented an outfit value above the reference value.
The TRC-e-3 initial pool of items was then linked to the TRC-e-2 (33 items). On the TRC-e-3, item difficulty ranged from −1.88 to 2.41 and person ability ranged from −0.98 to 3.56. The minimum values for person ability exceeded the minimum values for item difficulty, indicating that some items were excessively easy, namely
items FN1LC, FN2LC, FN7IC, BE1LC and KS3LC. The maximum item difficulty value was lower than the max-imum person ability value in the TRC-e-3, meaning that none of the items was excessively difficult for the third graders. None of the items had infit or outfit values greater than 1.5. Regarding the fit statistics for the per-son results, none of the students presented an infit value greater than 1.5 and only eight third graders (3.6 % of the sample) exhibited outfit values that exceeded the ref-erence value. Point-measure correlations ranged from -.15 for item C20LC to .52 for item C2IC. Item C20LC was the only item to present a negative point-measure correlation coefficient and the only one where the greatest mean ability value was not observed for the participants who chose the correct alternative.
From this test form, six items were removed as they presented inadequate difficulty for the third grade, nega-tive point-measure correlations and/or problems in the answer options. The test form with 47 items was recali-brated and linked to the TRC-e-2. Table 6 shows the psychometric properties of the items of the TRC-e-3. All the items revealed adequate psychometric characteristics in this new analysis. Fit statistics for the person results indicated that none of the students presented an infit value greater than 1.5 and only one (0.5 % of the sample) obtained outfit values greater than 1.5. Based on this re-calibration of the TRC-e-3, displacement estimates were analyzed to evaluate the stability of the common items’ difficulty between the second and the third grade test forms. From the 17 common items between the TRC-e-2 and TRC-e-3, seven items presented displacement values far from the reference value of 0.5: FN3.3CC (−0.66), C4
LC
(−0.80), BE14 IC
(−0.86), BE15 LC
(−0.60), KS11IC (1.00), KS12LC (−0.75) and KS13
LC
(−0.74). Therefore, these common items were not adequate to equate the second and third grade test forms. Displace-ment results of the remaining items varied between
−0.58, in the item BE13 LC
, and 0.40, in the item KS16IC (see Table 6). According to the items’ displacement values, difficulty and comprehension level, eight items were retained as anchor items on the TRC-e-2 and the TRC-e-3: C2IC, C3.5IC, C3.6LC, C19IC, BE9IC, BE12LC, KS14IC, and KS15IC.
New computer runs were then performed to calibrate and link the 4 initial pool of items to the TRC-e-3 with 47 items. On the TRC-e-4, item difficulty ranged from−1.69 to 2.46 and person ability ranged from−1.10 to 3.04. The minimum values for person ability exceeded the minimum values for item difficulty, indicating that some items were excessively easy, such as the following items: FN1LC, FN2LC, FN7IC, BE1LC, KS1R, KS3LC. The maximum item difficulty value was lower than the max-imum person ability value in the TRC-e-4, meaning that none of the items was excessively difficult for the fourth
Table 5Psychometric properties of the items of the TRC-e-2 (33 items)
Item bi SE Infit Outfit r
FN2LC −1.71 0.18 0.96 0.92 .30
FN3.3CC 0.22 0.14 1.00 0.98 .34
FN2.4LC −0.76 0.14 1.06 1.21 .21
FN2.5IC −0.24 0.14 1.09 1.20 .20
FN2.6IC 1.05 0.15 1.18 1.38 .07
C2.1LC −0.48 0.14 1.08 1.16 .20
C2.2LC −0.83 0.15 0.89 0.83 .45
C2IC 0.38 0.14 1.07 1.09 .24
C2.4IC −0.24 0.14 1.08 1.12 .22
C4LC −0.49 0.14 0.92 0.89 .42
C3.5IC −0.41 0.14 0.90 0.86 .45
C3.6LC 0.26 0.14 0.89 0.86 .48
C19IC
−0.67 0.14 0.91 0.88 .42
BE2.1R
−0.42 0.14 0.92 0.88 .43
BE2.2IC
−1.07 0.15 0.86 0.76 .47
BE2.3LC 0.24 0.13 0.92 0.90 .44
BE2.4CC 0.85 0.14 0.99 1.01 .33
BE2.5LC 0.60 0.14 1.10 1.13 .20
BE2.7R 1.02 0.14 1.16 1.29 .09
BE7IC 0.31 0.14 0.97 0.96 .38
BE9IC 0.77 0.14 1.12 1.14 .18
BE12LC −0.15 0.14 0.91 0.88 .44
BE13LC −0.04 0.14 0.96 0.96 .38
BE14IC 0.49 0.14 1.05 1.06 .27
BE15LC −0.08 0.14 0.98 0.95 .36
KS11IC 0.14 0.13 1.08 1.07 .24
KS12LC −0.52 0.14 0.92 0.87 .42
KS13LC 1.22 0.15 0.95 0.95 .37
KS14IC 0.31 0.14 0.95 0.93 .40
KS15IC
−0.14 0.14 0.99 0.99 .34
KS16LC 0.54 0.14 1.19 1.19 .10
KS18LC
−0.05 0.14 0.89 0.86 .47
KS2.9IC
−0.08 0.14 1.00 1.01 .33
Note. biitem difficulty,SEstandard error. Items are identified by the text to
graders. Only item KS11IC presented an infit value greater than 1.5. This item and item BE18R exhibited outfit values greater than 1.5. Regarding the fit statistics for the person results on the TRC-e forms, none of the students presented an infit value greater than 1.5 and only seven fourth graders (2.6 % of the sample) exhibited outfit values that exceeded the reference value. Point-measure correlations in the TRC-e-4 ranged between -.21 for item KS20R and .51 for item BE13LC. Negative point-measure correlation coefficients were obtained for items BE18R and KS20R. These items plus item FN11R presented problems with the quality of answer options.
This item analysis resulted in the exclusion of 10 items from the TRC-e-4 due to their inadequate psychometric characteristics. The TRC-e-4 test form with 69 items was recalibrated and again linked to the TRC-e-3. Table 7 shows the psychometric properties of the items of the TRC-e-4. None of the items revealed inappropriate psychometric characteristics in this new analysis. Item FN12CC was the only item to exhibit an outfit value higher than 1.5 (1.53). Fit statistics for the person results improved with none of the students presenting an infit value greater than 1.5 and only one fourth grader (0.4 % of the sample) obtaining outfit values greater than 1.5. The analysis of the displacement values of the 34 com-mon items between the third and fourth grade test forms evidenced that seven items presented displace-ment values higher than 0.5: C2IC (−0.64), BE12
LC
(0.84), BE14IC (−0.87), KS6 IC
(−0.83), KS8 IC
(−0.64), KS14IC (−0.89) and KS16
LC
(0.93). These items, there-fore, were not suitable to be used as anchor items. Dis-placements values of the remaining items ranged from to −0.38, in C10
LC
, to 0.40 in BE17IC (Table 7). From these items, eight were retained as anchor items in the final versions of the TRC-e-3 and the TRC-e-4, accord-ing to their difficulty and the comprehension level assessed by these questions: FN5LC, BE8R, BE11LC, BE16LC, BE17IC, KS5IC, KS10CCand KS23R.
After selecting the anchor items for each TRC-e form, unique items’selection was performed to streamline the tests according to the difficulty of the items, their
Table 6Psychometric properties of the items of the TRC-e-3 (47 items)
Item bi SE Infit Outfit R Displace
FN3.3CC 0.22A 0.15 0.87 0.80 .38 −0.66
FN3IC 1.03 0.15 1.20 1.25 .14 0.00
FN4IC −0.69 0.17 0.89 0.72 .43 0.00
FN5LC 1.08 0.15 1.16 1.22 .18 0.00
FN6IC 0.99 0.15 1.08 1.09 .28 0.00
C2IC 0.38A 0.15 0.83 0.78 .52 −0.25
C3.2LC −0.26 0.15 1.02 1.03 .28 0.00
C3.3IC −0.65 0.17 1.08 1.41 .12 0.00
C4LC −0.49A 0.16 0.64 0.54 .39 −0.80
C3.5IC −0.41A 0.16 0.88 0.75 .43 −0.06
C3.6LC 0.26A 0.15 0.98 0.93 .42 0.17
C3.7LC
−0.97 0.18 0.97 0.83 .31 0.00
C3.8IC
−0.40 0.16 0.91 0.84 .41 0.00
C10LC 1.82 0.16 1.11 1.12 .24 0.00
C19IC
−0.67A 0.17 0.90 0.84 .38 −0.05
BE2LC 0.01 0.15 0.98 0.98 .35 0.00
BE3IC 0.16 0.15 0.97 0.92 .38 0.00
BE4IC 0.06 0.15 0.99 0.99 .34 0.00
BE5IC −0.49 0.16 1.12 1.23 .14 0.00
BE6IC 0.74 0.15 1.07 1.07 .29 0.00
BE8R 0.12 0.15 0.97 0.92 .38 0.00
BE3.8R −0.63 0.17 0.90 0.75 .42 0.00
BE9IC 0.77A 0.15 1.04 1.03 .32 0.17
BE11LC −0.36 0.16 1.04 0.99 .27 0.00
BE12LC −0.15A 0.15 0.97 0.88 .49 0.30
BE13LC −0.04A 0.15 0.77 0.68 .44 −0.58
BE14IC 0.49A 0.15 0.91 0.87 .40 −0.86
BE15LC −0.08A 0.15 0.70 0.61 .51 −0.60
BE16LC 1.01 0.15 0.99 0.99 .38 0.00
BE17IC 0.51 0.15 1.03 0.99 .33 0.00
BE3.17R
−0.04 0.15 1.08 1.17 .21 0.00
KS3.1LC
−0.24 0.16 1.05 1.07 .24 0.00 KS4IC
−0.38 0.16 0.98 0.95 .32 0.00
KS5IC 0.28 0.15 1.06 1.06 .28 0.00
KS6IC
−0.51 0.16 1.00 1.01 .29 0.00
KS8IC −0.69 0.17 0.96 0.88 .34 0.00
KS9IC 0.18 0.15 0.87 0.82 .49 0.00
KS10CC 0.71 0.15 0.92 0.90 .45 0.00
KS11IC 0.14A 0.15 1.21 1.27 .40 1.00
KS12LC −0.52A 0.16 1.38 1.35 .35 0.75
KS13LC 1.22A 0.15 1.01 1.04 .21 0.74
KS14IC 0.31A 0.15 0.99 1.00 .33 −0.09
KS15IC −0.14A 0.15 0.98 0.91 .40 0.11
Table 6Psychometric properties of the items of the TRC-e-3 (47 items)(Continued)
KS16LC 0.54A 0.15 1.24 1.29 .12 0.40
KS19IC 0.27 0.15 1.01 1.01 .33 0.00
KS20R 2.46 0.19 1.15 1.40 .11 0.00
KS23R 0.76 0.15 0.96 0.95 .41 0.00
Note. biitem difficulty,SEstandard error. Items are identified by the text to
which they are related (FN fireflies’night,Cthe caravels,BEobserving birds in the estuary,KSthe king Sebastian), followed by a number. The comprehension level assessed by each item is presented in superscript (LCliteral comprehension, ICinferential comprehension,Rreorganization,CCcritical comprehension). Common items to the TRC-e-2 and TRC-e-4 appear in bold.A= Anchor item
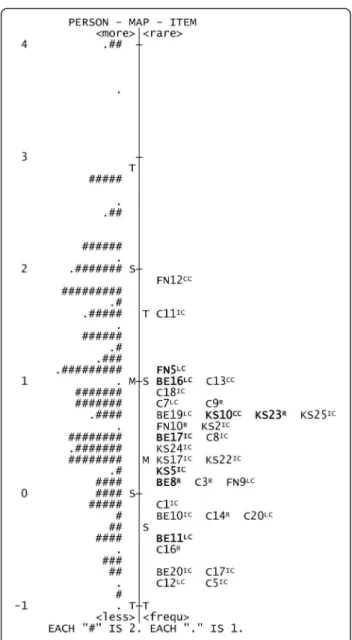
redundancy and their comprehension level. The higher point-measure correlation criterion was considered when two or more items were of similar difficulty levels and they measured the same level of comprehension. The number of items retained in each final version of the TRC-e forms is presented in Table 1 (column “ Se-lected items for the final test forms”). Each final version of the TRC-e was composed of 33 items, eight of which were anchor items (24.2 % of the total number of items). The item parameter locations on the TRC-e vertical scale are presented in Figs. 5, 6 and 7. Regarding TRC-e, items’ difficulty values ranged between −1.71 and 1.22 for the TRC-e-2 (mean = 0.00; SD = 0.64), between
−1.04 and 2.47 for the TRC-e-3 (mean = 0.19; SD = 0.73) and between −0.81 and 1.86 (mean = 0.33; SD = Table 7Psychometric properties of the items of the TRC-e-4
(69 items)
Item bi SE Infit Outfit r Displace
FN3IC 1.03A 0.14 1.13 1.21 .25 0.09
FN4IC −0.69A 0.18 0.83 0.70 .37 −0.20
FN5LC 1.08A 0.14 1.22 1.27 .17 0.14
FN6IC 0.99A 0.14 1.13 1.12 .27 0.02
FN8LC −0.74 0.18 0.88 0.69 .44 0.00
FN9LC 0.34 0.14 0.96 0.94 .41 0.00
FN10R 0.84 0.14 1.01 0.99 .38 0.00
FN12CC 2.05 0.14 1.31 1.53 .03 0.00
C1IC 0.16 0.15 1.01 0.98 .35 0.00
C2IC 0.38A 0.14 0.80 0.75 .42 −0.65
C3R 0.37 0.14 0.98 0.94 .40 0.00
C4LC
−0.49A 0.17 0.94 0.81 .43 0.08
C5IC
−0.58 0.17 0.85 0.62 .49 0.00
C6IC
−0.83 0.18 0.97 1.03 .29 0.00
C7LC 1.05 0.13 1.00 1.02 .39 0.00
C8IC 0.68 0.14 1.09 1.09 .29 0.00
C9R 0.99 0.14 0.99 0.99 .40 0.00
C10LC 1.82A 0.14 1.32 1.43 .15 −0.39
C11IC 1.76 0.14 1.15 1.23 .22 0.00
C12LC −0.57 0.17 0.99 0.96 .31 0.00
C13CC 1.17 0.14 1.02 1.04 .36 0.00
C14R 0.03 0.15 1.00 1.01 .34 0.00
C15IC 0.55 0.14 1.02 1.03 .35 0.00
C16R −0.31 0.16 0.86 0.79 .47 0.00
C17IC −0.51 0.17 0.89 0.81 .42 0.00
C18IC 1.15 0.13 0.98 0.97 .42 0.00
C19IC −0.67A 0.18 0.74 0.69 .42 −0.25
C20LC 0.03 0.15 0.95 0.88 .41 0.00
BE2LC 0.01A 0.15 0.91 0.84 .46 0.03
BE3IC 0.16A 0.15 1.00 0.97 .41 0.14
BE4IC 0.06A 0.15 0.93 0.86 .35
−0.18 BE5IC
−0.49A 0.17 0.99 1.01 .31 0.01
BE6IC 0.74A 0.14 1.07 1.08 .35 0.22
BE7IC 0.56 0.14 1.03 0.99 .35 0.00
BE8R 0.12A 0.15 1.06 1.05 .38 0.20
BE9IC 0.77A 0.14 1.04 1.06 .40 0.35
BE10IC 0.07 0.15 0.89 0.79 .48 0.00
BE11LC −0.36A 0.16 1.09 1.05 .31 0.14
BE12LC −0.15A 0.16 1.32 1.34 .50 0.83
BE13LC −0.04A 0.15 0.73 0.65 .50 −0.29
BE14IC 0.49A 0.14 0.75 0.67 .46 −0.88
BE15LC −0.08A 0.15 0.85 0.85 .34 −0.34
BE16LC 1.01A 0.14 0.96 0.96 .43 0.07
Table 7Psychometric properties of the items of the TRC-e-4 (69 items)(Continued)
BE17IC 0.51A 0.14 1.09 1.06 .41 0.39
BE19LC 0.95 0.14 1.08 1.07 .30 0.00
BE20IC
−0.48 0.17 1.00 1.09 .29 0.00
BE21IC 1.27 0.14 1.16 1.19 .22 0.00
BE22LC 0.48 0.14 1.11 1.10 .26 0.00
KS2IC 0.87 0.14 1.04 1.03 .35 0.00
KS4IC
−0.38A 0.17 1.13 1.08 .34 0.23
KS5IC 0.28A 0.15 1.09 1.09 .34 0.19
KS6IC
−0.51A 0.18 0.66 0.62 .26 −0.84
KS7IC
−0.20 0.16 0.97 0.84 .38 0.00 KS8IC
−0.69A 0.19 0.64 0.55 .33 −0.65
KS9IC 0.18A 0.15 0.88 0.78 .38
−0.33
KS10CC 0.71A 0.14 1.14 1.16 .33 0.42
KS12LC −0.52A 0.18 0.99 0.88 .37 0.06
KS13LC 1.22A 0.14 1.15 1.25 .22 0.31
KS14IC 0.31A 0.15 0.72 0.62 .44 −0.90
KS15IC −0.14A 0.16 0.90 0.84 .39 −0.12
KS16LC 0.54A 0.15 1.27 1.30 .39 0.91
KS17IC 0.56 0.15 0.91 0.83 .49 0.00
KS18LC 0.34 0.15 0.93 0.85 .45 0.00
KS19IC 0.27A 0.15 0.96 0.99 .38
−0.05
KS21IC
−0.82 0.19 0.97 0.95 .29 0.00
KS22IC 0.57 0.15 0.99 0.97 .38 0.00
KS23R 0.76A 0.14 1.01 1.06 .35
−0.09
KS24IC 0.62 0.15 0.92 0.88 .47 0.00
KS25IC 0.95 0.14 0.92 0.91 .47 0.00
Note. biitem difficulty,SEstandard error. Items are identified by the text to
0.65) for the TRC-e-4. None of the items presented infit or outfit values greater than 1.5. Regarding person fit statistics for the final TRC-e test forms, one second grader (0.4 % of the second grade sample), eight third graders (3.6 % of the third grade sample) and seven fourth graders (2.6 % of the fourth grade sample) ob-tained outfit values that were greater than 1.5. Com-pared to the percentage of misfit students in the calibration of the initial pool of items, the percentage of misfit students decreased in the second and fourth grade groups and increased only slightly (one student) in the third grade after linking.
Items are identified by the text to which they are related (FN = Fireflies’Night; C = The Caravels; BE = Observing Birds in the Estuary; KS = The King D. Sebastian),
followed by the item’s number. The comprehension level assessed by each item is presented in superscript (LC = lit-eral comprehension; IC = inferential comprehension; R = reorganization; CC = critical comprehension). Common items appear in bold (Figs. 2 and 3 – common items Fig. 5Person-item variable map for TRC-e-2
between grades 2 and 3; Fig. 4–common items between grades 3 and 4).
Item difficulty of the TRC-e test forms was now more appropriate for each target grade, given that none of the items was located outside of the range of each group’s ability (−2.47 to 2.91 for the second graders, −1.46 to 3.96 for the third graders and −1.01 to 4.00 for the fourth graders). Mean values of the person ability scaled scores for the e were 0.13 (SD = .77) for the TRC-e-2, 0.70 (SD = .92) for the TRC-e-3 and 0.98 (SD = .98) for the TRC-e-4. As grades increased, person ability values were significantly greater, F (2, 724) = 42.060, p < .001. Bonferroni post-hoc tests revealed significant differences (p < .05) between the scaled scores obtained on the three TRC-e test forms.
Results of the PCA of the residuals of the TRC-e final test forms revealed that all the secondary dimensions had eigenvalues less than 2.0. The correlations of the test items’residuals ranged from zero to .24. In terms of the re-liability of the TRC-e, the PSR coefficients were also mod-erate (TRC-e-2 = .72, TRC-e-3 = .77, TRC-e-4 = .78), the KR20 values were moderate to high (e-2 = .75, TRC-e-3 = .81, TRC-e-4 = .85) and the ISR coefficients were very high (TRC-e-2 = .95, TRC-e-3 = .95, TRC-e-4 = .95).
Discussion
This study examined the construction of two original reading comprehension tests for Portuguese students en-rolled in second through fourth grade of the elementary school–the TRC-n and the TRC-e through the applica-tion of the Rasch model analyses. The development of these tests took into consideration theoretical and methodological guidelines concerning: (a) differences in performance when reading narrative or expository texts; (b) the demands of reading comprehension tasks with regard to the comprehension levels; and (c) the need of instruments that enable monitoring of inter-and intra-individual changes in reading comprehension over elementary school grades.
Test items were studied via Rasch model analyses. This allowed items to be selected for each test form ac-cording to the following criteria: (a) the difficulty of the items and persons’ability; (b) the results of infit and out-fit mean square out-fit statistics; (c) point-measure correl-ation coefficients between each item and the total score; and (d) the mean ability value for persons who chose each option relative to each item.
with high outfit values and with negative point-measure correlations were removed from the test forms where they did not work well.
The analysis of the mean ability value for persons who chose each option relative to each item confirmed the presence of unexpected responses in some items, where lower ability persons succeeded in responding to higher item difficulty items and higher ability level persons failed to answer to lower item difficulty questions. These misfit responses are those which do not fit the Rasch model and that may be related with guessability or mistake-ability (Linacre, 2011). The items under this condition were also removed from the respective test forms. Anchor items were selected to incorporate into each test form of the TRC-n and the TRC-e, following the recommended selection guidelines (Dorans et al., 2011; Huynh & Meyer, 2010). These items comprised approximately 20 % of the total items across adjacent test forms and were distributed across all ability levels. Anchor items assessed the four reading com-prehension levels and were invariant across adjacent test forms. After anchor items were selected, unique items for each test form were chosen by considering the spread of their difficulty in each grade, similar difficulty levels between items and the comprehension level each item assessed. Final test forms of the TRC-n were each composed of 27 items, six of which were anchor items between adjacent forms. Each of the final test forms of the TRC-e included 33 items, eight of which were anchor items.
After the selection of the items, the quality of the test forms of the TRC-n and the TRC-e was improved as the difficulty of the items became lined up with the persons and none of the items presented misfit values (Baghaei, 2008; Linacre, 2011). Recalibrations of the final test forms resulted in a pool of items with difficulty levels that were more appropriate for each grade. The difficulty of each TRC-n and TRC-e form increased with more advanced grades, as expected of an instrument that measures a construct that changes over the course of learning (Hardy et al., 2011; Kolen & Brennan, 2014). Bonferroni post-hoc test results revealed that each test form of the TRC-n and the TRC-e was able to ad-equately discriminate the performance of students en-rolled in different school grades.
The analysis of the PCA of residuals was calculated for each form of the TRC-n and TRC-e. The results support the unidimensionality of each test form showing that the common variance among item responses is explained by a single latent trait. Correlations between the items’ residuals confirm the items’ local independence and corroborate the unidimensionality of the test forms. All test forms presented adequate reliability coefficients (Linacre, 2011).
Further studies should focus on the collection of criterion-related validity evidence as well as predictive validity evidence to support the utility of these instru-ments in educational contexts. Future research is also suggested to create new reading comprehension tests that allow for comparison of student’s performance in narrative and expository texts, by using the same re-search sample so that narrative and expository test forms for each grade can be vertically scaled with each other. Future research should also focus on identifying which test (the TRC-n or the TRC-e) is the best predictor of performance in various academic subjects, such as the natural sciences, history and mathematics, as reading comprehension is a critical competency that at least partially explains difficulties in native language and academic subjects that require reading texts.
Conclusion
The goal of this study was to provide an application of the Rasch model analyses in the construction of two reading comprehension tests with vertically scaled test forms. Rasch model analyses were essential to create these reading comprehension measures that make it possible to assess large student samples and compare performances from second to fourth grade. Through the Rasch model analyses, in conjunction with the analysis of the items’ content, it was possible to select to each test a set of items with good psychometric characteris-tics. The reduction of items in each test according to the Rasch model criteria enabled the development of reading comprehension tests that are time saving for teachers and researchers, without compromising the assessment of the latent trait.
The TRC-n and TRC-e present themselves as innova-tive reading comprehension measures, useful not only for longitudinal reading comprehension assessment throughout elementary school, but also for providing dif-ferentiated results regarding comprehension perform-ance when narrative or expository texts are used, two aspects that are not often considered in test construc-tion. In addition, the increasing extension of the texts in-cluded in the TRC-n and TRC-e makes them closer to the ones that students have to manage in school and other social contexts where text comprehension is mandatory.
describing learning patterns or trajectories throughout the elementary school using percentile scores. In addition, these test forms will enable the assessment of the effects of intervention programs and help direct formal instruction to students’needs, and thus improve teacher effectiveness.
Appendix A
“Two twins almost alike” –text of the TRC-n for second graders
Rodrigo and Frederico are two twins almost alike. They are both skinny and tall like towers. Both have red hair, very curly and, since they found out they have myopia, both wear glasses.
The twins are always dressed alike. Every day they insist on getting to school with the same pants and sweater and even a pair of trainers with the same color. Only the most attentive are able to notice that Frederico’s trainers are always a little more worn out and dirty than his brother’s.
Occasionally, Rodrigo and Frederico try to fool their friends and trick them, pretending to be the other one. However, their friends are rarely fooled
because, although they are just alike on the outside, the twins are very different in everything else:
Rodrigo is shy and Frederico is talkative; one likes football, the other loves books; one has a great sense of humor, the other is a very serious person.
Note: The bold italic text parts are common to the third grade text.
“Two twins almost alike” –text of the TRC-n for third graders
Rodrigo and Frederico are two twins almost alike. They are both skinny, talland a little clumsy,both have very curly red hair. Since last year, after they went to the op-tician, they both wear glasses because they found out they have myopia.
Both love to try to fool their friends and trick them, pretending to be the other one. However,
their friends are rarely fooled because they know
them like the back of their hands and they know that, for example, Rodrigo is shy and Frederico is more brazen, Rodrigo prefers to read books and play on his computer and Frederico is more into riding his bike or playing football.
Although they dress alike and have the same hairstyle, the twins are rarely doing the same things. Except when they decide to play tricks, and on those days, it is possible to see Frederico reading a book and Rodrigo playing football!
However, as you can imagine, these switches are always noticed: Frederico is actually trying to read a book but, distracted, he forgets to turn the page and
stays there, half an hour if need be, just looking at the same paragraph, probably thinking about the football game he is missing…
His friends ask him:
– Rodrigo, we are ten pages ahead…What are you
thinking about?
And, in that moment, Rodrigo, who is not really Rodrigo but Frederico, still tries to disguise, but then he starts giggling…
His friends look at each other and say:
– Frederico, that’s you! We thought so…We were
already suspicious…
When Rodrigo plays the ball, he doesn’t go unnoticed, trying to run, dribble, shoot … and almost always fails all these attempts. Moreover, Frederico is a great player, one of the school’s best and it’s hard to live up to. So after some time of awkwardness, his friends also ask him:
– Frederico, what’s the matter with you today? Are
you injured or what?
And then a more insightful friend adds:
– Or are you Rodrigo? It seems so…
Notes: The bold italic text parts are common to the second grade text.
Appendix B
Table 8Reading comprehension items
School grade Unique items Anchor item
Second grade 1. Why are Frederico’s trainers more worn out and dirty than his brother’s? a. Maybe because he is less
careful than his brother. b. Maybe because his trainers
are of poorer quality. c. Maybe because he plays
more football.
1. Of the two brothers, Rodrigo is the most… a. distracted.
b. shy. c. fearful.
Third grade 2. Their friends almost always find out when they switch identities because… a. They cannot stand too long
without saying who they are. b. When they talk they have a
different voice. c. They cannot keep up the