FIELD EVALUATION OF WATER OR CITRATE SOLUBLE
PHOSPHORUS IN MODIFIED PHOSPHATE ROCKS FOR SOYBEAN
Luís Ignácio Prochnow1*; José Francisco da Cunha2; Ariel Francisco Candiotti Ventimiglia3
1
Depto. de Solos e Nutrição de Plantas - USP/ESALQ - C.P. 9 - CEP: 13418-900 - Piracicaba, SP. 2
Tecfértil, Av. Eliseu de Almeida, 1527 - CEP: 05533-000 - São Paulo, SP. 3
Galvani Fertilizantes da Bahia, Rod. Br 020 Km 526 - CEP: 47800-974 - Barreiras, BA. *Corresponding author <[email protected]>
ABSTRACT: Ten P fertilizers were collected (commercial fertilizers) or synthesized (experimental sources) in order to obtain single superphosphates varying in water and citrate solubility. A standard source of P was also produced by crystallization of the water-soluble fraction of a triple superphosphate. Eleven P sources were band applied to a medium textured Xanthic Hapludox, in Bahia, Brazil (low content of resin-extractable P) at a rate of 80 kg ha-1 of NAC + H2O (neutral ammonium citrate plus water) soluble P2O5, with soybean as the crop which was grown to maturity. A check plot (control) was included in the study. Three of the P sources [single superphosphate produced from Araxa phosphate rock (PR), low-grade single superphosphate produced from Lagamar PR and the standard source of P] were also applied at rates to provide 40 and 120 kg ha-1 of NAC +
H2O soluble P2O5. Yield of soybean was evaluated by analysis of variance with mean comparison performed utilizing LSD lines, considering the P sources applied at a rate of 80 kg ha-1 of P2O5 + control. Regression procedures were used to study the relation between yield of soybean and rates of P2O5. The fertilizers tested performed equally well as a source of P for soybean. The level of water-soluble P did not influence fertilizer performance.
Key words: acidulated phosphates, available P, phosphorus sources, water-insoluble P
AVALIAÇÃO AGRONÔMICA DO FÓSFORO SOLÚVEL
EM ÁGUA OU CITRATO DE FOSFATOS DE ROCHA
ACIDULADOS PARA A SOJA
RESUMO: Dez fontes de P foram coletadas em unidades revendedoras de fertilizantes comerciais ou produzidas em laboratório de tal forma a obter superfosfatos simples com variabilidade em água e citrato neutro de amônio + água (CNA + H2O). Utilizou-se como fonte padrão de fósforo a fração solubilizada, filtrada e cristalizada de um superfosfato triplo. As onze fontes de P foram aplicadas nas linhas de semeadura de soja de um Xanthic Hapludox textura média, localizado no Município de Barreiras, Bahia (baixo teor de fósforo resina) na dose de 80 kg ha-1 de P
2O5 solúvel em CNA + H2O. Três das fontes (superfosfatos simples produzido a partir da rocha
fosfática de Araxá e Lagamar e a fonte padrão) foram aplicadas também em doses de 40 e 120 kg ha-1 e uma
parcela testemunha, sem P, adicionada ao experimento. A produtividade da soja foi avaliada por meio de análise de variância e comparação de médias, considerando-se as fontes de P aplicadas na dose de 80 kg ha-1 P2O5 + parcela testemunha. Regressões foram utilizadas para estudar a relação entre a produtividade de soja e as doses de P2O5. Os fertilizantes tiveram igual comportamento como fonte de P às plantas de soja. O teor de P2O5 solúvel em água não influenciou o comportamento dos fertilizantes.
Palavras-chave: fosfatos acidulados, P disponível, fontes de fósforo, fósforo insolúvel em água
INTRODUCTION
When phosphate rocks (PR) are acidulated to form more soluble P fertilizers, P compounds are formed other than the desired NH4 and Ca phosphates. Exhaustion of high-grade phosphate rock throughout the world will certainly increase the levels of impurity compounds, generally water-insoluble, in the final acidulated P fertilizers (Lehr, 1984). In Brazil, acidulated P fertilizers have been produced from low-grade PR due to high amounts of impurities, especially iron-aluminum oxides, present in the ore.
The presence of Fe-Al impurities in the final acidulated P fertilizer has raised the concern that the
insoluble P compounds would decrease the agronomic effectiveness of the fertilizers due to a decrease in water-solubility of such fertilizers (Sikora & Giordano, 1995). Based on this concept the European Economic Community set a level of 93% of the ammonium citrate-soluble P as water-soluble P in fully acidulated P fertilizers market in the European Community (Council, 1976) but Johnston (1999), in a literature review, commented that there is no scientific basis for requiring such a high level of water-soluble P.
on P availability to potatoes (Mullins & Evans, 1990) and pearl millet (Mullins & Sikora, 1990) in field trials and to maize (Mullins, 1988) and sorghum sudangrass (Sikora et al., 1989) in greenhouse studies. Mullins & Evans (1990) evaluated four commercial triple superphosphates sources containing various levels of water-soluble P (81 to 94% of AOAC available P as water-soluble P) and concluded that yield of potatoes was not affected by the source of P and also that the fertilizer performance was not influenced by the level of water-soluble P. Similar results were obtained by Mullins & Sikora (1990) in ten sources of monoammonium phosphates containing from 81 to 100% water-soluble P (in the AOAC available P) to pearmillet.
Prochnow et al. (1998) compared the efficiency of four experimental P sources, produced from Brazilian apatite concentrate varying in their content of iron and aluminum oxides, in its original and water-insoluble form. The authors concluded that the P availability of the water-insoluble fraction was generally lower than the original P source and that higher amounts of iron and aluminum oxides lead to lower performance of the water-insoluble fraction.
In Brazil, single superphosphates (SSP) have to contain 18% and 16% (tolerance of 10% minus), respectively, of P2O5 soluble in neutral ammomium citrate + water (NAC + H2O) and water in order to be commercialized (Brasil, 1982). These standards discard some PRs or apatite concentrates as potential sources to produce acidulated P fertilizers. Furthermore, some materials or industrial processes utilized in order to produce SSP with better physical properties, or containing micronutrients, interfere with the water solubility of the final product and these processes should also be evaluated concerning the performance of the modified products in terms of P availability to plants.
The objective of this study was to evaluate the effectiveness of various commercial and experimental acidulated P fertilizers, varying in water and citrate solubility, and produced following the procedure to obtain single superphosphates, in order to provide P to soybean plants under field condition.
MATERIAL AND METHODS
Phosphorus sources
Ten P sources1
were produced utilizing the process to obtain SSP (TABLES 1 and 2). It can be noticed that three of the products were in the powder form (FAR, FFM and FC), six granulated and screened to pellets particle size of 1.7 – 3.35 mm (FL, DUR, MR, FI, FS and EK) and one granulated to pellets particle size of 0.5 – 1.41 mm (FMG). In some of the P sources materials were added, such as MgO, Concinal (obtained from the algae Lhithothamium) and micronutrients, or processes modified, in order to evaluate the improvement
in the physical properties of the fertilizers (FFM, FC, FMG, DUR and MR). A standard source of P was produced by crystallization of the water-soluble fraction of a triple superphosphate – FMC.
Field Evaluation of the P sources
Field evaluation was conducted in Barreiras, Bahia, Brazil, in a medium-textured, Xanthic Hapludox containing 59%, 5% and 36% of sand, silt and clay, respectively. Resin-extractable P (Raij & Quaggio, 1983) was 9 mg dm-3
and Mehlich-1 P (Mehlich, 1953) was 5 mg dm-3
which both corresponds to a low soil test level. The amounts of Ca, Mg, K, H+Al and Al were respectively 2.3, 0.9, 0.1, 1.8 and 0.0 cmolc dm
-3
. Cation-exchange capacity was 5.1 cmolc dm -3
and pH in 0.01 mol L-1
CaCl2 (2.5 solution:soil ratio) was 5.2. Potassium was added as basal dressing at a rate of 150 kg ha-1
K as KCl. Calcium sulfate dihydrate (gypsum) and a product containing micronutrients (5% Zn, 3% B, 6% Cu, 5% Fe and 17.5% Mn) were also added at rates of 400 and 40 kg ha-1
, respectively. These fertilizers were broadcast and incorporated to a soil depth of 8 cm. The amounts of nutrients applied as basal application were adequate to discard any potential side-effect when comparing the P sources.
Phosphorus sources and the standard FMC were localized in the line (3 cm below and 2 cm besides the seeds) at a rate to supply 80 kg ha-1
P2O5 of NAC + H2O soluble P2O5. The rate of P2O5 was chosen based on the P status of the soil in order to provide sufficient phosphorus for high yield of soybean and was based on the literature (EMBRAPA, 1998). The P sources were applied based on the NAC + H2O available P2O5 instead of total P2O5 since phosphate fertilizers in Brazil are marketed on the basis of their NAC + H2O available P2O5 content. By applying 80 kg ha-1
NAC + H2O soluble P2O5, total P2O5 and water-soluble P2O5 were applied, respectively, in the range of 81.4 – 101.6 and 18.7 – 72.32 kg ha-1
.
In order to test some of the products in a range of rates (response curve) the P sources FL, FS and the standard source of P were also applied in rates of 40 and 120 kg ha-1
P2O5. A check plot control (no P applied) was also included. The P sources and rates were arranged in a randomized complete-block design with three replications. Field plots consisted of four rows, 4 m long and spaced at 0.5 m.
Seeds of soybean (Glycine max, cultivar FT 103) were inoculated with Rhizobium japonicum and treated with 17 g of Mo and 2 g Co per 50 kg of seeds and sown in november 24, 1998, at the rate of 15 seeds per meter.
Soybean grain was manually harvested in April 08, 1999, from the 2 meters of the two central rows and the yield calculated.
Data Analysis
Yield of soybean was analyzed considering: (a) analysis of variance for the control (no P applied) + P sources treatments applied at only one rate (80 kg ha-1
P2O5) with means comparison performed utilizing LSD (least significant difference) lines; (b)
analysis of variance considering only the treatments where P was applied (control was excluded); (c) regression procedures for the factorial design between three P sources (FMC, FS and FL) and four rates of P2O5 (0, 40, 80 and 120 kg ha-1
). All the data analysis was performed using SAS software (SAS, 1985). For the relation between yield of soybean and rates of P2O5 a dummy variable multiple regression analysis was performed. This resulted in a common intercept and a single value of MSE and R2
for the three regression equations (one for each P source). Three models (linear, semi-log and square root) were tested to describe the relationship between the parameters studied, and the one presenting the higher R2
chosen.
The relative agronomic effectiveness (RAE) was calculated for each P source. RAE was definied as the ratio of the two slopes:
100 x FMC
i RAEi
β β =
where βi is the slope of the response function of the P sources tested and βFMC is the slope of the response function of the standard - FMC. This expression ranks the P sources with respect to FMC according to their agronomic potential to produce a yield response (Chien et al., 1990).
In order to evaluate if there was statistical significant difference between the three phosphorus sources in the range of rates applied a F value (= t 2
) was calculated according to the formula:
2
2 ( ( ))
)) ( (
| |
ib SE ia
SE
ib ia t
β β
β β
+ − =
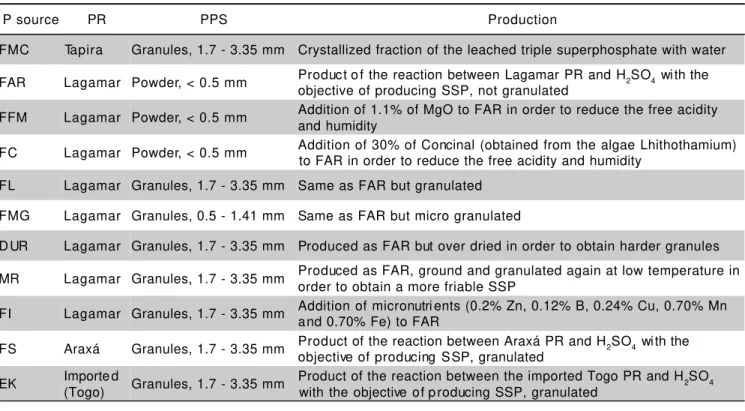
P source PR PPS Production
FMC Tapira Granules, 1.7 - 3.35 mm Crystallized fraction of the leached triple superphosphate with water
FAR Lagamar Powder, < 0.5 mm Product o f the reaction between Lagamar PR and H2SO4 wi th the
objective of producing SSP, not granulated
FFM Lagamar Powder, < 0.5 mm Addition of 1.1% of MgO to FAR in order to reduce the free acidity and humidity
FC Lagamar Powder, < 0.5 mm Addition of 30% of Concinal (obtained from the algae Lhithothamium) to FAR in order to reduce the free acidity and humidity
FL Lagamar Granules, 1.7 - 3.35 mm Same as FAR but granulated
FMG Lagamar Granules, 0.5 - 1.41 mm Same as FAR but micro granulated
D UR Lagamar Granules, 1.7 - 3.35 mm Produced as FAR but over dried in order to obtain harder granules
MR Lagamar Granules, 1.7 - 3.35 mm Produced as FAR, ground and granulated again at low temperature in order to obtain a more friable SSP
FI Lagamar Granules, 1.7 - 3.35 mm Addition of micronutri ents (0.2% Zn, 0.12% B, 0.24% Cu, 0.70% Mn and 0.70% Fe) to FAR
FS Araxá Granules, 1.7 - 3.35 mm Product of the reaction between Araxá PR and H2SO4 wi th the
objective of producing S SP, granulated
EK Importe d
(Togo) Granules, 1.7 - 3.35 mm
Product of the reaction between the imported Togo PR and H2SO4 with the objective of p roducing SSP, granulated
TABLE 1 - Phosphate rocks utilized, pellet particle size (PPS) and details on the production of the P sources.
P
source(1 ) P2O5 Al2O3 Fe2O3 fi (2 )
Total NAC+H2O H2O
%
---FMC 48.2 47.4 40.9 1.7 1.6 86.3
FAR 18.9 16.5 11.7 2.1 0.8 70.9
FFM 16.9 15.5 10.0 1.9 0.7 64.5
F C 15.2 13.3 3.1 1.9 0.8 23.3
FL 20.9 18.0 13.1 2.3 0.9 72.7
FMG 21.2 16.7 13.0 2.4 0.9 77.8
DUR 22.8 18.1 10.7 2.1 1.1 59.1
MR 20.5 17.0 13.6 2.1 0.9 80.0
FI 19.2 17.0 12.0 n.d . n.d . 70.6
FS 20.4 19.2 15.4 0.5 1.5 80.2
EK 20.2 17.7 16.0 0.5 0.4 90.4
TABLE 2 - Chemical analysis of the P sources.
(1) FMC: standard source of P; FAR: SSP produced from Lagamar PR; FFM: addition of 1.1% MgO to FAR; FC: Addition of 30% concinal to FAR; FL: Granulated FAR; FMG: Microgranulated FAR; DUR: Over dried FAR; MR: friable FAR; FI: Addition of micronutrients to FAR; FS: SSP produced from Araxá PR; EK: SSP produced from Togo PR. (2) fi= percentage of water-soluble P
3000 3100 3200 3300 3400
0 20 40 60 80
Amount of water-soluble P2O5 applied, (kg ha -1
)
Yield of soybean, (kg ha
-1)
3000 3100 3200 3300 3400
70 80 90 100 110
Amount of total P205 applied (kg ha -1
)
Yield of soybean (kg ha
-1)
where βia is the slope of the response function for the first P source tested, βib is the slope for the second P source tested, SE(βia) is the standard error for βia and SE(βib) is the standard error for βib.
RESULTS AND DISCUSSION
Characteristics of the P sources
The P sources, excluding the standard source, presented high variability for NAC+H2O soluble P2O5 (13.3 - 19.2%), water-soluble P2O5 (3.1% - 16.0%) and percentage of water-soluble P2O5 in the NAC+H2O fraction (23.3 - 90.4%; TABLE 2), showing that the processes and materials, including the PR, used in the production of the P sources interfere in the solubility of the fertilizers. Actually, based on current Brazilian legislation only two of the ten P sources (EK and FS) meet the requirement to be commercialized as single superphosphates (at least 14.4% of water-soluble P2O5). FC was the P source with the lowest water-soluble P2O5 due probably to the presence of dicalcium phosphate. The percentage of water-soluble P2O5 in the NAC + H2O fraction in the standard source of P (86.3%) was low considering that in the solution leached the only P form expected was the monocalcium phosphate monohydrate. Two possibilities exist to explain this result: (i) water-insoluble forms of Fe-Al-P still remaining among the crystals of monocalcium phosphate monohydrate and (ii) the formation of dicalcium phosphate (monetite), which is not water-soluble, during the process of crystallization. The presence of 1.6% of Fe2O3 and 1.7% of Al2O3 in the product obtained after crystallization reinforces the statement (i) as the possible cause for the presence of forms of water-insoluble P compounds.
Field evaluation
Yield of soybean was significantly affected when considering the control + eleven P sources applied (80 kg ha-1
) as the independent variables (p ≤ 0.05) but the comparison of means by LSD lines showed that the only
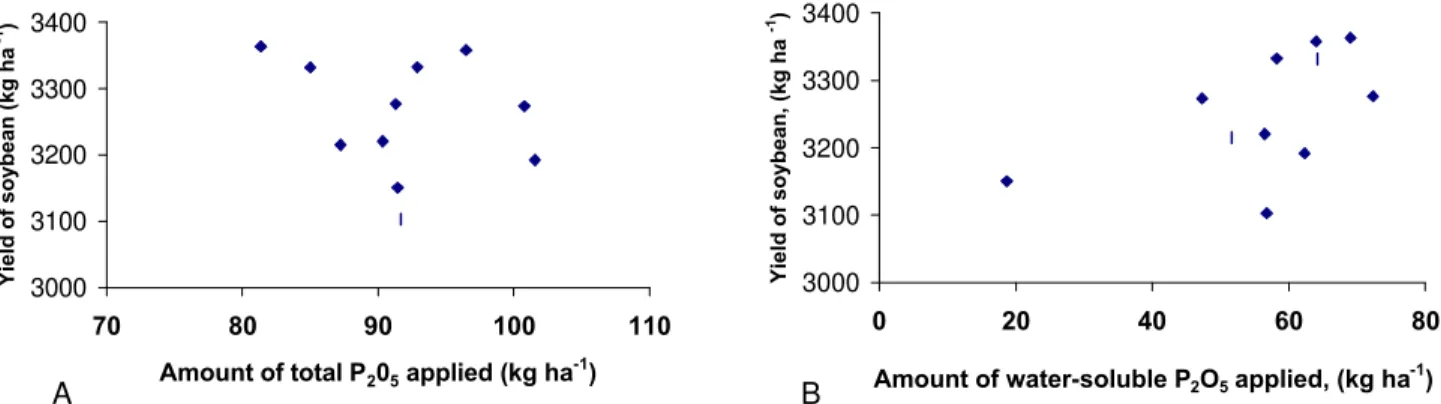
Figure 1 - Yield of soybean as affected by the amount of total P2O5 (A) and water-soluble P2O5 (B), considering the eleven P sources. P source(1 ) Yi eld of
soybean LSD lines 1
(2, 4) LSD lines 2(3, 4)
kg ha-1
Control 1775.3 B
FMC 3363.2 A a
FAR 3102.8 A a
FFM 3215.0 A a
F C 3150.2 A a
FL 3332.3 A a
FMG 3191.8 A a
DUR 3273.3 A a
MR 3357.7 A a
FI 3220.5 A a
FS 3331.8 A a
EK 3276.5 A a
Observations 35 33
LSD 561.28 561.34
C.V. (%) 10.2 10.1
TABLE 3 - Yield of soybean as affected by the application of P2O5 from different P sources.
(1) FMC: standard source of P; FAR: SSP produced from Lagamar PR; FFM: addition of 1.1% MgO to FAR; FC: Addition of 30% concinal to FAR; FL: Granulated FAR; FMG: Microgranulated FAR; DUR: Over dried FAR; MR: friable FAR; FI: Addition of micronutrients to FAR; FS: SSP produced from Araxá PR; EK: SSP produced from Togo PR. (2) LSD lines 1: mean comparison in the column considering all P sources + check control.
(3) LSD lines 2: mean comparison in the column considering P sources (check control excluded).
(4) Values followed by the same letter in the column are not statistically different (p ≤ 0.05).
significant difference was met between the control with all the P sources: control < all P sources (TABLE 3). When the control was excluded and just the eleven P sources considered in the analysis of variance still no effect of P source was detected. No significant relation was found between the amounts of total P2O5 or water-soluble P2O5 applied and yield of soybean (Figure 1).
The differences in water-soluble P presented by the P sources do not interfere with the yield of soybean considering the application of 80 kg ha-1
P2O5, which is the recommended rate of P2O5 to be applied to this crop taking into account the available P status of the soil (EMBRAPA, 1998). Products classified or not as single super-phosphates by the Brazilian legislation had similar efficiency in providing P to the soybean plants.
The objective of this study was not to evaluate the processes used in the production of the P sources concerning possible improvement in the physical properties of the fertilizers, but to find out if these processes, which interfere in the water-solubility, would also interfere in the agronomic effectiveness of the P fertilizers to provide phosphorus to the plants.
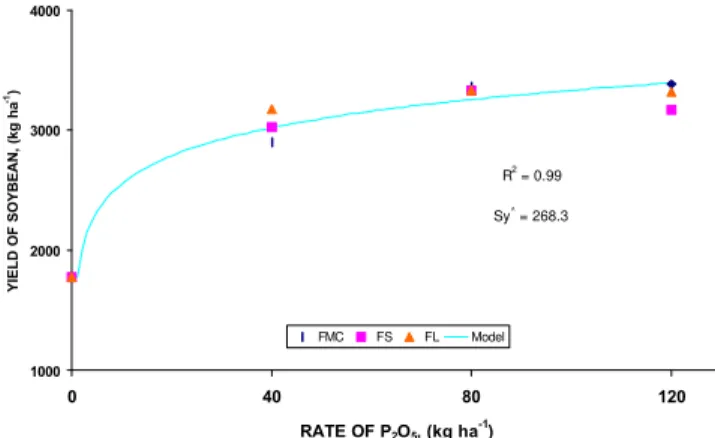
The semi-logarithmic model better described the relation between yield of soybean and the rate of P2O5 (TABLE 4 and Figure 2). The RAE for the three P sources tested were respectively of 100, 103 and 96% for the FMC, FS and FL (TABLE 5). As no statistical difference was found in yield of soybean provided by the three P sources only one model was adjusted to express the relation between yield and rates of P2O5 (Figure 2). FL did not meet the requirement to be considered a single superphosphate but its performance in terms of providing P to the plants was not statistically different than the standard source of P and a single superphosphate which is in agreement with the legislation (Brasil, 1982).
The results obtained in this study agree with those reported by Mullins & Evans (1990) and Mullins & Sikora (1990). These authors also found that variance in the water-solubility of fully acidulated P fertilizers (81 to 94% of AOAC available P as water-soluble P for triple superphosphates and 81 to 100% for monoammonium phosphates) did not affect yields and that fertilizer performance was poorly affected by the level of water-soluble P.
New field studies are encouraged in order to clarify the necessity of high water-solubility in fully acidulated P
fertilizers and also to verify if the standards of water-soluble P2O5 adopted by the Brazilian legislation are supported by scientific data.
CONCLUSION
The fertilizers tested performed equally well as source of P for soybean when band applied under field conditions, and the level of water-soluble P did not influence the fertilizer performance.
REFERENCES
BRASIL. Ministério da Agricultura. Secretaria Nacional de Defesa Agropecuária. Portaria 01 de 04/83; Portaria 03 de 12/06/ 86. Inspeção e fiscalização da produção e do comércio de fertilizantes, corretivos, inoculantes, estimulantes e biofertilizantes destinados à agricultura; legislação e fiscalização. Brasília, 1982. 88p.
CHIEN, S.H.; SALE, P.W.G.; FRIESEN, D.K. A discussion of the methods for comparing the relative effectiveness of phosphate fertilizers varying in solubility. Fertilizer Research, v.24, p.149-157, 1990.
COUNCIL Directive on the Approximation of the Laws of the Member States Relating to Fertilizers. Official Journal of the European Communities, n. L 24, p.21-44, 1976. (Directive, 76/116/EEC).
EMBRAPA. Centro Nacional de Pesquisa de Soja. Recomendações técnicas para a cultura da soja na região central do Brasil. Londrina: EMBRAPA, CNPSo, 1998. 182p. (Documentos, 120).
Figure 2 - Yield of soybean as affected by the rate of P2O5. Models for the three P sources tested were not statistically different (p ≤ 0.05).
P source(1 ) Estimate Va lue of estimate
Intercep t β0 1775.25
FMC β1 337.85 **
(20 .75 )
FS β2 347.71 **
(20 .75 )
FL β3 324.48 **
(20 .75 ) TABLE 4 - Regression estimates for the semi-logarithmic
model adjusted describing the relation between yield of soybean as affected by source and rate of P2O5 .
(1) FMC: standard source of P; FS: SSP produced from Araxá PR; FL: Granulated low-grade SSP produced from Lagamar PR. **significant at 0.01
( )standard error of estimates
P source(1 ) RAE
%
FMC 100
FS 103
FL 9 6
TABLE 5 - Relative Agronomic Effectiveness (RAE) of each source relative to the standard FMC for yield of soybean.
(1) FMC: standard source of P; FS: SSP produced from Araxá PR; FL: Granulated low-grade SSP produced from Lagamar PR.
1000 2000 3000 4000
0 40 80 120
RATE OF P2O5, (kg ha -1
)
YIELD OF SOYBEAN, (kg ha
-1)
FMC FS FL Model
R2
= 0.99
Sy^
Received March 13, 2000 JOHNSTON, A.E. Water solubility of phosphatic fertilizers. In:
THE FERTILIZER INSTITUTE’S 1999 WORLD FERTILIZER CONFERENCE, New York, 1999. Proceedings. New York: The Fertilizer Institute, 1999. p.1-31.
LEHR, J.R. Impact of phosphate rock quality on fertilizer market uses. Industry and Mineralogy, v.200, p.127-153, 1984.
MEHLICH, A. Determination of P, Ca, Mg, K, and NH4 by North Carolina soil testing laboratory. Raleigh: North Caroline Department of Agriculture, 1953.
MULLINS, G.L. Plant availability of P in commercial superphosphate fertilizers. Communications in Soil Science and Plant Analysis, v.19, p.1509-1525, 1988.
MULLINS, G.L.; EVANS, C.E. Field evaluation of commercial triple superphosphates fertilizers. Fertilizer Research, v.25, p.101-106, 1990.
MULLINS, G.L.; SIKORA, F.J. Field evaluation of commercial monoammonium phosphate fertilizers. Fertilizer Research, v.22, p.1-6, 1990.
PROCHNOW, L.I.; KIEHL, J.C.; RAIJ, B. van. Plant availability of phosphorus in the neutral ammonium citrate fraction of Brazilian acidulated phosphates. Nutrient Cycling in Agroecosystems, v.52, p.61-65, 1998.
RAIJ, B. van; QUAGGIO, J.A. Métodos de análise de solo para fins de fertilidade. Campinas: Instituto Agronômico, 1983. 31p.
SAS Institute. SAS for linear models: a guide to the ANOVA and GLM procedures. Cary: Statistical Analysis System Institute, 1985.
SIKORA, F.J.; DILLARD, E.F.; COPELAND, J.P. Chemical characterization and bioavailability of phosphorus in water-insoluble fractions of three mono-ammonium phosphate fertilizers. Journal of the Association of Official Analytical Chemistry, v.72, p.852-856, 1989.