www.atmos-chem-phys.net/11/6265/2011/ doi:10.5194/acp-11-6265-2011
© Author(s) 2011. CC Attribution 3.0 License.
Chemistry
and Physics
Atmospheric acidification of mineral aerosols: a source of
bioavailable phosphorus for the oceans
A. Nenes1,2,3, M. D. Krom4, N. Mihalopoulos5,3, P. Van Cappellen1, Z. Shi4, A. Bougiatioti5, P. Zarmpas5, and B. Herut6
1School of Earth and Atmospheric Sciences, Georgia Institute of Technology, Atlanta, Georgia, USA 2School of Chemical and Biomolecular Engineering, Georgia Institute of Technology, Atlanta, Georgia, USA
3Institute of Chemical Engineering and High Temperature Chemical Processes, Foundation for Research and Technology
Hellas, Patras, Greece
4Earth and Biosphere Institute, School of Earth and Environment, University of Leeds, Leeds, UK 5Department of Chemistry, University of Crete, Heraklion, Crete, Greece
6Israel Oceanographic Limnological Research, Tel Shikmona, Haifa, Israel
Received: 11 February 2011 – Published in Atmos. Chem. Phys. Discuss.: 21 February 2011 Revised: 14 May 2011 – Accepted: 27 May 2011 – Published: 1 July 2011
Abstract. Primary productivity of continental and marine ecosystems is often limited or co-limited by phosphorus. De-position of atmospheric aerosols provides the major external source of phosphorus to marine surface waters. However, only a fraction of deposited aerosol phosphorus is water sol-uble and available for uptake by phytoplankton. We propose that atmospheric acidification of aerosols is a prime mecha-nism producing soluble phosphorus from soil-derived miner-als. Acid mobilization is expected to be pronounced where polluted and dust-laden air masses mix. Our hypothesis is supported by the soluble compositions and reconstructed pH values for atmospheric particulate matter samples col-lected over a 5-yr period at Finokalia, Crete. In addition, at least tenfold increase in soluble phosphorus was observed when Saharan soil and dust were acidified in laboratory ex-periments which simulate atmospheric conditions. Aerosol acidification links bioavailable phosphorus supply to anthro-pogenic and natural acidic gas emissions, and may be a key regulator of ocean biogeochemistry.
Correspondence to:A. Nenes ([email protected])
1 Introduction
al. (2008) further note that it is not known at present what processes control the amount of soluble P in aerosols.
We hypothesize that acid processing of mineral aerosols is a major pathway for the production of water soluble P in the atmosphere. The main acids in the atmosphere, H2SO4and
HNO3, are generated by the oxidation of sulfur and
nitro-gen gases emitted by bionitro-genic, volcanic and anthroponitro-genic sources (Seinfeld and Pandis, 2006). These acids, if present in sufficient amounts in mineral aerosols, will overcome the available carbonate buffer capacity. This causes aerosol pH to drop to low values under clear-sky conditions (Meskhidze et al., 2003), increasing the solubilities of apatite and iron (hydr)oxide minerals by several orders of magnitude (Stumm and Morgan, 1996). Production of soluble P is analogous to that invoked to explain the presence of soluble iron and trace metals in atmospheric dust (Meskhidze et al., 2003; Spokes et al., 1994).
2 Evidence of acid mobilization of P in Eastern Mediterranean aerosol
The Eastern Mediterranean Sea (EMS) offers an ideal set-ting for tesset-ting the hypothesis of soluble (leachable) inor-ganic P (LIP) production by aerosol acidification. The EMS is unequivocally P limited with a molar nitrate-to-phosphate ratio of 28:1 in the deep water (Krom et al., 1991). Dry deposition is a major source of P to the basin and directly affects primary productivity in offshore areas (Krom et al., 2004). The Saharan desert is the principle source region of mineral aerosols reaching the central EMS and can interact with polluted airmasses from Europe and the Middle East. Size segregated aerosol samples were collected over a period of five years at the Finokalia station (35◦20′N, 25◦40′E), a remote marine background site on Crete located 50 m in-land and 230 m a.s.l. (Sciare et al., 2003). HYSPLIT back trajectories (www.arl.noaa.gov/ready/hysplit4.html) indicate that the air masses sampled at Finokalia originate from the marine boundary layer, Northern Africa, Europe, Asia Minor and the Middle East. Air masses from Europe, the former So-viet Republics and Asia Minor tend to exhibit the highest an-thropogenic pollutant loadings (aerosol sulfates and nitrates), while the Mediterranean and Northern Africa typically yields cleaner air masses (Mihalopoulos et al., 1997). Hence, Saha-ran dust reaching Finokalia has experienced variable degrees of interaction with polluted air.
2.1 Collection and chemical analysis of aerosol samples
Aerosol samples were collected using a virtual impactor (VI; Loo and Cork, 1988). The VI was modified to divide parti-cles into two size fractions: fine (aerodynamic particle diam-eter,Da<1.3 µm) and coarse particles (Da>1.3 µm). The
inlet preceding each VI has a cut-off size of 10 µm. The operational flow rate is 16.7 l min−1, divided into 1.7 and
15.0 l min−1minor and major flows, respectively. The
aver-age sampling time was two days (from 1 to 3 days). Polyte-trafluoroethylene (PTFE) filters (Millipore Fluoropore; pore size 3.0 µm; diameter 47 mm) were used for sampling.
Samples were pre- and post-weighed using a 6-digit mi-crobalance (ATI-CAHN/CA27). The readability of the bal-ance is 10 µg with a precision of 40 µg corresponding to mass concentration uncertainties of 0.86 and 0.77 µg m−3for fine
and coarse fractions, respectively. After weighing, the sam-ples were stored in a freezer in Petrislides (Millipore Inc.). Samples were analyzed for water-soluble ions and LIP. One quarter of each PTFE filter was extracted using 20 ml of nanopure water. The solutions obtained were analyzed by ion chromatography (IC) for anions (Cl−
, Br−
, NO−3, SO24−, C2O4 2−)and cations (Na+, NH+4, K
+ , Mg2+
and Ca2+) . Accuracy was determined by comparing results with certi-fied WMO and DIONEX standards and was better than 5 % for all elements (n= 5). More details on the IC method are given in Bardouki et al. (2003). LIP was analyzed colorimet-rically following Bardouki et al. (2003).
2.2 Thermodynamic modelling of atmospheric samples
The chemical composition, speciation and phase state of the aerosols collected on the filter samples were modelled us-ing the ISORROPIA/ISORROPIA-II aerosol thermodynamic models (http://nenes.eas.gatech.edu/ISORROPIA; Nenes et al., 1998; Fountoukis et al., 2007). These models have been extensively evaluated against in-situ observations (e.g., Yu et al., 2005; Fountoukis et al., 2009), and are currently used for driving simulations in US, Asian and European global, regional and air quality models.
ISORROPIA/ISORROPIA-II simulates the composition of aerosol in equilibrium with the surrounding gas phase, in-cluding the transformations taking place when freshly emit-ted dust is mixed with acidic pollution. The model takes as input the amount of “aerosol precursor” sodium, potassium, ammonium (gas-phase NH3 plus aerosol ammonium),
sul-fate (in the form of neutral sulsul-fate and bisulsul-fate ions), mag-nesium, calcium, chloride (gas-phase HCl plus aerosol chlo-ride), nitrate (gas-phase HNO3plus aerosol nitrate), relative
humidity and temperature. Based on this input, the model predicts at thermodynamic equilibrium the phases present in the aerosol particles (aqueous, solid, or both), the amount and chemical composition of each phase, and, the concentra-tions of semi-volatile species (i.e., NH3(g), HNO3(g), HCl(g))
in the gas phase.
a combination of Kusik-Meissner and Bromely models (the latter of which was used in this study). The amount of water contained within the aerosol is in equilibrium with the gas phase, so that the water activity must equal to the fractional relative humidity.
Predictions were carried out assuming that the aerosol par-ticles are in equilibrium at an ambient relative humidity of 95 %, a temperature of 298 K, and with compositions con-strained from the observations. The equilibrium assumption applies well to submicron (fine) aerosol but may introduce errors when applied to coarse mode aerosol (e.g., Capaldo et al., 2000). Thermodynamic calculations are therefore car-ried out for all the fine aerosol samples, and for well-aged coarse aerosol samples (for which the carbonate buffer has been neutralized). The pH of the aerosol is predicted by ISORROPIA/ISORROPIA-II; the concentration of total dis-solved P is calculated by dividing the measured LIP with the calculated aerosol liquid water content.
2.3 Apatite solubility calculations
Dissolution of apatite, Ca5(PO4)3(OH, F, Cl), is the primary
source of mineral phosphorus in soils (Newman, 1995; Nezat et al, 2007). Reported solubility products for apatite minerals are highly variable, because of solid solution formation, incorporation of impurities (e.g., carbonate) and non-stoichiometric composition. Solubility calcula-tions were carried out considering the pure end-member minerals hydroxyapatite (HAP) and the less-soluble fluo-rapatite (FAP) in NaCl solutions. The calculations provide a lower estimate of solubility, as the formation of aqueous phosphate complexes – in particular with magnesium – will increase the solubility of an apatite mineral relative to that in a NaCl solution of the same ionic strength (Her-shey et al., 1989). The incorporation of carbonate in the apatite structure further enhances the mineral solubility relative to that of the pure end-member phases (Jahnke, 1984). Dissolution of HAP and FAP is assumed to occur in a background electrolyte solution (i.e., containing no dissolved calcium, phosphate of fluoride initially) using the following solubility products for HAP and FAP at 25◦
C and 1 bar: KHAP = (Ca2+)5(HPO42−)3(OH−)/(H+)3
= 10−20.47 and K
FAP = (Ca2+)5(HPO24−)3(F−)/(H+)3 =
10−23.12 (Van Cappellen and Berner, 1991), where (X)
denotes the activity of ionic species X in solution. The concentration of LIP,mTP, is related to that of HPO24− via
mTP=mHPO−2 4
∗K
3/(H+)+1+(H+)/∗K2+(H+)2/
∗K
1∗K2, where m refers to aqueous concentrations in
molal units, (H+)
is the activity of hydronium ions in solu-tion, and∗K
1,∗K2,∗K3are the conditional (stoichiometric)
ionization constants of phosphoric acid. Combining the min-eral solubility equilibria, the phosphoric acid dissociation equilibria and the mass balance constraints,mCa/5 =mTP/3 =
mHAPandmCa/5 =mTP/3 =mF=mHAP, the total dissolved
phosphate concentrations in equilibrium with HAP and FAP can be computed.
Representative solubility calculations were performed for HAP and FAP dissolving in pure electrolyte (NaCl) solutions at 25◦
C. The conditional ionization constants for phosphoric acid (measured up to 6mNaCl) were taken from Hershey et al. (1989). The Pitzer ion interaction model was used to calculate the activity coefficients (Hershey et al., 1989; Millero and Schreiber, 1982). The latter is applicable up to 3–4mNaCl, typical of electrolyte concentrations calcu-lated using the ISORROPIA-II model predictions for aerosol at∼95 % RH.
2.4 Results from Eastern Mediterranean aerosol analysis
Under typical marine conditions (relative humidity 80– 95 %), soluble electrolytes in the aerosol cause the uptake of water from the gas phase, forming an aqueous solution that is in contact with the insoluble components of the dust aerosol (Seinfeld and Pandis, 2006). This aerosol solution provides the medium for reacting and dissolving mineral-bound P. A proxy of the acidity of the aerosol aqueous phase is given by the soluble ion balance,Ib= 2[SO4] + [H2PO4] + [NO3]
+ [Cl] − 2[Ca] −[NH4] − [Na] − 2[Mg] −[K] (where
“[X]” represents the measured concentration of species “X” expressed in µmoles per m3air, andIbhas units of µgreqs per
m3air, “greqs” being “gram-equivalents”). WhenIb>0, the
aerosol tends to be acidic (as excess H+
is required in the as-sociated aqueous phase to neutralize the excess anions) and vice versa. The coarse (diameter>1.3 µm) and fine (diameter
<1.3 µm) aerosol fractions exhibit distinct acidities (Fig. 1):
Ib (and aerosol acidity) in the fine fraction is largely
con-trolled by sulfate and in the coarse fraction by nitrate. When the aerosol is acidic (Ib>0), nitrate tends to partition to the
gas-phase in the form of nitric acid (Meskhide et al., 2003). When the aerosol is neutral or alkaline (Ib<0), nitrate
parti-tions to the aerosol phase, displacing chloride and carbonate ions (from seasalt and carbonate minerals) to the gas phase (in the form of HCl and CO2, respectively; Meskhidze et al.,
2003). As expected, coarse particles contain relatively low sulfate levels, typical of marine background aerosols (∼0.1–
1 µg m−3; Seinfeld and Pandis, 2006). Sulfate concentrations
of fine particles were distinctly higher, indicative of conti-nental pollution (∼1–10 µg m−3; Seinfeld and Pandis, 2006).
Aerosol nitrate and sulfate concentrations no longer corre-late withIbwhenIb<−0.05 µgreqs m−3, probably because
insufficient acid was present to titrate the carbonate buffer of dust.
Fig. 1. Distributions of key acidic aerosol species in the Finokalia data set. Shown are the concentrations of(a)nitrate and(b)sulfate against the “ion balance”,Ib, calculated asIb= 2[SO4] + [H2PO4]
+ [NO3] + [Cl]−2[Ca]−[NH4]−[Na]−2[Mg]−[K], where
“[X]” represents the concentration of species “X” in the aerosol sample, in mol m−3air. Data for coarse and fine aerosol fractions
are presented as blue and magenta symbols, respectively.
to chemical (and, hence, pH) variability across particle size and time, which were averaged during aerosol collection (the pH of individual particles depends especially on their car-bonate content which is known to be variable; samples col-lected over several days may also combine particles from somewhat different air masses). Nevertheless, the observed trend between the soluble P:Ca ratio andIbis strongly
con-sistent with acid mobilization of phosphate from apatite, the dominant form of P in Saharan dust (see below). Examining the data for periods where fires are at a minimum (October– March) results in a plot very similar to Fig. 2a (not shown); thus biogenic P from biomass burning is not the prime cause for the correlation between acidity and P:Ca.
In itself, Ib does not directly yield the exact pH level
in the aerosol solution nor the amount of water avail-able for dissolution of P from dust. Both can be esti-mated using ISORROPIA-II (Fountoukis and Nenes, 2007; Sect. 2.2). Using typical levels of relative humidity and
Apatite
0.001 0.01 0.1 1
-0.1 -0.05 0 0.05 0.1
Ion balance (μmol -3
)
Molar r
a
tio P:Ca
Fine Coarse
Acidic Alkaline
(a)
Apatite
0.001 0.01 0.1 1
-0.1 -0.05 0 0.05 0.1
-Fine Coarse
Acidic Alkaline
(a)
Apatite
-
-Fine Coarse
Acidic Alkaline
(a)
Apatite
-Fine Coarse
(a)
0 1 2 3 4 5 6
pH
Tot
a
l
di
s
s
ol
v
e
d P
(
M
)
Fluorapatite Hydroxyapatite Finokalia - Coarse Finokalia - Fine 101
100
10-1
10-2
10-3
10-4
(b)
Fig. 2. (a)The molar ratio of LIP over Ca as a function of ion balance,Ib. Fine fraction samples are shown with magenta
sym-bols, coarse particles with blue symbols. Also shown is the P:Ca ratio for the mineral apatite. (b)Predicted concentration of total dissolved P against aerosol pH. Predictions are carried out using the ISORROPIA-II thermodynamic model (Fountoukis and Nenes, 2007), assuming that the aerosol particles are at thermodynamic equilibrium with an ambient relative humidity (RH) of 95 %, a temperature of 298 K, and with aqueous compositions constrained from the observations. Also shown are the solubility lines for the end-member minerals fluorapatite, Ca5(PO4)3F and
hydroxya-patite, Ca5(PO4)3OH. Repeating the calculations for lower RH
de-creases pH, so that the aerosols become even more unsaturated with respect to the apatite minerals. For clarity only the solubility lines at ionic strength 3mare plotted.
particles reside in subsaturated water vapor (non-cloud) con-ditions for most of their atmospheric residence time (Seinfeld and Pandis, 2006), the pH predictions and solubility consid-erations presented in Fig. 2b reflect the most frequently oc-curring state in the atmosphere.
3 Testing P mobilization hypothesis in the laboratory
The Finokalia data and subsequent thermodynamic analy-sis suggest that acidification plays an important role in pro-ducing LIP. We tested the proposed mechanism by exposing Saharan soil and dust samples to pH levels consistent with the aerosol acidities derived from the Finokalia data. Soil samples were collected from two locations known to be ma-jor sources of modern Sahara dust: the Tibesti Mountains (hereafter Tibesti), and the Western Sahara (hereafter WS) (Brooks and Legrand, 2000; Prospero et al., 2002; Washing-ton et al., 2009). The samples were wet-sieved to less than 20 µm (PM20). We also generated PM10(particulate matter
less than 10 µm) from the re-suspended soils (called Tibesti-PM10 and WS-Tibesti-PM10 hereafter) without wet sieving. Details and chemical compositions of the samples are described in Shi et al. (2011a). In addition, two atmospheric Saharan dust samples were examined; they were collected at Bet Yanai, Is-rael, after dust storms on 10 May 2004 and on 29 March 2008 (hereafter BY1 and BY2, respectively). Prior to acid pro-cessing, the samples were characterised for the amounts of LIP, iron-bound mineral P (Fe-P), calcium-bound mineral P (Ca-P), and organically-bound P (Org-P) using the SEDEX procedure (Ruttenberg, 1992). In order to simulate atmo-spheric processing, the mineral samples were placed in pH 2 sulphuric acid for 24 h.
3.1 Phosphorus speciation of samples
All samples were characterised for the amount of LIP, iron-bound phosphorus (Fe-P), Ca-iron-bound phosphorus, residual in-organic P, and in-organic phosphorus (OP) using the SEDEX procedure (Ruttenberg et al., 2009):
– LIP: about 100 mg of dust or soil samples were leached for 2 h in 10 ml of 1 M MgCl2solution adjusted to pH 8
with NaOH. The solutions were then filtered through 0.2 µm pore size filters and the residues were treated with the same MgCl2solution for another 2 h and then
filtered. P in both extractions was added to obtain the LIP.
– Fe-P: 0.37 g sodium dithionite was added to the residue of previous extraction; 10 ml of citrate buffer solution (88.41 g l−1 trisodium citrate and 84.32 g l−1 sodium
bicarbonate) was then added to each sample. The solutions were shaken for 8 h at 25◦
C. The samples were filtered through a 0.2 µm pore size filter. Then 10 ml MgCl2solution (same as above) was added to the
residues and left for 2 h. The samples were then filtered again through a 0.2 µm pore size filter. The measured P was defined as Fe-P.
– Ca-bound-P: the residues were then treated with 10 ml 1 M sodium acetate solution buffered at pH 4 with acetic acid for 6 h and then filtered. The residues were then leached with MgCl2solutions (same as above) two
times. The filtrates were mixed and then diluted for 5 times with double distilled water.
– Residual inorganic P: the residues were then treated with 10 ml 1 M HCl for 16 h and then filtered. The Ca-bound-P and residual inorganic P added together was defined as Ca-P.
– Org-P: The residues were ashed at 550◦
C for 2 h and treated with 10 ml 1 M HCl for 16 h and then filtered. The P was defined as OP.
bound P and residual inorganic P are defined as Ca-P. Fe-P + Ca-P are defined as total inorganic Ca-P. And the total inorganic P plus Org-P is total-P.
In addition to SEDEX, we also measured the seawater leachable P and total inorganic P (TIP) using indepen-dent method.
– Sea water leachable P: about 10 mg of Tibesti, WS, BY1, or BY2 samples were put into 15 ml tubes, and leached into seawater for 30 h. The seawater was fil-tered through a 0.2 µm pore size polycarbonate filter and was added with 50 µl l−1of chloroform. After 30 h, the
samples were filtrated through a 0.2 µm pore size Teflon filter. The dissolved phosphorus content of the seawa-ter sample afseawa-ter filtration (and those of the blanks) was analyzed within an hour.
– TIP: about 10 mg of Tibesti, Tibesti-PM10, WS, or WS-PM10 samples were leached with 10 ml of 1 M HCl. The solution was left at room temperature overnight (16 h) with constant shaking. The solutions were then filtrated through 0.2 µm pore size filters and the filtrates analysed for phosphorus.
Replicate analysis of Tibesti samples (n= 4) resulted in rel-ative standard deviation of 14.2, 9.4, 10.6, 3.0 and 7.2 % re-spectively for LIP, Fe-P, Ca-bound P, org-P and total-P. The measured P concentration in each extraction solution was corrected for the blanks.
TIP measured with SEDEX and with 1 M HCl only were 17.5 and 17.3 µmol g−1in the Tibesti sample, and 18.6 and
18.5 µmol g−1in the WS sample, respectively. TIP measured
by 1 M HCl extractions in the Tibesti (17.3 µmol g−1) and
WS (18.5 µmol g−1)were almost the same as that in
Tibesti-PM10 (17.5 µmol g−1)and WS-PM10 (18.2 µmol g−1),
re-spectively, suggesting that the PM20 is representative of the
Table 1.Dust samples and simulated atmospheric processing results. All concentrations are given in µmol per gram dry weight.
Sample Seawater LIP LIP Fe-P Ca-P TIP Org-P Total-P pH 2 LIP Tibesti 0.3 0.5 2.6 14.4 17.5 4.5 21.9 16.7 WS 0.1 0.7 2.5 15.3 18.4 2.8 21.3 15.8 BY1 0.9 1.3 5.3 24.8 31.3 2.0 33.4 25.4 BY2 4.0 3.2 8.1 22.0 33.3 5.6 38.8 31.8 BYD1* 1.9 5.3 18.0 25.2 3.2 28.4
∗Data from Eijsink et al. (2000).
0 0.2 0.4 0.6 0.8 1
TibesƟ WS BY1 BY2
M
a
ss
fr
a
cƟ
o
n o
f P spe
ci
e
s
Org-P
Ca-P
Fe-P
LIP (a)
0 20 40 60 80 100
TibesƟ WS BY1 BY2
S
o
lu
b
le
P
to
to
ta
l i
n
o
rg
a
n
ic P
, %
Before processing AŌer processing (b)
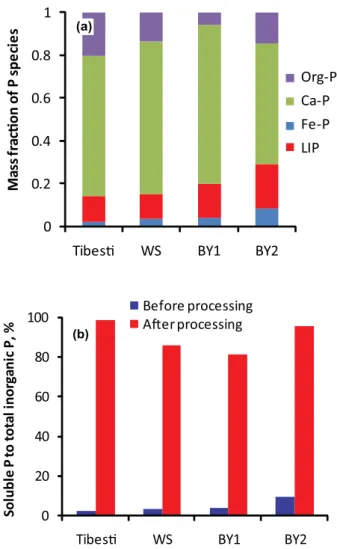
Fig. 3. (a)Phosphorus speciation in Saharan soil and natural Saha-ran dust.(b)The change in soluble P to total inorganic P as a result of simulated atmospheric processing at pH 2 for 24 h.
3.2 Laboratory simulated atmospheric acid processing and analysis
About 10 mg of Tibesti-PM20, Tibesti-PM10, WS-PM20, WS-PM10, BY1 or BY2 were added to 10 ml pH 2 sul-furic acid solution, respectively. The samples were stirred
continuously for 24 h at room temperature. At the end of each experiment, the samples were filtered through 0.2 µm pore size Teflon filters and the solutions taken for subsequent P analysis.
All dissolved phosphorus determinations were carried out by the molybdate-blue method according to Strickland and Parsons (1972) for sea water extractions and Aspila et al. (1976) for all other extractions.
3.3 Interpreting laboratory acidification experiments
In agreement with previous studies (Singer et al., 2004; Ei-jsink et al., 2000), we found that Ca-P was by far the domi-nant form of P in Saharan soil dust (>50 %) while iron-bound P represents less than 20 % (Table 1). LIP represented only 3–10 % of total inorganic P in Saharan soil samples and dry fallout collected during Sahara dust storms (Fig. 3a). Acid treatment of the samples caused a 10–40 times increase of their soluble P fraction of total inorganic P (Fig. 3b). In the Saharan soil and dust samples, 81–96 % of the total inorganic P was released to solution following the acid treatment. Mass balance considerations show that this soluble P was derived from both apatite and iron-bound P. The experimental results overall showed that significant fractions of P present in Saha-ran dust can be solubilised by acidification in the atmosphere. Upon deposition of the aerosols at the sea surface, the solu-bilised P will remain in solution and be available for direct uptake by phytoplankton (Herut et al., 2005). This is in con-trast to soluble iron which precipitates as Fe oxyhydroxide nanoparticles under the alkaline and oxygenated conditions in surface waters (Shi et al., 2009).
4 Conclusions and implications
acknowledged as a major source of new nitrogen (N) to the global ocean (Duce et al., 2008) we propose that anthro-pogenic SO2 and NOx emissions may also increase the
in-put of bioavailable P. Because primary production in marine environments often exhibits a positive synergistic response to simultaneous enrichments in N and P (Elser et al., 2007), SO2 and NOx emissions have the potential to significantly
enhance marine primary production, particularly in offshore areas of the ocean where large amounts of mineral aerosol in-teract with polluted air masses, such as in the EMS, the NW Atlantic or the western Pacific. Similar processes are known to affect the fraction of bioavailable Fe in mineral dust (e.g. Shi et al., 2009, 2011b). The interaction between these two elements in atmospheric aerosols will no doubt be the subject of future research. In the extreme case that 100 % of atmo-spheric P deposition were bioavailable it could, assuming P limitation, account for a yearly global oceanic uptake of CO2
of 264 T moles, that is, more than three times the current CO2
emissions from fossil fuel burning (Mahowald et al., 2008). As shown here, even if total P deposition remains constant, the soluble fraction can significantly increase as a result of aerosol acidification (Fig. 3b).
Soluble P production by aerosol acidification also helps explain the proposed link between episodes of massive volcanism and global ocean anoxia in the geological past (Adams et al., 2010). On geological time scales, ocean pro-ductivity is P limited because the marine biosphere can ac-commodate any long-term nitrogen deficiency by increas-ing nitrogen fixation (Paytan et al., 2007; Tyrell, 1999). A massive release of acidic gases by volcanic activity would then dramatically increase the acid processing of aerosols in the atmosphere (as well as enhance chemical weathering on land). The resulting increase in bioavailable P supply to the oceans would trigger a major increase in primary productiv-ity, which in turn would enhance the supply of organic carbon to the deep ocean eventually resulting in widespread ocean anoxia with its distinctive chemical and isotopic signatures (Adams et al., 2010).
On shorter time scales, the potential also exists for a phytoplankton-mediated feedback between aerosol acidifica-tion and ocean productivity. Under condiacidifica-tions of nutrient stress, marine phytoplankton increase emissions of dimethyl sulfide (DMS) from the surface ocean (Sunda et al., 2002). The DMS then converts to sulphuric and methane-sulfonic acid in the atmosphere (Meskhidze et al., 2003; Barnes et al., 2006). Based on the proposed hypothesis, this would in turn increase atmospheric deposition of bioavailable P, hence alleviating the initial nutrient stress. It would thus appear that atmospheric processes could play a far greater role in the biogeochemical cycling of phosphorus than is currently acknowledged.
Acknowledgements. A. Nenes acknowledges support by NASA ACMAP and a NSF CAREER award. Z. Shi was supported in this work by NERC (NE/E011470/1, PI: Krom). The ideas in this paper developed while M.D. Krom was on sabbatical leave at the Georgia Institute of Technology.
Edited by: M. C. Facchini
References
Adams, D. D., Hurtgen, M. T., and Sageman, B. B.: Volcanic triggering of a biogeochemical cascade during Oceanic Anoxic Event 2, Nat. Geosci., 3, 201–204, 2010.
Aspila, K. I., Agemian, H., Chau, and A. S. Y.: A semi-automated method for the determination of inorganic, organic and total phosphate in sediments, Analyst, 101, 187–197, 1976.
Atlas, E. and Pytkowicz, R. M.: Solubility behavior of apatites in seawater, Limnol. Oceanogr., 22, 290–300, 1997.
Baker, A. R., Jickells, T. D., Biswas, K. F., Weston, K., and French, M.: Nutrients in atmospheric aerosol particles along the Atlantic Meridional Transect, Deep Sea Res., 53(14–16), 1706–1719, 2006.
Bardouki, H., Liakakou, H., Economou, C., Sciare, J., Smolik, J., Zdimal, V., Eleftheriadis, K., Lazaridis, M., Dye, C., and Mi-halopoulos, N.: Chemical composition of size resolved atmo-spheric aerosols in the eastern Mediterranean during summer and winter, Atmos. Environ., 37, 195–208, 2003.
Barnes, I., Hjorth, J., and Mihalopoulos, N.: Dimethyl sulfide and dimethyl sulfoxide and their oxidation in the atmosphere, Chem. Rev., 106, 940–975, 2006.
Brooks, N. and Legrand, M.: Dust variability over northern Africa and rainfall in the Sahel, in: Linking Climate Change to Land Surface Change, edited by: McLaren, S., D. Kniveton Kluwer Acad., Dordrecht, 1–26, 2002.
Capaldo, K. P., Pilinis, C., and Pandis, S. N.: A computationally efficient hybrid approach for dynamic gas/aerosol transfer in air quality models, Atmos. Environ., 34, 3617–3627, 2000. Duce, R. A., LaRoche, J., Altieri, K., Arrigo, K. R., Baker, A.
R., Capone, D. G., Cornell, S., Dentener, F., Galloway, J., Ganeshram, R. S., Geider, R. J., Jickells, T., Kuypers, M. M., Langlois, R., Liss, P. S., Liu, S. M., Middelburg, J. J., Moore, C. M., Nickovic, S., Oschlies, A., Pedersen, T., Prospero, J., Schlitzer, R., Seitzinger, S., Sorensen, L. L., Uematsu, M., Ulloa, O., Voss, M., Ward, B., and Zamora, L.: Impacts of atmospheric nitrogen on the open ocean, Science, 320, 893–897, 2008. Eijsink, L. M., Krom, M. D., and Herut, B.: Speciation and
burial flux of phosphorus in the surface sediments of the eastern Mediterranean, Am. J. Sci., 300(6), 483–504, 2000.
Elser, J. J., Bracken, M. E. S., Cleland, E. E., Gruner, D. S., Har-pole, W. S., Hillebrand, H., Ngai, J. T., Seabloom, E. W., Shurin, J. B., and Smith, J. E.: Global analysis of nitrogen and phos-phorus limitation of primary producers in freshwater, marine and terrestrial ecosystems, Ecol. Lett., 10, 1135–1142, 2007. Fountoukis, C. and Nenes, A.: ISORROPIA II: a
computation-ally efficient thermodynamic equilibrium model for K+- Ca2+
- Mg2+- NH+
4 - Na
+- SO2−
4 - NO3−- Cl−- H2O aerosols,
Fountoukis, C., Nenes, A., Sullivan, A., Weber, R., Van Reken, T., Fischer, M., Matas, E., Moya, M., Farmer, D., and Cohen, R. C.: Thermodynamic characterization of Mexico City aerosol during MILAGRO 2006, Atmos. Chem. Phys., 9, 2141–2156, doi:10.5194/acp-9-2141-2009, 2009.
Hershey, J. P., Fernandez, M., and Millero, F. J.: The dissociation of phosphoric acid in NaCl and NaMgCl solutions at 25◦C, J.
Solution Chem., 18, 875–891, 1989.
Herut, B., Zohary, T., Krom, M. D., Mantoura, R. F. C., Pitta, P., Psarra, S., Rassoulzadegan, F., Tanaka, T., and Thingstad, T. F.: Response of East Mediterranean surface water to Sahara dust: On-board microcosm experiment and field observations, Deep-Sea Res. II, 52, 3024–3040, 2005.
Howarth, R. W.: Nutrient limitation of net primary production in marine ecosystems, Ann. Rev. Ecol., 19, 89–110, 1988. Jahnke, R. A.: The synthesis and solubility of carbonate
fluorap-atite, Am. J. Sci., 284, 58–78, 1984.
Krom, M. D., Brenner, S., Kress, N., and Gordon, N. L. I.: Phospho-rus limitation of Primary Productivity in the E. Mediterranean sea, Limnol. Ocean.,36(3), 424–432, 1991.
Krom, M. D., Herut, B., and Mantoura, R. F. C.: Nutrient bud-get for the Eastern Mediterranean: Implications for P limitation, Limnol. Ocean., 49, 1582–1592, 2004.
Loo, B. W. and Cork, C. P.: Development of high efficiency virtual impactor, Aerosol Sci. Technol., 9, 167–170, 1988.
Mahowald, N., Jickells, T. D., Baker, A. R., Artaxo, P., Benitez-Nelson, C. R., Bergametti, G., Bond, T. C., Chen, Y., Cohen, D. D., Herut, B., Kubilay, N., Losno, R., Luo, C., Maenhaut, W., McGee, K. A., Okin, G. S., Siefert, R. L., and Tsukuda, S.: Global distribution of atmospheric phosphorus sources, concen-trations and deposition rates, and anthropogenic impacts, Global Biogeochem. Cy., 22, GB4026, doi:10.1029/2008GB003240, 2008.
Meskhidze, N., Chameides, W. L., Nenes, A., and Chen, G.: Iron mobilization in mineral dust: Can anthropogenic SO2emissions affect ocean productivity?, Geophys. Res. Lett., 30(21), 2085, doi:10.1029/2003GL018035, 2003.
Mihalopoulos, N., Stephanou, E., Pilitsidis, S., Kanakidou, M., and Bousquet, P.: Atmospheric aerosol composition above the East-ern Mediterranean region, Tellus, 49B, 314–326, 1997. Millero, F. J. and Schreiber, D. R.: Use of the ion pairing model to
estimate activity coefficients of the ionic components of natural waters, Am. J. Sci., 282, 1508–1540, 1982.
Nenes, A., Pilinis, C., and Pandis, S. N.: ISORROPIA: A New Thermodynamic Model for Multiphase Multicomponent Inor-ganic Aerosols, Aquat. Geochem., 4, 123–152, 1998.
Newman, E. I.: Phosphorus inputs to terrestrial ecosystems, J. Ecol., 83, 713–726, 1995.
Nezat, C. A., Blum, J. D., Yanai, R. D., and Hamburg, S. P.: A sequential extraction to determine the distribution of apatite in granitoid soil mineral pools with application to weathering at the Hubbard Brook Experimental Forest, NH, USA, Appl. Geochem., 22, 2406–2421, 2007.
Paytan, A. and McLaughlin, K.: The oceanic phosphorus cycle, Chem. Rev., 107, 563–576, 2007.
Prospero, J. M., Ginoux, P., Torres, O., Nicholson, S. E., and Gill, T. E.: Environmental characterization of global sources of at-mospheric soil dust dandified with the NIMBUS 7 Total Ozone Mapping Spectrometer (TOMS) absorbing aerosol product, Rev.
Geophys., 40(1), 1002, doi:10.1029/2000RG000095, 2002. Ruttenberg, K.: Development of a sequential extraction method
for different forms of phosphorus in marine sediments, Limnol. Oceanogr., 37, 1462–1482, 1992.
Sciare, J., Bardouki, H., Moulin, C., and Mihalopoulos, N.: Aerosol sources and their contribution to the chemical composition of aerosols in the Eastern Mediterranean Sea during summertime, Atmos. Chem. Phys., 3, 291–302, doi:10.5194/acp-3-291-2003, 2003.
Seinfeld, J. H. and Pandis, S. N.: Atmospheric chemistry and physics: from air pollution to climate change, John Wiley & Sons Inc, New York, 2006.
Shi, Z. B., Krom, M. D., Bonneville, S., Baker, A. R., Jickells, T. D., and Benning, L. G.: Formation of iron nanoparticles and increase in iron reactivity in the mineral dust during simulated cloud processing, Environ. Sci. Technol., 43, 6592–6596, 2009. Shi, Z., Krom, M., Bonneville, S., Baker, A., Bristow, C., Drake,
N., Mann, G., Carslaw, K., McQuaid, J., Jickells, T., and Ben-ning, L.: Chemical weathering controls Fe solubility in the dust deposited to the ocean, Global Biogeochem. Cy., 25, GB2010, doi:10.1029/2010GB003837, 2011a.
Shi, Z., Bonneville, S., Krom, M. D., Carslaw, K. S., Jickells, T. D., Baker, A. R., and Benning, L. G.: Iron dissolution kinet-ics of mineral dust at low pH during simulated atmospheric pro-cessing, Atmos. Chem. Phys., 11, 995–1007, doi:10.5194/acp-11-995-2011, 2011b.
Singer, A., Dultz, S., and Argaman, E.: Properties of the non-soluble fractions of suspended dust over the Dead Sea, tmos. Environ. 38, 1745–1753, 2004.
Spokes, J. L, Jickells, T. D., and Lim, B.: Solubilisation of aerosol trace metals by cloud processing: A laboratory study, Geochim. Cosmochim. Acta, 58, 3281–3287, 1994.
Stumm, W. and Morgan, J. J.: Aquatic Chemistry, Wiley-Interscience, New York, 1996.
Strickland, J. D. H. and Parsons, T. R.: A practical handbook of sea-water analysis, J. Fish. Res. Bd. Canada, 167, 1–311, 1972. Sunda, W., Kieber, D. J., Kiene, R. P., and Huntsman, S.: An
an-tioxidant function for DMSP and DMS in marine algae, Nature, 418, 317–320, 2002.
Tyrell, T.: The relative influences of nitrogen and phosphorus on oceanic primary production, Nature, 400, 525–531, 1999. Van Cappellen, P. and Berner, R. A.: Fluorapatite crystal growth
from modified seawater solutions, Geochim. Cosmochim. Acta, 55, 1219–1234, 1991.
Washington, R., Bouet, C., Cautenet, G., Mackenzie, E., Ashpole, I., Engelstaedter, S., Lizcano, G., Henerson, G. M., Schepanski, K., and Tegen, I.: Dust as a tipping element: The Bod`el`e De-pression, Chad, Proc. Natl. Acad. Sci., 106(49), 20564–20571, doi:10.1073/pnas.0711850106, 2009.
![Fig. 1. Distributions of key acidic aerosol species in the Finokalia data set. Shown are the concentrations of (a) nitrate and (b) sulfate against the “ion balance”, I b , calculated as I b = 2[SO 4 ] + [H 2 PO 4 ] + [NO 3 ] + [Cl] − 2[Ca] − [NH 4 ] − [Na]](https://thumb-eu.123doks.com/thumbv2/123dok_br/18291439.346662/4.892.485.794.95.582/distributions-aerosol-species-finokalia-concentrations-nitrate-balance-calculated.webp)