Key words:
Prostatic Neoplasms; Magnetic Resonance Spectroscopy; Diagnosis
Int Braz J Urol. 2013; 39: 155-66
__________________ Submitted for publication: December 10, 2012
__________________ Accepted after revision: April 02, 2013
Objective: Systematic review of literature and meta-analysis to evaluate the results of magnetic resonance image 1.5T with endorectal coil in the diagnosis and evaluation of extra-prostatic extension and involvement of seminal vesicles of prostate cancer, compa-red to the histopathological results of the radical prostatectomy specimen.
Materials and Methods: It was conducted a systematic review of literature and meta--analyses of all studies data published after 2008. In those studies, the patients with prostate cancer with indication to radical prostatectomy were submitted to magnetic resonance image (MRI) at pre-operatory period and the results were compared to those of histopathological studies after the surgery. The selected terms for research included pros-tate cancer, magnetic resonance, radical prospros-tatectomy, and prospros-tate cancer diagnosis, in the databases EMBASE, LILACS, PUBMED/MEDLINE and Cochrane Library. The data were collected using a specific qualitative instrument and the meta-analysis data were presented in the forest plot graphics, homogeneity test and sROC curves and funnel plot.
Results: A total of seven studies were included, with a total of 603 patients. Among the-se studies, six evaluated the value of MRI for the detection of prostate cancer, and the median sensitivity of meta-analysis was 0.6 and specificity 0.58, but with heterogenei-ty among the studies. Three studies evaluated extra-prostatic extension with a median sensitivity of 0.49, specificity 0.82 and heterogeneity only for sensitivity. Three studies evaluated invasion of seminal vesicles, with median sensitivity of 0.45 and specificity 0.96, with heterogeneity in both analysis.
Conclusion: Magnetic resonance of 1.5T with endocoil showed low values of sensitivity and specificity for the diagnosis and staging of prostate cancer. The reviewed studies showed a significant heterogeneity among them. The best observed result was MRI speci-ficity for invasion of seminal vesicles. More studies are necessary to evaluate new tech-niques and parameters before recommending the routine use of MRI in clinical practice.
INTRODUCTION
Prostate cancer (PC) is the most frequent malign tumor among men older than 50 years and
presents a tendency of increase in the next deca-des due to the rise of life expectancy (1).
Although the natural history of the disease is not completed understood, several prognostic
Magnetic Resonance Image in the diagnosis and
evaluation of extra-prostatic extension and involvement
of seminal vesicles of prostate cancer: a systematic
review of literature and meta-analysis
_______________________________________________
Rogério Cardoso da Silva, André Deeke Sasse, Wagner Eduardo Matheus, Ubirajara Ferreira
Department of Uro-oncology (RCS, WEM, UF) and Center of Oncologic Evidences (ADS), Universidade Estadual de Campinas, UNICAMP, Campinas, Brazil
ABSTRACT
ARTICLE
INFO
factors influence the evolution of PC. Among the-se, some are very important: histological grade, PSA level, tumor volume and extension of the di-sease (2,3).
There is a lack of consensus in clinical practice regarding diagnostic, staging and treat-ment techniques that may lead to excessive and unnecessary image exams with increasing costs, waste of time and excessive exposure to ionizing radiation (depending upon the used method) (4,5).
Magnetic resonance image (MRI) with en-dorectal coil is the most accepted diagnostic me-thod for the evaluation of the prostate tumor, with the advantage of not exposure to ionizing radia-tion. But there are still several doubts regarding its usefulness and real applicability.
The objective of the present study was the systematic review (SR) of studies that used MRI with conventional 1.5T images in the diagnosis and staging of PC compared to the results of his-topathological studies of the radical prostatecto-mies (RP).
It was performed a systematic meta-analy-ses, including sensitivity and specificity, compa-ring the results regarding diagnosis, evaluation of extra-prostatic extension (EPE) and invasion of seminal vesicles (ISV).
MATERIALS AND METHODS
We selected studies in which MRI was used for PC diagnosis, extension of extra-prostatic di-sease evaluation and involvement of seminal ve-sicles compared to histopathological studies of RP. We included clinical trials with the follo-wing inclusion criteria: transversal studies publi-shed after 2008 and all patients presenting PC at biopsy with indication of RP without previous tre-atment. All patients should have been submitted to MRI previous to surgery with conventional 1.5T images.
The following databases were reviewed
“neoplasms”[AllFields]) OR “prostaticneoplasms ”[AllFields]) AND (“prostatectomy”[MeSHTerms] OR “prostatectomy”[AllFields]) AND (“magn eticresonancespectroscopy”[MeSHTerms] OR (“magnetic”[AllFields] AND “resonance”[AllFields] AND “spectroscopy”[AllFields]) OR “magn
eticresonancespectroscopy”[AllFields] OR (“magnetic”[AllFields] AND “resonance”[AllFields])
OR “magneticresonance”[AllFields]))AND Diagno-sis/Narrow[filter]. The same search strategy was adapted for the remaining databases. There was no restriction of the published language. Two independent researchers selected the papers and collected the relevant data. For this purpose, it was used a data collection protocol, depicting the studies characteristics and the collected results. In order to solve any possible disagreements between the researchers, a third one was convened.
To evaluate the individual quality of the stu-dies it was used the question form QUADAS (Quali-ty Assessment of Diagnostic Accuracy Studies). The questions included the main sources of bias and each question should have been answered with “yes”, “no”, “not clear”. The greatest the number of negati-ve or not clear answers, the worst was the quality of the study (6).
Meta-analysis and presentation of results
We used the following software for the me-ta-analysis: RevMan version 6 (Cochrane) and Meta DiSc 1.4. The presentation of the results used four statistical tools: forest plot, homogeneity test, sROC curve and funnel plot.
1. Forest plot: it was used a statistical combi-nation of sensitivity and specificity of each study, obtaining a median integrated value (pooling) (7).
2. Homogeneity tests: it was used the chi--square test (Q), and the inconsistency index (I-squared, I2) to estimate the heterogeneity
sugges-Figure 1 - Organogram of the selected, examined and inclu-ded studies of SR.
of the different studies. AUC (area under the curve) summarizes the quality of the curve, representing an index of accuracy of the test. A test with low performance has AUC < 0.5 and a satisfactory one AUC > 0.70. Q* evaluates the point at the sROC curve where sensitivity and specificity are equal, being equivalent to the point of symmetry of the sROC curve. If Q* is ≤ 0.5 the test is not wor-th for wor-the studied evaluation and as much Q* approaches 1.0 the best performance has the test (9).
4. Funnel plot: the published bias can be de-tected by the use of the funnel plot chart, in which the size of the sample is the strongest correlate of the bias of the publication. In the absence of bias, the data have a more fun-neled symmetric distribution. The presence of a not symmetric funneled distribution in-dicates the presence of bias of publication (10,11). Cochran-Q with P < 0.05 suggests the presence of heterogeneity beyond what expected singly. I-squared (I2) describes the
percentage of variability effect due to hete-rogeneity and not due to random distribu-tion. I2 > 50% disclose heterogeneity. T2
esti-mates variability among studies, and T2 > 1
suggests heterogeneity (10,11).
RESULTS
General Aspects
Using the search terms, 234 summaries were selected from the online databases. After careful eva-luation of the summaries, 27 articles were selected for careful review, and after that, 20 were excluded. The main causes of exclusion of the 20 articles included: 6 with any previous treatment prior do RP, 4 without correct identification of the use of the endocoil, 5 without sufficient data for the calculus of sensitivity and specificity. Seven studies were selected, 6 in En-glish and 1 in German (Figure-1).
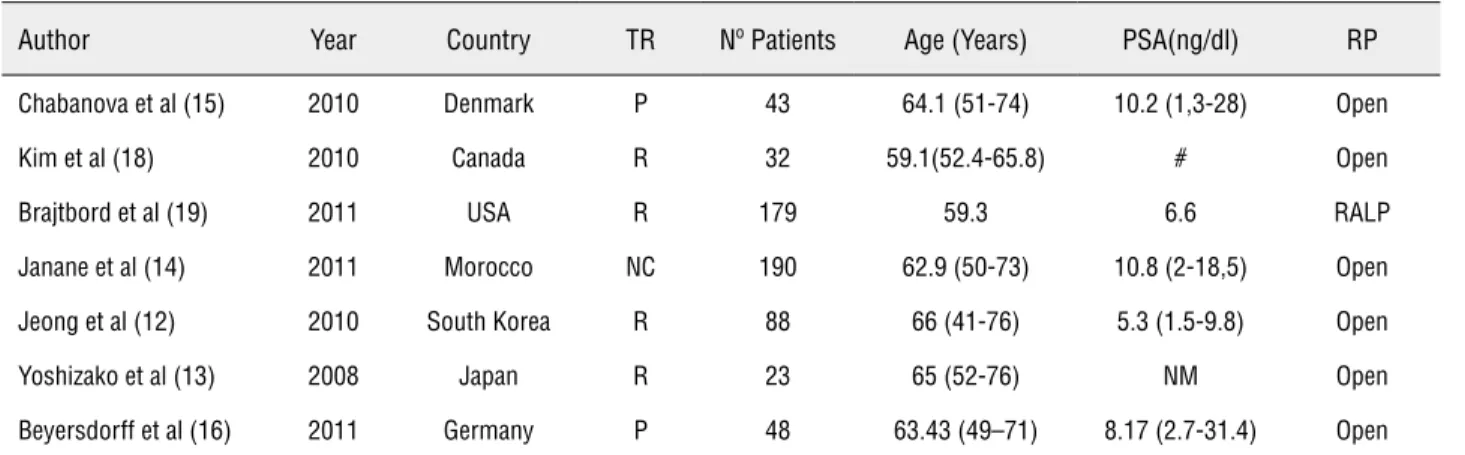
All seven selected studies were transversal (without calculus of the size sample), unicentric (one only institution involved) and summed 603 patients (Table-1).
Most studies were considered with good con-sistency after the use of QUADAS question form,
sin-ce there were mainly “yes” answers after methodolo-gical evaluation (greater than 50% of the answers). The question “if the results of the gold-standard test (histopathological study of RP) were interpreted wi-thout the knowledge of the test being evaluated (pre--operatory MRI)” had not a satisfactory answer.
Analysis of the diagnosis of PC
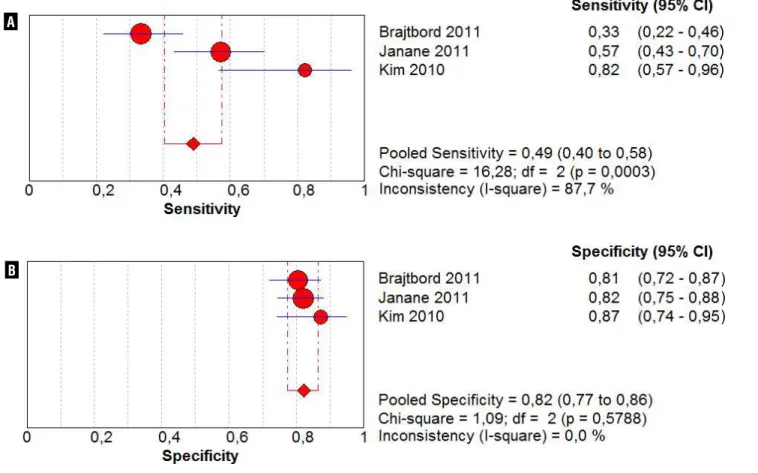
Six of the seven selected articles studied the capacity of MRI with endocoil and 1.5T con-ventional images to diagnose PC. The mean sensi-tivity of this meta-analysis was 0.6 and specificity 0.58 (the data were obtained from the florest plot).
The homogeneity test for sensibility and specificity showed Q = 36.49 (P = 0.000), I2 =
86.3% and Q = 24.89 (P = 0.0001), I2 = 79.9%,
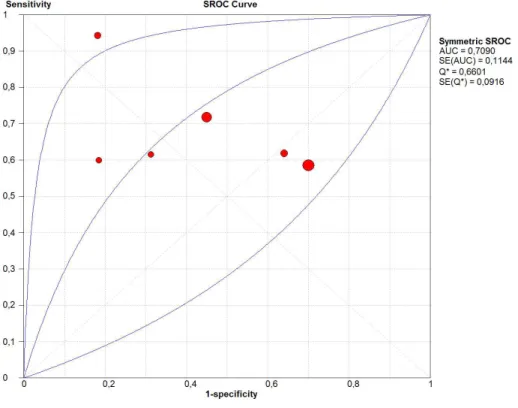
res-pectively (Figures 2a and 2b). sROC curve showed AUC = 0.7090 and Q* = 0.6601(Figure-3).
Funnel plot showed Cochran-Q = 26.80 (P = 0.0001), I2 = 81.3% and T2 = 1.1861 (Figure-4).
There was a tendency of displacement of the gra-phic symmetry to the right demonstrating hetero-geneity in the statistical parameters of the Q test of Cochran, I2 and T2.
234 articles were selected in the online researched
sources
207 summaries were excluded (didn’t match the purpose
of the SR)
20 studies were excluded (didn’t match the purpose
of the SR) 27 studies were
totally reviewed
Figure 2 - Forest plot of sensitivity and specificity regarding the diagnosis of PC. Table 1 - Summarized data of the studies used in the SR.
Author Year Country TR Nº Patients Age (Years) PSA(ng/dl) RP
Chabanova et al (15) 2010 Denmark P 43 64.1 (51-74) 10.2 (1,3-28) Open
Kim et al (18) 2010 Canada R 32 59.1(52.4-65.8) # Open
Brajtbord et al (19) 2011 USA R 179 59.3 6.6 RALP
Janane et al (14) 2011 Morocco NC 190 62.9 (50-73) 10.8 (2-18,5) Open
Jeong et al (12) 2010 South Korea R 88 66 (41-76) 5.3 (1.5-9.8) Open
Yoshizako et al (13) 2008 Japan R 23 65 (52-76) NM Open
Beyersdorff et al (16) 2011 Germany P 48 63.43 (49–71) 8.17 (2.7-31.4) Open
# < 10 ⇒ 2 patients; 10-20 ⇒ 5 patients; > 20 ⇒ 5 patients; RALP; Robotic assisted
TR: Temporal relation; P: prospective, R: retrospective, NC: not clear; RP: Radical prostatectomy; NM: Not mentioned
A
B )
Figure 3 - sROC curve depicting the representation of sensitivity versus 1-specificity of the diagnosis of PC.
Figure 4 - Funnel plot of the studies regarding the diagnosis of PC.
Figure 5 - Florest plot of sensitivity and specificity for EPE.
A
B
Analysis of EPE
Three of the seven studies evaluated the ca-pacity of MRI with conventional 1.5T images to de-tect EPE, with a median sensibility of 0.49 and spe-cificity of 0.82.
The homogeneity test for sensitivity and spe-cificity showed Q = 16.28 (P = 0.0006), I2 = 87.7%
and Q = 1.09 (P = 0.5799), I2 = 0.0%, respectively
(Fi-gures 5a and 5b). sROC curve showed AUC = 0.9298 and Q* = 0.8649 (Figure-6).
The statistical calculi in the funnel plot were: Cochran-Q = 12.03 (P < 0.05), I2 = 83.4% and T2 =
0.9707. P < 0.05 suggested the presence of heteroge-neity in the individual studies far from what would be expected singly. I2 > 50% gave a dimension of
the percentage of total variation of the studies due to heterogeneity (Figure-7).
Analysis of SVI
The same three articles that evaluated EPE also evaluated SVI with 1.5T conventional images
and showed a median sensitivity of 0.45 and speci-ficity 0.96.
The result of the homogeneity test for sensiti-vity was Q = 9.98 (P = 0.0068) and I2 = 80.0%, while
for specificity Q = 8.91 (P = 0.0116) and I2 = 77.6%
(Figures 8a and 8b). sROC curve: AUC = 0.9241 and Q* = 0.8581 (Figure-9).
Funnel plot obtained Cochran-Q = 5.73 (P = 0.0570), I2 = 65.1% and T2 = 1.1657. P = 0.05 and I2
lightly over 50% suggested the presence of discre-te hediscre-terogeneity of the individual studies far from what expected singly. T2 > 1 suggested heterogeneity
among the studies (Figure-10).
Funnel plot showed asymmetric format, su-ggesting the presence of bias publication (chance reasons away from the baseline vertical 1). Graphic with asymmetric tendency P = 0.0570 (limit of the significance statistical level), I2 > 50% and T2 > 1
sug-gesting heterogeneity of the single studies, due to the variability of the size sample of each paper and due to the threshold effect for the diagnosis of SVI (9,10).
A
B
) ) )
Figure 6 - sROC curve depicting the representation of the sensitivity versus 1-specificity of EPE.
Figure 7 - Funnel plot of the studies regarding EPE.
DISCUSSION
In this SR all studies compared the histo-pathological results with pre-operatory MRI. Al-though there were more than 200 studies about MRI in the diagnosis and staging of PC, only se-ven were selected to evaluate pre-operatory 1.5T MRI in patients submitted to RP compared to his-topathologic results.
This limited number of studies must be analyzed carefully and will always evoke serious thoughts during systematic reviews, due to the small number of well elaborated articles, with a clear methodology and scientific relevance.
(28.57%) were prospective and none of them in-formed financial disclosures. In spite of that, the analysis of quality of the studies using the QUA-DAS question form demonstrated that most ques-tions regarding the study (more than 50%) were answered “yes”, suggesting that the quality of the studies was adequate.
Although independent, a few characteris-tics of the studies were the same in all, such as lack of previous treatment before PR, the use of 1.5T conventional images of MRI and a period of more than a month between the prostatic biopsy and RP surgery.
The difference of the values of sensitivity Figure 8 - Florest plot of sensitivity and specificity regarding VSI.
A
B
) ) )
Figure 9 - sROC curve depicting the representation of the sensitivity versus 1-specificitity of VSI.
Figure 10 - Funnel plot of the studies regarding VSI.
categories: cancer certainly absent, cancer bly absent, cancer possibly present, cancer proba-bly present and cancer certainly present (12,13). Other authors categorized in two options: presen-ce or absenpresen-ce of canpresen-cer. Also, in only those two studies it was clear that the radiological evalua-tion was made by two well trained radiologists. Another aspect is the lack of standardization of the radiological parameters for the diagnosis of PC used by most studies, and some actually don’t mention them. Finally, the size of the tumor was not considered for the diagnosis of PC, except on the study of Janane et al. (14).
Chabanova et al. studied conventional images of MRI and spectroscopy and perfusion methods in the diagnosis of PC. In relation to spectroscopy, they found sensitivity of 0.46 and specificity of 0.78. In relation to perfusion, sen-sitivity and specificity were respectively 0.48 and 0.68. They demonstrated that the combination of conventional MRI, spectroscopy and perfusion could diagnose all patients with PC, indicating a positive combination of the three methods. Howe-ver, this association is expensive and troublesome, and can derail the routine use of MRI (15).
Yoshizako et al. also studdied the combi-nation of conventional MRI images with difusion and perfusion. The combination of conventional MRI and diffusion showed sensitivity of 0.80 and specificity of 0.87, and when combined with per-fusion showed sensitivity of 0.69 and specificity of 0.68. The combination of the three methods showed sensitivity of 0.69 and specificity of 0.93. The combination of the three methods was more accurate for the diagnosis of PC than conventio-nal MRI alone, but this data referred only to PC of the prostatic transition zone (13).
Jeong et al. studied the conventional ima-ges and the combination of them with the diffu-sion method and found sensitivity and specificity of 0.87 and 0.72 respectively. The authors did not
(0.82) (16). The heterogeneity of the studies can be explained by the variable size of the sample of each study, by the different criteria to diagnose PC using MRI and by the different studied popula-tions of each study (8).
The suspicion of EPE at MRI is made by specific signs, as the presence of solid tissue in the periprostatic fat, irregular bulging of the prostatic capsule and obliteration of the retoprostatic angle, as well as non-specific signs as capsular thicke-ning, capsular retraction and regular bulging of the capsule (17).
The values of sensitivity of the three stu-dies that evaluated EPE are different, leading to a considerable heterogeneity of the individual stu-dies (P < 0.05 and I2 greater than 50%) and
me-dium of 0.49 (CI 95%: 0.40 - 0.58).
Kim et al. considered EPE the presence of obliteration of the retoprostatic angle, blurring of the periprostatic fat, invasion of the neurovascu-lar bundle or transcapsuneurovascu-lar tumor continuation (18). Janane et al also included discontinuity of the prostatic capsule, obliteration of the prostatic veins and a distance between the tumor and the prostatic capsule equal or superior to 1 cm (14). Brajtbord et al didn’t disclosure the used criteria to consider the presence of EPE as a positive MRI (19).
Another important aspect was that the analyzed populations were different among the revised studies. Janane et al included a particu-lar north-african population and didn’t mention the categorization of the population according to extra-prostatic risk of the disease (14). Kim et al excluded low risk patients and included only high or intermediate risk patients (18). Brajtbord et al didn’t state the categorization risk, although pre-sented the histopathological results: Gleason < 7: 13%, Gleason = 7: 69%, Gleason > 7: 16% (19).
extra-the two oextra-thers, with heterogeneity (P < 0.05 and I2 >
50%). Kim et al worked exclusively with intermediate and high risk patients, increasing the MRI sensitivity in relation to the two other authors (18).
When evaluating the specificity, each in-dividual study presented results greater than 0.9, with a median of 0.96 (IC 95%: 0.93 - 0.98). Kim et al suggested the presence of VSI when there was a low intensity sign causing dilation and an asymmetric gland (18). Janane et al identified the VSI as the focal shortening of the wall or the pre-sence of low intensity sign inside the vesicles (14). Brajtford et al only informed presence or absence of VSI (17).
In this SR, it is concluded that MRI with 1.5T conventional images using endorectal coil should not be routinely used in all patients with PC. It should only be used as a complementary method for the diagnosis and staging of the disea-se and indicated for only specific patients.
More studies evaluating new technologies (for example, 3T MRI) and multiple parameters (diffusion, perfusion and spectroscopy) are neces-sary before recommending the routine use of MIR in clinical practice.
CONCLUSIONS
There are very few good studies comparing pre-operatory pelvic MRI using 1.5T conventional images and histopathological results of patients with PC submitted to RP. Also, the analysed stu-dies showed a significant heterogeneity. The best results of SR are related to specificity for VSI. This SR suggests that 1.5T MRI using endorectal coil is not indicated routinely for the diagnosis and staging of patients with PC.
CONFLICT OF INTEREST
None declared.
REFERENCES
1. Hsing AW, Chokkalingam AP: Prostate cancer epidemiology. Front Biosci. 2006; 11: 1388-413.
2. Chodak GW: The role of watchful waiting in the management of localized prostate cancer. J Urol. 1994; 152: 1766-8. 3. Dodds PR, Caride VJ, Lytton B: The role of vertebral veins
in the dissemination of prostatic carcinoma. J Urol. 1981; 126: 753-5.
4. Lorente JA, Morote J, Raventos C, Encabo G, Valenzuela H: Clinical efficacy of bone alkaline phosphatase and pros-tate specific antigen in the diagnosis of bone metastasis in prostate cancer. J Urol. 1996; 155: 1348-51.
5. Abuzallouf S, Dayes I, Lukka H: Baseline staging of newly diagnosed prostate cancer: a summary of the literature. J Urol. 2004; 171: 2122-7.
6. Iared W, Valente O: Revisões sistemáticas de estudos de acurácia. Diagn Tratamento. 2009; 14: 85-8.
7. Moher D, Cook DJ, Eastwood S, Olkin I, Rennie D, Stroup DF: Improving the quality of reports of meta-analyses of randomised controlled trials: the QUOROM statement. Quality of Reporting of Meta-analyses. Lancet. 1999; 354: 1896-900.
8. Higgins JP, Thompson SG, Deeks JJ, Altman DG: Measuring inconsistency in meta-analyses. BMJ. 2003; 327: 557-60. 9. Walter SD: Properties of the summary receiver operating
characteristic (SROC) curve for diagnostic test data. Stat Med. 2002; 21: 1237-56.
10. Egger M, Smith GD: Bias in location and selection of stud-ies. BMJ. 1998; 316: 61-6.
11. Moayyedi P: Meta-analysis: Can we mix apples and orang-es? Am J Gastroenterol. 2004; 99: 2297-301.
12. Jeong IG, Kim JK, Cho KS, You D, Song C, Hong JH, et al.: Diffusion-weighted magnetic resonance imaging in pa-tients with unilateral prostate cancer on extended prostate biopsy: predictive accuracy of laterality and implications for hemi-ablative therapy. J Urol. 2010, 184: 1963-9. 13. Yoshizako T, Wada A, Hayashi T, Uchida K, Sumura M,
Uchida N, et al.: Usefulness of diffusion-weighted imaging and dynamic contrast-enhanced magnetic resonance imag-ing in the diagnosis of prostate transition-zone cancer. Acta Radiol. 2008; 49: 1207-13.
14. Janane A, Hajji F, Ismail TO, Elondo JC, Ghadouane M, Ameur A, et al.: WITHDRAWN: Endorectal MRI accuracy in augur-ing tumour location, tumour extent, capsular perforation and seminal vesicle invasion of prostate cancer in north-African men. Eur J Radiol. 2011; 26. [Epub ahead of print]
15. Chabanova E, Balslev I, Logager V, Hansen A, Jakobsen H, Kromann-Andersen B, et al.: Prostate cancer: 1.5T endo-coil dynamic contrast-enhanced MRI and MR spectros-copy--correlation with prostate biopsy and prostatectomy histopathological data. Eur J Radiol. 2011; 80: 292-6. 16. Beyersdorff D, Lüdemann L, Dietz E, Galler D, Marchot P,
17. Yu KK, Hricak H, Alagappan R, Chernoff DM, Bacchetti P, Za-loudek CJ: Detection of extracapsular extension of prostate carcinoma with endorectal and phased-array coil MR imaging: multivariate feature analysis. Radiology. 1997; 202: 697-702. 18. Kim B, Breau RH, Papadatos D, Fergusson D, Doucette S,
Ca-giannos I, et al.: Diagnostic accuracy of surface coil magnetic resonance imaging at 1.5 T for local staging of elevated risk prostate cancer. Can Urol Assoc J. 2010; 4: 257-62.
19. Brajtbord JS, Lavery HJ, Nabizada-Pace F, Senaratne P, Sa-madi DB: Endorectal magnetic resonance imaging has limited clinical ability to preoperatively predict pT3 prostate cancer. BJU Int. 2011; 107: 1419-24.
20. Epstein JI, Chan DW, Sokoll LJ, Walsh PC, Cox JL, Rittenhouse H, et al.: Nonpalpable stage T1c prostate cancer: prediction of insignificant disease using free/total prostate specific antigen levels and needle biopsy findings. J Urol. 1998; 160: 2407-11.
_____________________
Correspondence address: Dr. Rogério Cardoso da Silva Department of Uro-oncology, Universidade Estadual de