Monounsaturated fatty acid intake and lipid metabolism
Ingestão de ácidos graxos monoinsaturados e metabolismo lipídico
Lílian Lelis Lopes1, Maria do Carmo Gouveia Peluzio1, Helen Hermana Miranda Hermsdorf1
*
Abstract
he objective of this review is to present and discuss the most recent indings related to the efects of monounsaturated fatty acids (MUFA) on plasma markers of lipid metabolism observed in postprandial studies and clinical nutritional intervention studies. Searches were conducted on several diferent databases for publications from 2010 to 2014 using the following keywords: MUFA, Lipemia, Lipid Metabolism, Triglycerides and Postprandial. High-MUFA meal has presented beneicial efect on postprandial lipidemia response, but it is not yet completely clear whether this response to MUFA intake may be diferent in people with excess weight and/or other chronic diseases. In general, cardiovascular risk factors were reduced and lipid proiles improved after interventions with MUFA. In conclusion, recent studies have demonstrated that consuming MUFA has beneicial efects at short and long time by increasing/ maintaining HDL cholesterol concentrations and reducing levels of LDL cholesterol.
Keywords: monounsaturated fatty acids; triacylglycerol; oleic acid; cardiovascular diseases.
Resumo
Esta revisão teve como objetivo apresentar e discutir os achados mais recentes do efeito dos ácidos graxos monoinsaturados (AGMI) sobre marcadores plasmáticos do metabolismo lipídico em estudos pós-prandiais e de intervenção clínica nutricional. Realizou-se busca em diferentes bases de dados entre 2010 e 2014, usando os seguintes termos de indexação: MUFA, Lipemia, Lipid Metabolism, Triglycerides e Postprandial. O consumo de refeição com alto conteúdo de AGMI tem demonstrado efeito benéico na resposta lipidêmica pós-prandial, mas se essa resposta pode ser alterada em indivíduos com excesso de peso e/ou outras doenças crônicas após consumo de AGMI, ainda não está totalmente elucidado. De modo geral, após a intervenção com AGMI, os fatores de risco cardiovascular diminuíram, além de haver melhora no peril lipídico. Em conclusão, os estudos recentes têm demonstrado um efeito benéico do consumo de AGMI em curto e longo prazos, mediante aumento/manutenção das concentrações de HDL colesterol e diminuição do LDL colesterol.
Palavras-chave: ácidos graxos monoinsaturados; triacilgliceróis; ácido oleico; doenças cardiovasculares.
1 Universidade Federal de Viçosa – UFV, Department of Nutrition and Health, Viçosa, MG, Brazil.
Financial support: FAPEMIG and CNPq.
Conlicts of interest: No conlicts of interest declared concerning the publication of this article. Submitted: October 23, 2015. Accepted: January 18, 2016.
INTRODUCTION
Cardiovascular diseases (CVD) are notorious and are the subject of much discussion in clinical practice. However, a great deal of what is known about these diseases and their risk factors is based on the results of assaying markers of lipid metabolism in a fasting state. While these tests are undoubtedly important, we spend the majority of our lives in a non-fasting state and, as a result, there is constant variation in
lipemia levels.1
In turn, postprandial metabolism has been linked with
increases in inlammation and oxidation, interfering
in vascular endothelial function and impacting on
CVD risk.2 Despite this, the postprandial response to
lipid overload has not yet been well established and
published indings remain controversial.
In this context, dietary lipids are important factors
in modulation of postprandial lipemia, which is a possible early marker of metabolic abnormalities
that are not observed in a fasting state.2 When we eat
a meal containing excessive quantities of lipids, the body is faced with an excess of triacylglycerols (TAG) and their removal becomes ineficient, resulting in
a state of postprandial lipemia,3 which is associated
with CVD.4
One of the subgroups of fatty acids of greatest
interest is the monounsaturated fatty acids (MUFA), of which oleic acid (OA) is the principal member. These fatty acids are found in olive oil, in canola
oil, in olives, avocadoes and in oleaginous plants.5
However, OA contained in olive oil (from 55 to 85%) can account for from 60 to 80% of the entire daily dietary intake of OA.6
The objective of this review is to present and discuss the most recent indings related to the effects of monounsaturated fatty acids (MUFA)
on plasma markers of lipid metabolism observed in postprandial studies and clinical nutritional intervention studies.
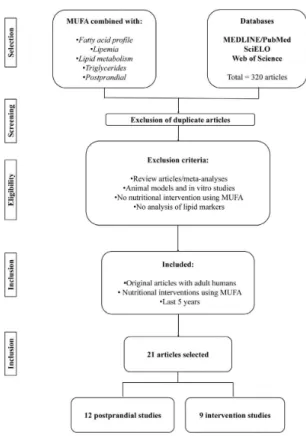
METHODOLOGY
Searches were run on the MEDLINE/PubMed, SciELO and Web of Science databases for work published in Portuguese, English or Spanish from
2010 to 2014. The following keywords were used to identify articles of interest: MUFA, Lipemia, Lipid Metabolism, Triglycerides and Postprandial, plus combinations of these terms and expressions containing
them. Searches were run using these keywords with
the Boolean connectors AND, OR and NOT. The titles and abstracts of the studies identiied by the electronic
search were then selected or rejected according to the
following inclusion criteria: MUFA intake during the
study period, intervention studies or postprandial, studies with adult humans that assessed changes in
the plasma lipid proile after consumption of MUFA. Articles describing animal models and in vitro studies were excluded, as were any that did not assess the effects of MUFA intake on lipid metabolism after dietary intervention. Additionally, editorials, articles lacking suficient data, summaries of presentations
to meetings and studies that did not consider the association between consumption of a source of
MUFA and markers of lipid metabolism were also excluded.
The full texts of potentially relevant articles were
read in order to verify that they met the inclusion
criteria. Additionally, articles from other sources
were also included in the review with the objective
of contextualizing and justifying the subject under
discussion and to enrich that discussion.
RESULTS AND DISCUSSION
The search and selection process (Figure 1) resulted in 21 articles, which are described in detail in Tables 1 and 2.
Table 1. Acute efects of monounsaturated fatty acid intake on markers of lipid metabolism. Authors Type of
study
Sample Duration of intervention
Test groups Quantity of MUFA ingested
Main results (MUFA)
Jiménez- Gómez et al.7
Randomized 130 people with MS BMI = NR Age = NR
8 hours Group 1: 38% SFA Group 2: 43% MUFA Group 3: low fat diet
(28%) + omega 3 Group 4: low fat diet
(28%)
43% of total lipids accentuated ↑ in TAG, returning to baseline in a shorter time than
other groups
Hartwich et al.8 Randomized 164 people with MS
criteria BMI = 20 to 40 kg/m2
Age = 35 to 70 years
8 hours Group1: 16% SFA Group2: 20% MUFA Group 3: low fat diet
+ omega 3 Group 4: low fat diet
20% of TCV of the meal
accentuated ↑ in TAG, returning to baseline in a shorter time than
other groups
Bouwens et al.9 Randomized
Single-blind Crossover
21 healthy men BMI = 18 to 27 kg/m2
Age 19 to 27 years
6 hours Group1: 70% SFA Group 2: 80% MUFA
Group 3: 65% PUFA
55 g (80% of total lipids)
Greater reduction in cholesterol after 6h compared to other
groups Perez-
Martinez et al.1
Randomized Crossover
20 healthy men BMI = 24.5±2.7 kg/m2
Age = 22±1.8 years
11 hours Group 1: 35% SFA Group 2: 36% MUFA Group 3: 55% CHO+
8% PUFA
36% of total lipids ↓ in total number and
↑ in size of TRL
↓ cardiovascular risk compared to other
groups Lopez et al.10 Crossover 14 hypertriglyceridemic
men BMI = 24.2±5.1 kg/m2
Age = 33±7 years
8 hours Group1: 10 kcal of MUFA per kg of body
weight Group2: 10 kcal of SFA per kg of body
weight Group 3: Control
(without lipids)
10 kcal/kg weight ↑ TAG, ↑ NEFA, ↑ insulin (Groups 1
and 2)
Teng et al.11 Randomized
Single-blind Crossover
10 healthy men BMI = 21±1.6 kg/m2
Age = 21.9±0.7 years
4 hours Group 1: 50 g of MUFA Group 2: 50 g of SFA Group 3: 50 g of PUFA
50 g ↑ in TAG was greatest in Group 1, followed
by Group 2
Lozano et al.12 Randomized
Crossover
21 healthy men BMI > 26.18 kg/m2
and BMI < 26.18 kg/m2
Age = 23±1.5 years
11 hours Group 1: 38% MUFA Group 2: 35% SFA Group 3: 20% SFA, 24% MUFA and 16%
PUFA
38% of TCV of the meal
↓ TRL-TAG compared to other groups
Van Dijk et al.13 Randomized
Crossover
42 men (healthy weight, obese and obese with type 2
diabetes) BMI = NR Age = 50 to 70 years
4 hours Group 1: 51 g of SFA Group 2: 79 g of
MUFA Group 3: 38 g of PUFA
79 g ↓ Free fatty acids over time (MUFA > SFA >
PUFA)
Lozano et al.2 Randomized
Crossover
21 men BMI = NR Age = 23±1.5 years
11 hours Group 1: 38% MUFA Group 2: 35% SFA Group 3: 20% SFA, 24% MUFA and 16%
PUFA
38% of TCV of the meal
No diferences be-tween groups
Raz et al.14 Crossover 54 individuals
BMI = 25±0.9 kg/m2
Age = 41.7±3.1 years
4 hours Group 1: 51 g of MUFA Group 2: 51 g of SFA
51 g ↑ in TAG smaller after MUFA
Pietraszek et al.15 NR 17 healthy people
17 people with DM2 BMI= NR Age = NR
4 hours Group 1: free from DM2, MUFA intake Group 2: with DM2,
MUFA intake
67 g Healthy people responded better to
treatment
Cabello- Moruno et al.16
Randomized Crossover
10 healthy men BMI = 23.7±2 kg/m2
Age = 26±4.3 years
6 hours Group 1: 70 g pomace olive oil (MUFA) Group 2: 70 g reined
olive oil (MUFA)
70 g No diferences in TAG between groups Larger TRL Particles in
the pomace group
MUFA: monounsaturated fatty acids; PUFA: polyunsaturated fatty acids; SFA: saturated fatty acids; DM2: type 2 Diabetes mellitus; TAG: triacylglycerols; NEFA: non-esteriied fatty acids; TRL: triacylglycerol-rich lipoproteins; CHO: carbohydrates; iAUC: incremental area under the curve; ↑: increase/high quantity;
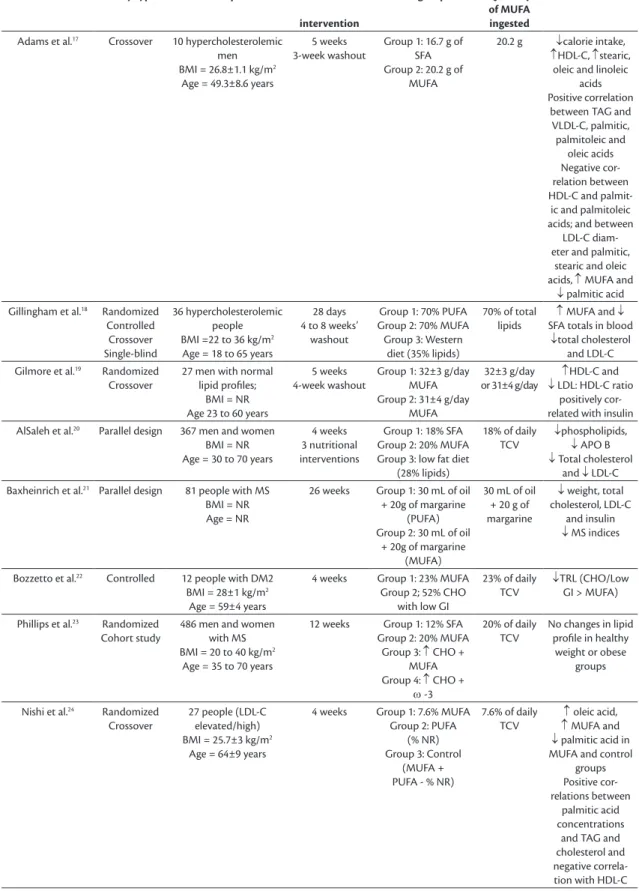
Table 2. Efect of dietary intervention containing monounsaturated fatty acids on markers of lipid metabolism. Authors Study type Sample Duration of
intervention
Test groups Quantity of MUFA ingested
Main results
Adams et al.17 Crossover 10 hypercholesterolemic
men BMI = 26.8±1.1 kg/m2
Age = 49.3±8.6 years
5 weeks 3-week washout
Group 1: 16.7 g of SFA Group 2: 20.2 g of
MUFA
20.2 g ↓calorie intake,
↑HDL-C, ↑stearic, oleic and linoleic
acids Positive correlation
between TAG and VLDL-C, palmitic, palmitoleic and
oleic acids Negative cor-relation between HDL-C and palmit-ic and palmitolepalmit-ic acids; and between
LDL-C diam-eter and palmitic,
stearic and oleic acids, ↑ MUFA and
↓ palmitic acid Gillingham et al.18 Randomized
Controlled Crossover Single-blind
36 hypercholesterolemic people BMI =22 to 36 kg/m2
Age = 18 to 65 years
28 days 4 to 8 weeks’
washout
Group 1: 70% PUFA Group 2: 70% MUFA Group 3: Western
diet (35% lipids)
70% of total lipids
↑ MUFA and ↓ SFA totals in blood
↓total cholesterol and LDL-C Gilmore et al.19 Randomized
Crossover
27 men with normal lipid proiles;
BMI = NR Age 23 to 60 years
5 weeks 4-week washout
Group 1: 32±3 g/day MUFA Group 2: 31±4 g/day
MUFA
32±3 g/day or 31±4 g/day
↑HDL-C and
↓ LDL: HDL-C ratio positively cor-related with insulin AlSaleh et al.20 Parallel design 367 men and women
BMI = NR Age = 30 to 70 years
4 weeks 3 nutritional interventions
Group 1: 18% SFA Group 2: 20% MUFA Group 3: low fat diet
(28% lipids)
18% of daily TCV
↓phospholipids,
↓ APO B
↓ Total cholesterol and ↓ LDL-C Baxheinrich et al.21 Parallel design 81 people with MS
BMI = NR Age = NR
26 weeks Group 1: 30 mL of oil + 20g of margarine
(PUFA) Group 2: 30 mL of oil
+ 20g of margarine (MUFA)
30 mL of oil + 20 g of margarine
↓ weight, total cholesterol, LDL-C
and insulin
↓ MS indices
Bozzetto et al.22 Controlled 12 people with DM2
BMI = 28±1 kg/m2
Age = 59±4 years
4 weeks Group 1: 23% MUFA Group 2; 52% CHO
with low GI
23% of daily TCV
↓TRL (CHO/Low GI > MUFA)
Phillips et al.23 Randomized
Cohort study
486 men and women with MS BMI = 20 to 40 kg/m2
Age = 35 to 70 years
12 weeks Group 1: 12% SFA Group 2: 20% MUFA
Group 3: ↑ CHO + MUFA Group 4: ↑ CHO +
ω -3
20% of daily TCV
No changes in lipid proile in healthy
weight or obese groups
Nishi et al.24 Randomized
Crossover
27 people (LDL-C elevated/high) BMI = 25.7±3 kg/m2
Age = 64±9 years
4 weeks Group 1: 7.6% MUFA Group 2: PUFA
(% NR) Group 3: Control
(MUFA + PUFA - % NR)
7.6% of daily TCV
↑ oleic acid,
↑ MUFA and
↓ palmitic acid in MUFA and control
groups Positive cor-relations between
palmitic acid concentrations
and TAG and cholesterol and negative correla-tion with HDL-C
Markers of lipid metabolism
When discussing CVD, it is impossible not to consider their primary prevention, the traditional risk factors associated with them (systemic arterial hypertension, diabetes mellitus and dyslipidemia, among others) and the markers of risk and for diagnosing these events, the most often employed of which are
total cholesterol (TC) and fractions, HDL cholesterol (HDL-C) and LDL cholesterol (LDL-C), TAG and
arterial blood pressure.26,27
However, attempts have been made to identify new markers, with the objective of improving early diagnosis rates and treatment of cardiovascular events.
The most interesting candidates are apolipoproteins, analysis of the size and diameter of lipoprotein particles and of the quantities of TAG present in these particles
and free fatty acids in plasma.
On this basis lipoproteins can be divided into two
groups: (1) those that are rich in TAG and are larger and
less dense, including chylomicrons, which originate in the intestines, and very low density lipoproteins (VLDL-C) from the liver; and (2) those that are rich in cholesterol, including low density cholesterol
(LDL-C) and high density cholesterol (HDL-C).27
Triglyceride-rich lipoproteins (TRL) are made up
of proteins and lipids and their composition changes dynamically in response to a person’s diet and lipid
metabolism. This composition, in turn, determines the
length of time they remain in circulation and their rate of absorption and transport through the endothelium,
playing an important role in atherogenesis.28 The size
and number of TRL particles may be better predictors of atherosclerosis than simply assaying TAG,1 since TAG are measured in a fasting state and atherosclerosis may be a postprandial phenomenon in which TRL
play a dominant role.29
Triglyceride-rich lipoproteins consist of chylomicrons,
originating from the small intestine and containing
apo B-48 as a structural protein, and VLDL, which
originate in the liver and contain apo B-100, as a
structural protein.16 Additionally, there is evidence
that postprandial TRL elevation can lead to pancreatic
beta cell dysfunction, suggesting that the plasma lipoprotein abnormalities observed in patients with obesity-linked metabolic syndrome (MS) may not
be merely a consequence of the disease, but also a
cause of it.12 Triglyceride-rich lipoproteins can cross
the endothelial barrier, enter the wall of the vessel and facilitate build-up of lipids in macrophages,
forming foam cells.16
It is against this background that scientific interest in markers of postprandial lipemia has been increasing, since there could be other metabolites of
lipid metabolism that could be identiied more quickly
after dietary intake, which could facilitate diagnosis of certain diseases or the risk of cardiovascular events.
According to the studies identiied, in general the
concentration of the classic markers of CVD, such as
TC and its fractions, do not change after dietary intake
and so they may not be good markers for assessing
acute effects.1,7-9,12 In contrast, TAG concentrations
have been shown to change after meals and may provide more plausible evidence as predictors of risk
of CVD,7-12 and the same is true of TRL.1,12,16
Acute efects of MUFA intake on lipid metabolism: postprandial studies
This review identiied 12 studies published in the
last 5 years that evaluated postprandial changes in the
lipid proile after subjects had eaten a meal containing MUFA. Researchers investigated postprandial
responses in men of healthy weight,1,2,9,11,12,14,16,30 and
in obese or healthy-weight people with type 2 diabetes
mellitus (DM2),15,31 hyperlipoproteinemia10 or MS.7,8
The body mass index (BMI) of participants varied
from 20 to 40 kg/m2 and their ages ranged from 19
to 70 years. The test foods used as sources of MUFA included drinks and shakes, mufins and meals with Authors Study type Sample Duration of
intervention
Test groups Quantity of MUFA ingested
Main results
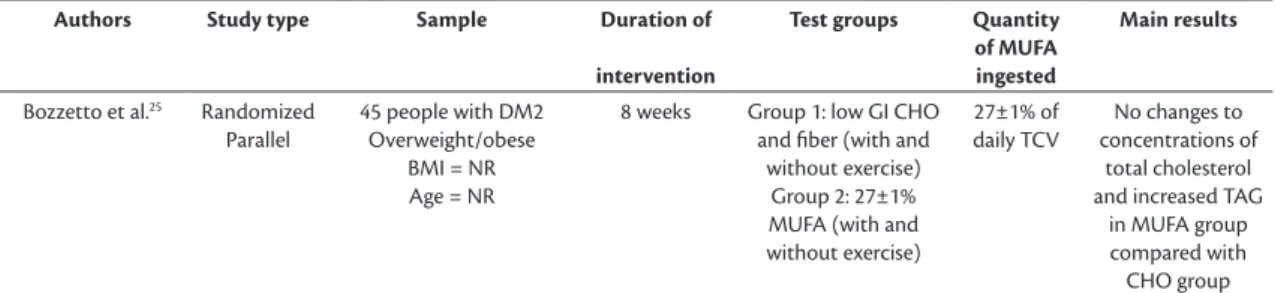
Bozzetto et al.25 Randomized
Parallel
45 people with DM2 Overweight/obese
BMI = NR Age = NR
8 weeks Group 1: low GI CHO and iber (with and
without exercise) Group 2: 27±1% MUFA (with and without exercise)
27±1% of daily TCV
No changes to concentrations of
total cholesterol and increased TAG
in MUFA group compared with CHO group
MUFA: monounsaturated fatty acids; PUFA: polyunsaturated fatty acids; SFA: saturated fatty acids; ω-3: omega 3 fatty acid; TAG: triacylglycerols; NEFA: non-esteriied fatty acids; TRL: triacylglycerol-rich lipoproteins; CHO: carbohydrates; GI: glycemic index; ↑: increase/high quantity; ↓: decrease/low quantity; MS: metabolic syndrome; NR: not reported.
the lipid under investigation added (sources: olive
oil, sunlower oil and/or macadamia oil) and with MUFA contents varying from 20 to 80% of the total
lipids in the meals given to the participants.
The duration of the postprandial lipemia cycle in healthy adults is from 6 to 8h,32 contrasting with the
results of the articles reviewed, in which the duration
of the cycle ranged from 4 to 11h. The markers
most often used to evaluate postprandial lipidemic
responses were concentrations of TAG1,2,7-12,14-16,31 and concentrations and size of TRL.1,2,7,8,10,12,16,30
The majority of these studies demonstrated
that postprandial responses to meals with a high
content of saturated fatty acids (SFA), MUFA or polyunsaturated fatty acids (PUFA) diverge from one
another. Four studies observed a greater increase in
TAG concentrations after consumption of a meal with a high MUFA content than after intake of sources of SFA or PUFA.8,11,13 One explanation for this effect
could be that the TRL particles supplied by the MUFA-rich meal could have a greater afinity for the
hepatic receptor involved in metabolism, inducing
more rapid and effective clearance of these TRL than
of other types of lipids.12 Concentrations of TAG
could exhibit the same behavior when postprandial increase is balanced by more eficient clearance. Indeed, Jiménez-Gómez et al.7 and Hartwich et al.8
assessed people with MS and with symptoms of
MS, respectively, inding that those who ate a meal containing MUFA (43% and 20% of the total lipid content of the meal, respectively), exhibited a faster rise in TAG concentrations (peaks at 2h and 4h after
the meal, respectively) compared with those who were given other sources of lipids; although the return
to baseline levels was more eficient (at around 8h
after the meal).7,8
However, other studies with healthy people that
determined the concentrations of TAG found similar postprandial results for different types of fats (MUFA, PUFA and SFA).2,14,16 These differences in the results could be because of different quantities or sources of MUFA, the number of hours after the meal at which
concentrations were tested, age, number of people tested and prior nutritional status of participants (normal weight versus overweight), or even due to
metabolism of MUFA compared with other lipid
sources. Considering that the sources of lipids
eaten do not only contain SFA, MUFA and PUFA,
but also a wide variety of other nutrients, such as
carbohydrates, iber, protein, and other compounds
with biological activity, such as polyphenols and sterols, the postprandial results could also have been
inluenced by the presence of these nutrients.2
There is still no certainty about the postprandial
lipemic responses to consumption of different lipid
sources in people with excess weight and/or other
chronic diseases. Notwithstanding, the effects of
eating a meal with a high MUFA content have been shown to be beneicial for these people’s postprandial lipidemic response. For example, overweight people
who ate a meal containing 1g of olive oil per kg of
body weight had lower TRL concentrations than after eating a meal rich in butter (SFA) or nuts (PUFA),
whereas in a subset of people with healthy weights there
was no difference between different lipid sources.12
As such, the results reported indicate that MUFA have beneicial effects on postprandial lipid metabolism, and this could be an important mechanism of this FA’s cardioprotective action. Indeed, these indings suggest that the concentrations and size of postprandial TRL
could be promising biomarkers of lipid metabolism as predictors of metabolic disorders and cardiovascular risk. However, recommendations for their use in clinical practice should still be cautious, since the results are not conclusive in terms of the dosage needed to obtain a response.
he long-term efects of MUFA intake on lipid metabolism: intervention studies
A total of nine studies were selected that evaluated
markers of lipid metabolism as part of the follow-up of nutritional interventions based on diets with high
MUFA content, varying from 7.6% to 28% of the total calorie value (TCV), or from 20.2g to 32g of MUFA. The duration of interventions varied from 4 to 26 weeks. The volunteers were men and women, the majority with excess weight, or DM2 or abnormalities of markers of lipid metabolism (abnormal TAG, TC and/or LDL-C). The age of participants ranged from 18 to 70 years. The markers most often assessed were TAG, TC and fractions, in addition to total
lipids. Diets were calculated with dietary fat either
supplemented or substituted by MUFA. The test foods most often used as sources of MUFA were mufins made with olive oil, nuts, fortiied meats and extra
virgin olive oil itself.
The studies found reductions in TC,18,20,21,24
LDL-C,17,18,20,21 and TAG17,21 and increases in HDL-C.17,19
In general, cardiovascular risk factors (TC, LDL-C and TAG) reduced after intervention with MUFA and there were improvements in the lipid proile, compared with the other diets tested. These results appear to be related to the FA proile of the bloodstream.
For example, Gilmore et al.19 observed that a nutritional intervention with a high MUFA content
and reduced the LDL-C:HDL-C ratio.19 Plasma TAG
concentrations were positively correlated with plasma insulin concentration and negatively correlated with
HDL-C and stearic acid levels. These indings suggest that activity of hepatic Stearoyl-CoA Desaturase-1 (SCD1) can regulate plasma TAG concentrations.19
The proportion of palmitic acid (PA) was also
positively associated with plasma concentrations of
TAG and the TC:HDL-C ratio and inversely associated
with HDL-C concentrations among hyperlipidemic
individuals (high LDL-C plasma concentrations).24
In turn, the 10-year risk of CVD was inversely
associated with OA proportions. Saturated fatty acid
proportions were negatively associated with HDL-C concentrations and positively associated with 10-year
risk of CVD.24
Adams et al.17 found that palmitoleic acid (PTA)
was the fatty acid with the strongest correlation with
changes in TAG, VLDL-C and HDL-C, followed by PA. The highest plasma PTA concentrations were
observed at the end of the cycle after consumption
of SFA and the lowest concentration was observed after consumption of MUFA. These results suggest that the high concentration of PTA after SFA intake
is the result of increased stimulation of hepatic SCD1
activity, in contrast with MUFA intake.17
It is interesting that it was not only the concentrations of markers of lipid metabolism that were changed, since
the size of particles was also altered. The diameters
of LDL-C particles were reduced by a dietary
intervention with a high SFA content and remained
altered, even after a 3-week washout period and also
after consumption of a diet rich in MUFA.17 In a similar manner, plasma PA was increased by a high SFA diet and remained elevated thereafter. Changes in LDL-C particle diameter are speciic
metabolic abnormalities that increase the atherogenicity
of LDL-C. These small LDL-C particles are a risk
factor for CVD, since they are more susceptible to
oxidative damage and they also provoke vascular inlammation. Presence of PA in elevated concentrations
may also be related to small LDL-C diameter that is maintained over time and a negative correlation
has been detected between PA and the diameter of
LDL-C particles.17
However, four studies did not detect effects on
markers,19,22,23,25 although these results may be linked
with the fact that the studies did not compare a diet
rich in MUFA with other sources of lipids25 or may
be due to differences between the study participants
(age, sex, BMI, baseline values of markers of lipid
metabolism).
However, the reductions in these indicators of cardiovascular risk factors and the components of
MS observed in these studies may not be exclusively
the result of different dietary sources of lipids, but may also be associated with the reductions in weight
observed in some studies,17,21 which can be considered
a confounding factor, since weight loss itself improves
the lipid proile.
A considerable proportion of the interest in the role of MUFA in prevention of CVD is because of the beneicial effects of the Mediterranean diet that have been observed. This diet has a high olive oil content (14-40% of daily energy intake) and, consequently, is rich in MUFA.24 The protective effect of regular OA intake on parameters related to
CVD is primarily related to the Mediterranean region,
where the population’s diet includes a high MUFA intake because of greater olive oil consumption. The
reduction in cardiovascular risks may be linked to an
improvement in the proile of dietary lipoproteins
(increased HDL-C and reduced LDL-C), in addition to improved endothelial function due to an increase in
vasodilation-related low and reduced inlammation and oxidative stress.33
On the other hand, it is important to investigate
the possible positive effects of MUFA in people with
DM2, since DM2 is itself an independent risk factor for
CVD. The search for strategies to manage postprandial
dyslipidemia is therefore an issue of clinical relevance and nutritional changes achieved by adhering to a
dietary plan are capable of inluencing postprandial
lipid response in patients at cardiometabolic risk.
The intervention studies indicate that there are beneicial effects on markers do of lipid metabolism from habitual consumption of MUFA (12-28% of total
calorie value) contained in foods such as olive oil and nuts, in comparison with low fat diets or consumption of other sources of lipids. In fact, the intake levels that have shown positive results are higher than the level recommended for cardiovascular health, which
is around 15% MUFA as a proportion of TCV.26 The mechanisms through which MUFA act appear
to be related to their effect on the concentrations and
sizes of lipoprotein particles and, consequently, on
their metabolism at the cellular level.
CONCLUSIONS
As shown by the indings discussed in this review, MUFA intake in the form of habitual consumption of
olive oil and nuts is supported by the most up-to-date
(postprandial lipemia), primarily in relation to TAG
metabolism, and over the long term in association with
improvements in the plasma lipid proile, whether in terms of the concentrations or of the sizes of HDL-C
and LDL-C particles, which are well-known as CVD
protection and risk factors, respectively. These studies also emphasize the importance of determining the concentrations of fatty acids in plasma and the size
of lipoproteins as biomarkers of lipid metabolism and the relevance of postprandial testing to increase knowledge of the mechanisms involved.
ACKNOWLEDGMENTS
The authors thank CAPES for the Master’s scholarship granted to LL Lopes; and FAPEMIG and CNPq for the inancial support to this study. MCG Peluzio and HHM Hermsdorff receive research productivity fellowships from CNPq.
REFERENCES
1. Perez-Martinez P, Ordovas JM, Garcia-Rios A, et al. Consumption of diets with different type of fat influences triacylglycerols-rich lipoproteins particle number and size during the postprandial state. Nutr Metab Cardiovasc Dis. 2011;21(1):39-45. http://dx.doi. org/10.1016/j.numecd.2009.07.008. PMid:19819118.
2. Lozano A, Perez-Martinez P, Marin C, et al. An acute intake of a walnut-enriched meal improves postprandial adiponectin response in healthy young adults. Nutr Res. 2013;33(12):1012-8. http://dx.doi.org/10.1016/j.nutres.2013.08.010. PMid:24267040.
3. Chan DC, Pang J, Romic G, Watts GF. Postprandial hypertriglyceridemia and cardiovascular disease: current and future therapies. Curr Atheroscler Rep. 2013;15(3):309. http://dx.doi.org/10.1007/ s11883-013-0309-9. PMid:23345190.
4. Katsanos CS. Clinical considerations and mechanistic determinants of postprandial lipemia in older adults. Adv Nutr. 2014;5(3):226-34. http://dx.doi.org/10.3945/an.113.004903. PMid:24829469.
5. Bressan J, Hermsdorff HH, Zulet MA, Martínez JA. Hormonal and inflammatory impact of different dietetic composition: emphasis on dietary patterns and specific dietary factors. Arq Bras Endocrinol Metabol. 2009;53(5):572-81. http://dx.doi.org/10.1590/S0004-27302009000500010. PMid:19768248.
6. Oi-Kano Y, Kawada T, Watanabe T, et al. Extra virgin olive oil increases uncoupling protein 1 content in brown adipose tissue and enhances noradrenaline and adrenaline secretions in rats. J Nutr Biochem. 2007;18(10):685-92. http://dx.doi.org/10.1016/j. jnutbio.2006.11.009. PMid:17418557.
7. Jiménez-Gómez Y, Marín C, Peérez-Martínez P, et al. A low-fat, high-complex carbohydrate diet supplemented with long-chain (n-3) fatty acids alters the postprandial lipoprotein profile in patients with metabolic syndrome. J Nutr. 2010;140(9):1595-601. http://dx.doi.org/10.3945/jn.109.120816. PMid:20631323.
8. Hartwich J, Leszczynska-Golabek I, Kiec-Wilk B, et al. Lipoprotein profile, plasma ischemia modified albumin and LDL density change in the course of postprandial lipemia. Insights from the LIPGENE study. Scand J Clin Lab Invest. 2010;70(3):201-8. http:// dx.doi.org/10.3109/00365511003663630. PMid:20233037.
9. Bouwens M, Grootte Bromhaar M, Jansen J, Müller M, Afman LA. Postprandial dietary lipid-specific effects on human peripheral blood mononuclear cell gene expression profiles. Am J Clin Nutr. 2010;91(1):208-17. http://dx.doi.org/10.3945/ajcn.2009.28586. PMid:19923369.
10. Lopez S, Bermudez B, Ortega A, et al. Effects of meals rich in either monounsaturated or saturated fat on lipid concentrations and on insulin secretion and action in subjects with high fasting triglyceride concentrations. Am J Clin Nutr. 2011;93(3):494-9. http://dx.doi.org/10.3945/ajcn.110.003251. PMid:21209225. 11. Teng KT, Nagapan G, Cheng HM, Nesaretnam K. Palm olein and
olive oil cause a higher increase in postprandial lipemia compared with lard but had no effect on plasma glucose, insulin and adipocytokines. Lipids. 2011;46(4):381-8. http://dx.doi.org/10.1007/ s11745-010-3516-y. PMid:21197586.
12. Lozano A, Perez-Martinez P, Delgado-Lista J, et al. Body mass interacts with fat quality to determine the postprandial lipoprotein response in healthy young adults. Nutr Metab Cardiovasc Dis. 2012;22(4):355-61. http://dx.doi.org/10.1016/j.numecd.2010.07.013. PMid:21093231.
13. Van Dijk S, Feskens E, Bos MB, et al. Consumption of a high monounsaturated fat diet reduces oxidative phosphorylation gene expression in peripheral blood mononuclear cells of abdominally overweight. J Nutr. 2012;142(7):1219-25. http://dx.doi.org/10.3945/ jn.111.155283. PMid:22623392.
14. Raz O, Steinvil A, Berliner S, Rosenzweig T, Justo D, Shapira I. The effect of two iso-caloric meals containing equal amounts of fats with a different fat composition on the inflammatory and metabolic markers in apparently healthy volunteers. J Inflamm. 2013;10(1):3. http://dx.doi.org/10.1186/1476-9255-10-3. PMid:23369030.
15. Pietraszek A, Gregersen S, Pedersen SB, Holst JJ, Hermansen K. Acute effects of monounsaturated fat on postprandial lipemia and gene expression in first-degree relatives of subjects with type 2 diabetes. Eur J Clin Nutr. 2014;68(9):1022-8. http://dx.doi. org/10.1038/ejcn.2014.64. PMid:24824014.
16. Cabello-Moruno R, Martinez-Force E, Montero E, Perona JS. Minor components of olive oil facilitate the triglyceride clearance from postprandial lipoproteins in a polarity-dependent manner in healthy men. Nutr Res. 2014;34(1):40-7. http://dx.doi.org/10.1016/j. nutres.2013.10.003. PMid:24418245.
17. Adams TH, Walzem RL, Smith DR, Tseng S, Smith SB. Hamburger high in total, saturated and trans-fatty acids decreases HDL cholesterol and LDL particle diameter, and increases TAG, in mildly hypercholesterolaemic men. Br J Nutr. 2010;103(1):91-8. http://dx.doi.org/10.1017/S0007114509991516. PMid:19674491.
18. Gillingham LG, Gustafson JA, Han S-Y, Jassal DS, Jones PJH. High-oleic rapeseed (canola) and flaxseed oils modulate serum lipids and inflammatory biomarkers in hypercholesterolaemic subjects. Br J Nutr. 2011;105(3):417-27. http://dx.doi.org/10.1017/ S0007114510003697. PMid:20875216.
19. Gilmore LA, Walzem RL, Crouse SF, et al. Consumption of high-oleic acid ground beef increases HDL-cholesterol concentration but both high- and low-oleic acid ground beef decrease HDL particle diameter in normocholesterolemic men. J Nutr. 2011;141(6):1188-94. http://dx.doi.org/10.3945/jn.110.136085. PMid:21525253.
20. AlSaleh A, O’Dell SD, Frost GS, et al. Interaction of PPARG Pro12Ala with dietary fat influences plasma lipids in subjects at cardiometabolic risk. J Lipid Res. 2011;52(12):2298-303. http:// dx.doi.org/10.1194/jlr.P019281. PMid:21949049.
21. Baxheinrich A, Stratmann B, Lee-Barkey YH, Tschoepe D, Wahrburg U. Effects of a rapeseed oil-enriched hypoenergetic diet with a high
risk profile in patients with the metabolic syndrome. Br J Nutr. 2012;108(4):682-91. http://dx.doi.org/10.1017/S0007114512002875. PMid:22894911.
22. Bozzetto L, De Natale C, Di Capua L, et al. The association of hs-CRP with fasting and postprandial plasma lipids in patients with type 2 diabetes is disrupted by dietary monounsaturated fatty acids. Acta Diabetol. 2013;50(2):273-6. http://dx.doi.org/10.1007/ s00592-011-0318-5. PMid:21833777.
23. Phillips CM, Tierney AC, Perez-Martinez P, et al. Obesity and body fat classification in the metabolic syndrome: impact on cardiometabolic risk metabotype. Obesity. 2013;21(1):154-61. http://dx.doi.org/10.1002/oby.20263. PMid:23505198.
24. Nishi S, Kendall CWC, Gascoyne A, et al. Effect of almond consumption on the serum fatty acid profile : a dose – response study. Br J Nutr. 2014;112(7):1137-46. http://dx.doi.org/10.1017/ S0007114514001640. PMid:25138064.
25. Bozzetto L, Annuzzi G, Costabile G, et al. A CHO/fibre diet reduces and a MUFA diet increases postprandial lipaemia in type 2 diabetes: no supplementary effects of low-volume physical training. Acta Diabetol. 2014;51(3):385-93. http://dx.doi.org/10.1007/s00592-013-0522-6. PMid:24132660.
26. Santos R, Gagliardi A, Xavier H, Magnoni C, Cassani R, Lottenberg AI. Diretriz sobre o consumo de gorduras e saúde cardiovascular. Arq Bras Cardiol. 2013;100(3):1-40. PMid:23598585.
27. Xavier HT, Izar MC, Faria JR No, et al. V Diretriz Brasileira de Dislipidemias e Prevenção da Aterosclerose. Arq Bras Cardiol. 2013;101(4, Supl 1):1-20. http://dx.doi.org/10.5935/abc.2013S010. PMid:24217493.
28. Wang YI, Bettaieb A, Sun C, et al. Triglyceride-rich lipoprotein modulates endothelial vascular cell adhesion molecule (VCAM)-1 expression via differential regulation of endoplasmic reticulum stress. PLoS One. 2013;8(10):1-13. PMid:24205197.
29. Nordestgaard BG, Benn M, Schnohr P, Tybjaerg-Hansen A. Nonfasting triglycerides and risk of myocardial infarction, ischemic heart disease, and death in men and women. JAMA. 2007;298(3):299-308. http://dx.doi.org/10.1001/jama.298.3.299. PMid:17635890.
30. Varela LM, Ortega-Gomez A, Lopez S, Abia R, Muriana FJG, Bermudez B. The effects of dietary fatty acids on the postprandial triglyceride-rich lipoprotein/apoB48 receptor axis in human monocyte/macrophage cells. J Nutr Biochem. 2013;24(12):2031-9. http://dx.doi.org/10.1016/j.jnutbio.2013.07.004. PMid:24231096.
31. Van Dijk SJ, Mensink M, Esser D, Feskens EJM, Müller M, Afman LA. Responses to high-fat challenges varying in fat type in subjects with different metabolic risk phenotypes: a randomized trial. PLoS One. 2012;7(7):e41388. http://dx.doi.org/10.1371/journal. pone.0041388. PMid:22844471.
32. Petto J, Vasques LMR, Pinheiro RL, et al. Comparison of postprandial lipemia between women who are on oral contraceptive methods and those who are not. Arq Bras Cardiol. 2014;103(3):245-50. PMid:25317941.
33. Sales-Campos H, Souza PR, Peghini BC, Silva JS, Cardoso CR. An overview of the modulatory effects of oleic acid in health and disease. Mini Rev Med Chem. 2013;13(2):201-10. PMid:23278117.
*
Correspondence
Helen Hermana Miranda Hermsdorf Universidade Federal de Viçosa – UFV, Department of Nutrition and Health Av. Peter Henry Rolfs, s/n - Campus Universitário CEP 36570-900 - Viçosa (MG), Brazil Tel.: +55 (31) 3899-1269/ +55 (31) 3899-2545 E-mail: [email protected]
Author information
LLL - MSc in Nutrition Science from Universidade Federal de Viçosa (UFV). MCGP - Associate professor IV, Department of Nutrition and Health of the Universidade Federal de Viçosa (UFV). HHMH - Assistant professor III, Department of Nutrition and Health of the Universidade Federal de Viçosa (UFV).
Author contributions
Conception and design: LLL, MCGP, HHMH Analysis and interpretation: LLL, MCGP, HHMH Data collection: LLL, MCGP, HHMH Writing the article: LLL, MCGP, HHMH Critical revision of the article: LLL, MCGP, HHMH Final approval of the article*: LLL, MCGP, HHMH Statistical analysis: N/A. Overall responsibility: LLL, MCGP, HHMH